
Medicaid Home and Community-Based Services Programs: 2012 Data Update
As states continue to implement various aspects of the Affordable Care Act (ACA), developing and expanding home and community-based alternatives to institutional care remains a priority for many state Medicaid programs. 2013 marked the first time that home and community-based services (HCBS) accounted for the majority of national Medicaid long-term services and supports (LTSS) dollars (51%), increasing from 18 percent in 1995.1 State Medicaid programs are operating in an environment of sustained economic improvement and as of 2015, continue to face the competing priorities of implementing the ACA’s streamlined eligibility and enrollment processes, determining whether to adopt the ACA’s Medicaid expansion, and pursuing a variety of delivery and payment system reforms. States also continue to have access to some of ACA’s new and expanded LTSS options, some of which offer enhanced federal matching funds, to expand beneficiary access to Medicaid HCBS.
This report summarizes the key national trends to emerge from the latest (2012) participant and expenditure data for the three main Medicaid HCBS programs: (1) the mandatory home health services state plan benefit, (2) the optional personal care services state plan benefit, and (3) optional § 1915(c) HCBS waivers. It also briefly discusses the provision of Medicaid HCBS through § 1115 demonstration waivers and highlights findings from a 2014 survey of Medicaid HCBS participant eligibility, enrollment, and provider reimbursement policies. States also may provide HCBS through various options offered by the ACA, which are outside the scope of this report.
Key Findings: Trends in Medicaid HCBS Participants and Expenditures, 2002-2012
- In 2012, more than 3.2 million people accessed LTSS through one of the three main Medicaid HCBS programs (Figure 1). Within this population, the number of people receiving § 1915(c) waiver services increased slightly from 2011 to 2012 (by 3%), while the number of people receiving personal care state plan services and home health state plan services decreased (by 2% and 4%, respectively). A total of 764,487 people received home health state plan services (in 50 states and DC), 944,507 received personal care state plan services (in 32 states), and almost 1.5 million were served through § 1915(c) waivers (in 47 states and DC). The number of individual § 1915(c) waivers declined slightly (<1%) to 290 nationwide in 2012. States also may offer HCBS through the new ACA options instead of or in addition to these three programs.
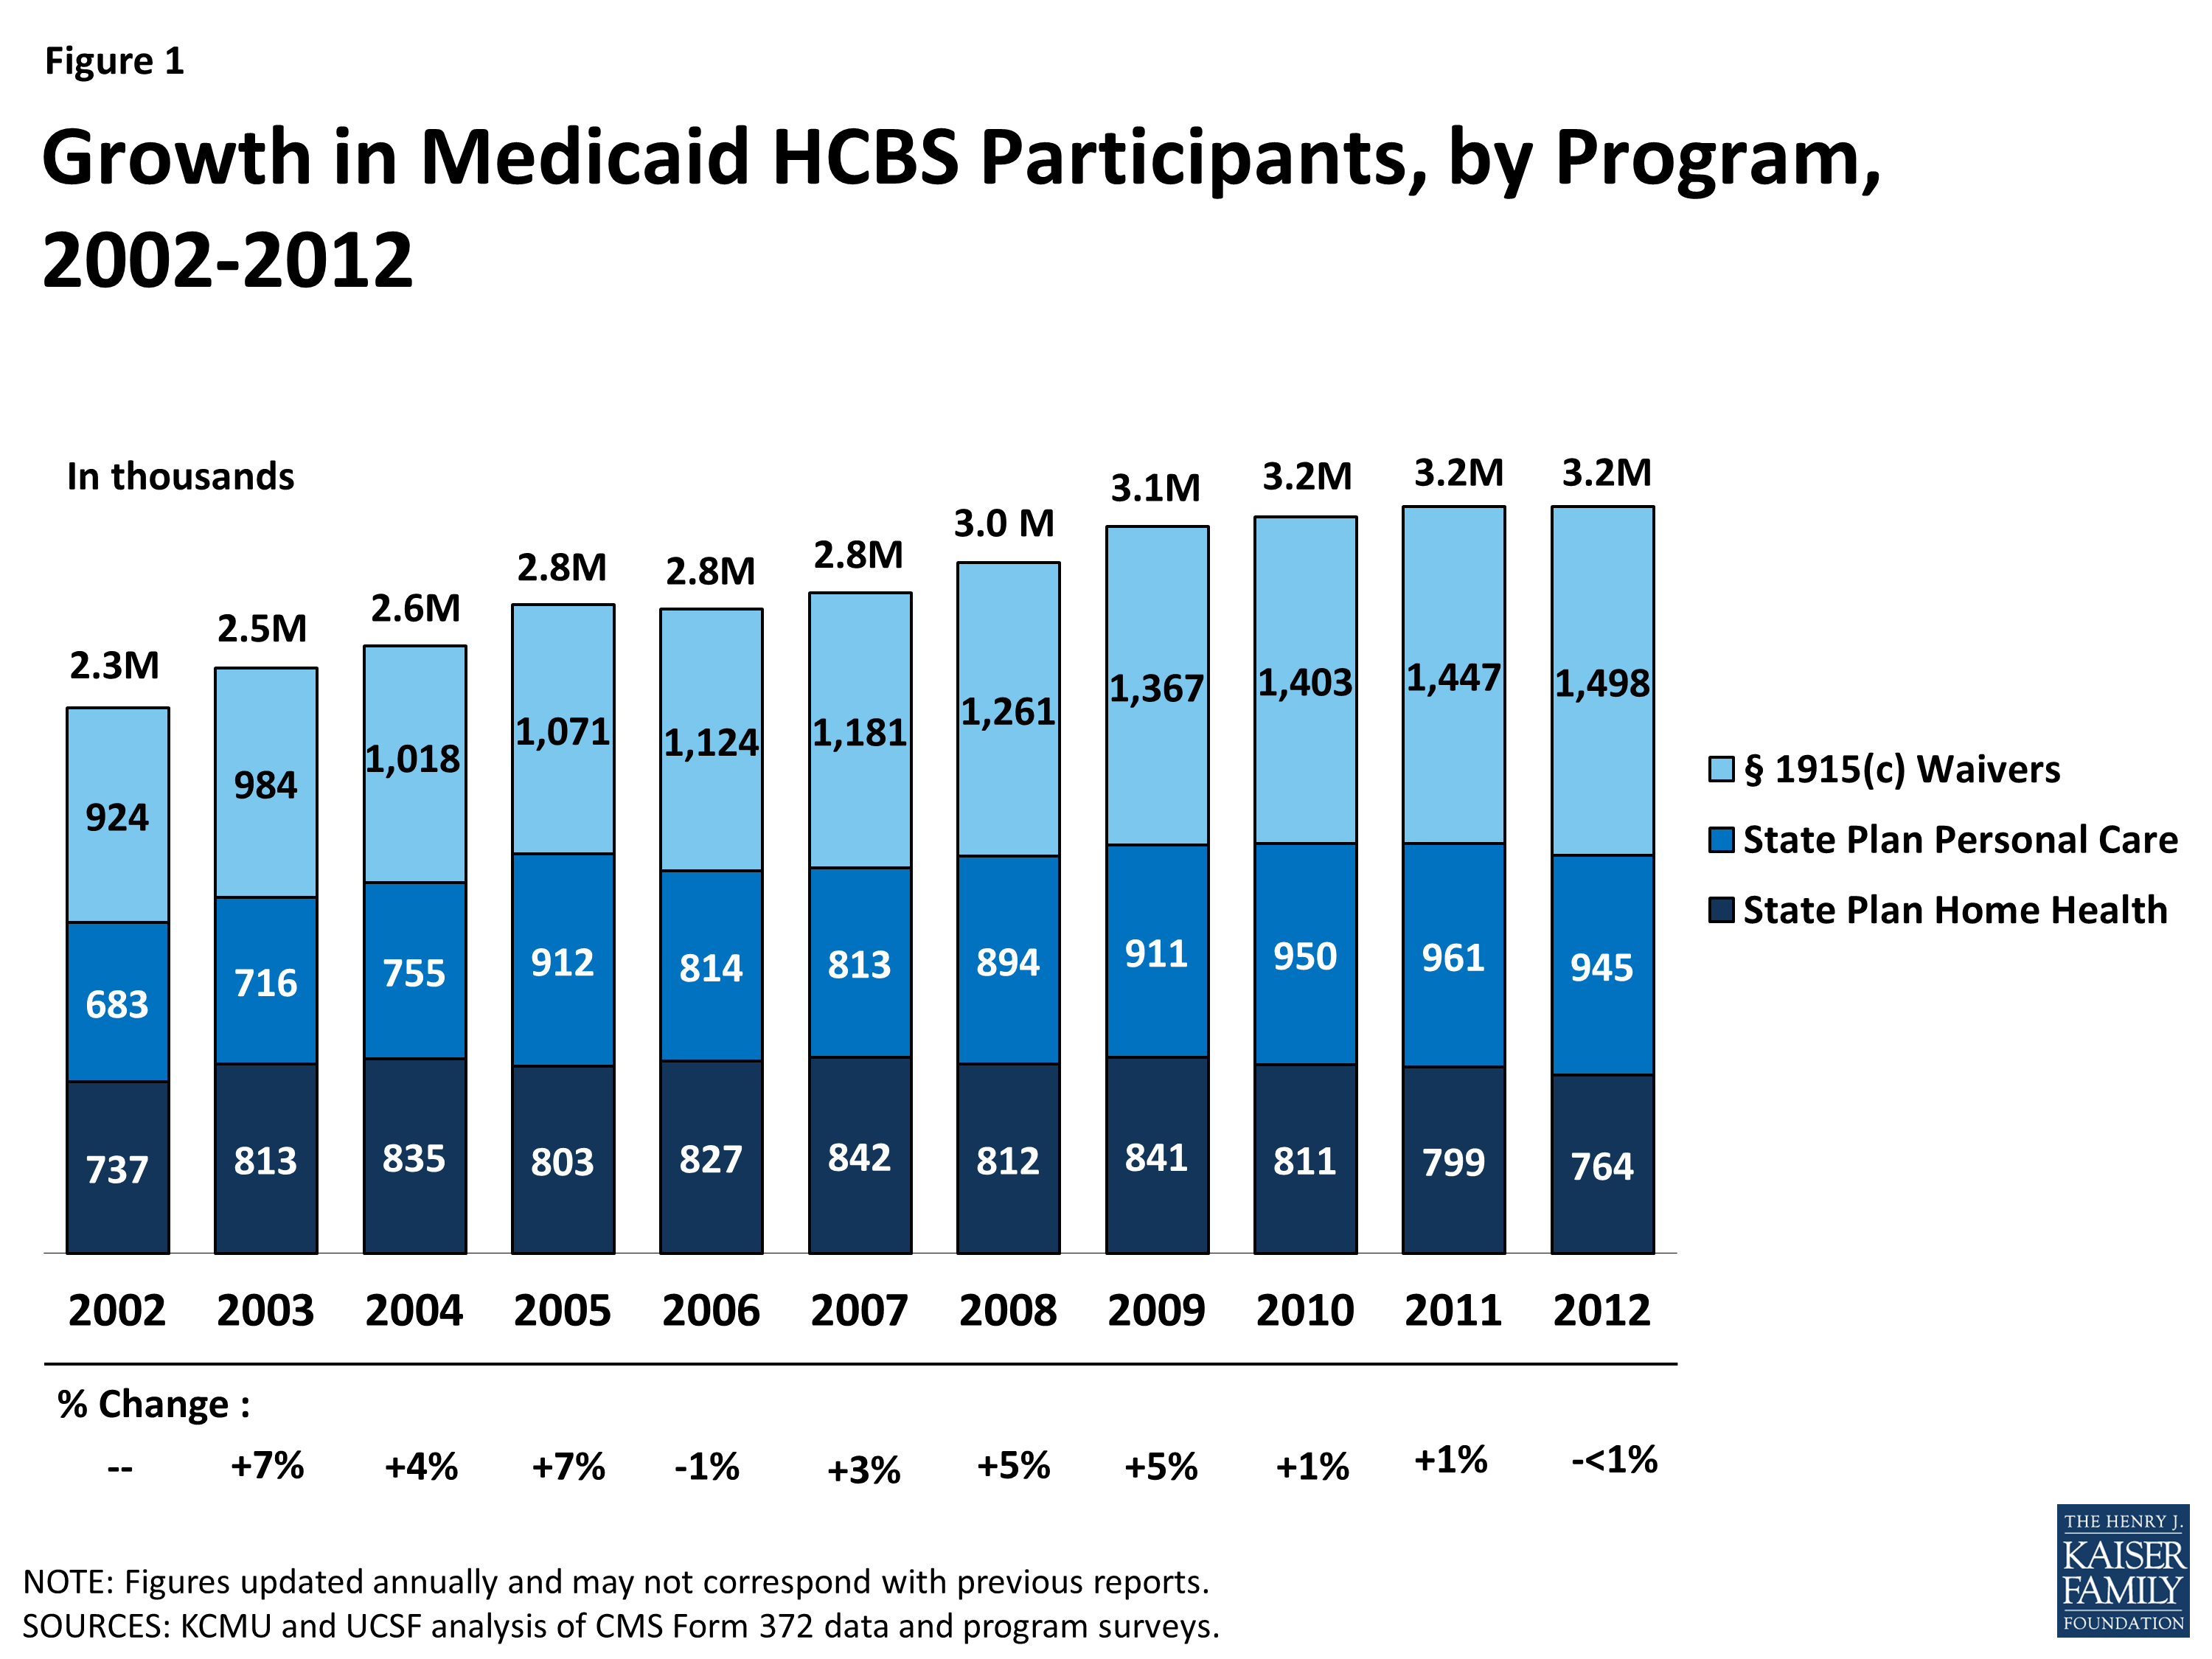
Figure 1: Growth in Medicaid HCBS Participants, by Program, 2002-2012
- In 2012, Medicaid HCBS expenditures for home health state plan services, personal care state plan services, and § 1915(c) waivers totaled $55 billion, increasing slightly from 2011, and lower than the 10-year average of eight percent (Figure 2). In 2012, spending growth in HCBS programs was led by § 1915(c) waivers (6%), followed by home health state plan services (1%). Expenditures on personal care state plan services declined by 20 percent from 2011, with most of the decline driven by California’s shifting of funding to its new Community First Choice state plan option.
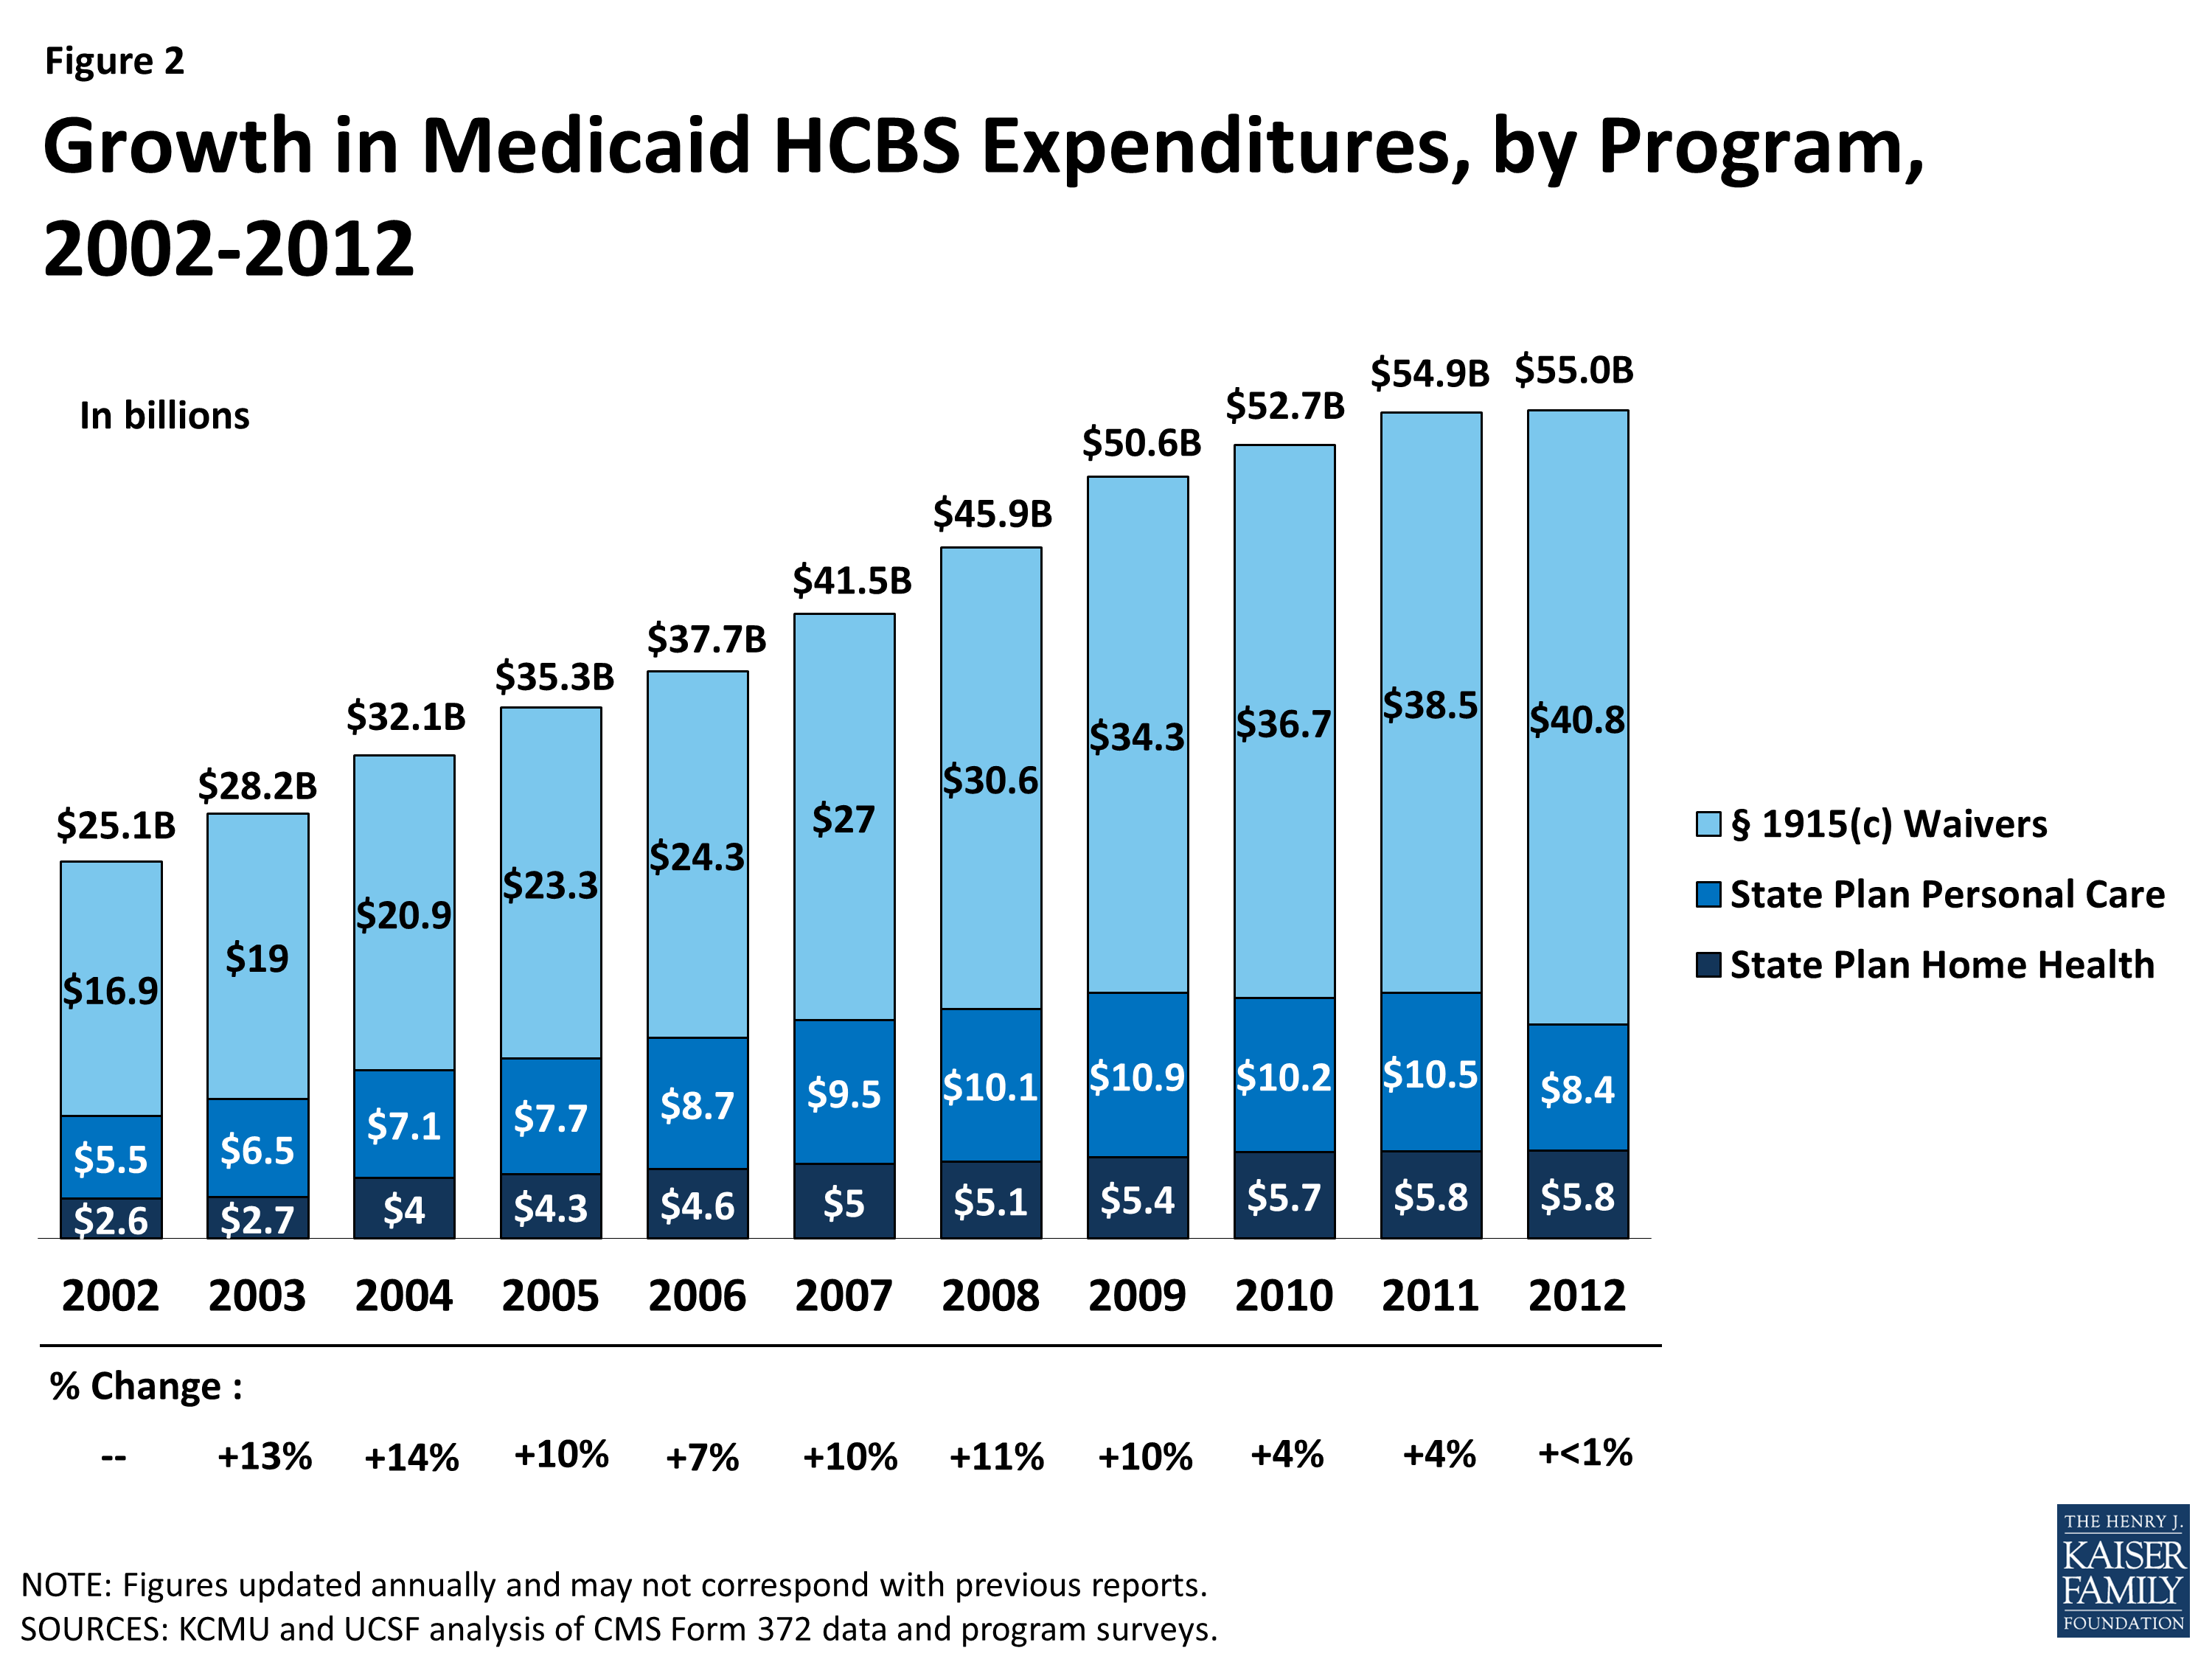
Figure 2: Growth in Medicaid HCBS Expenditures, by Program, 2002-2012
- Per participant annual spending on Medicaid HCBS averaged $17,151 in 2012, but there was considerable variation among states and programs. Across the states, Medicaid HCBS expenditures per participant served ranged from $8,787 in Mississippi to $42,556 in Tennessee. Per participant spending also varied across the three main HCBS programs, ranging from a national average of $7,617 for home health state plan services participants to $27,232 for § 1915(c) waiver participants. These program-to-program differences were due to the types and extent of services offered in the different home and community-based programs. Per participant spending also varied among § 1915(c) waivers targeted to different beneficiary populations. For example, per participant spending in § 1915(c) waivers targeted to beneficiaries with intellectual/developmental disabilities (I/DD) was considerably higher than for other beneficiary groups, reflecting the I/DD population’s relatively more intensive need for LTSS.
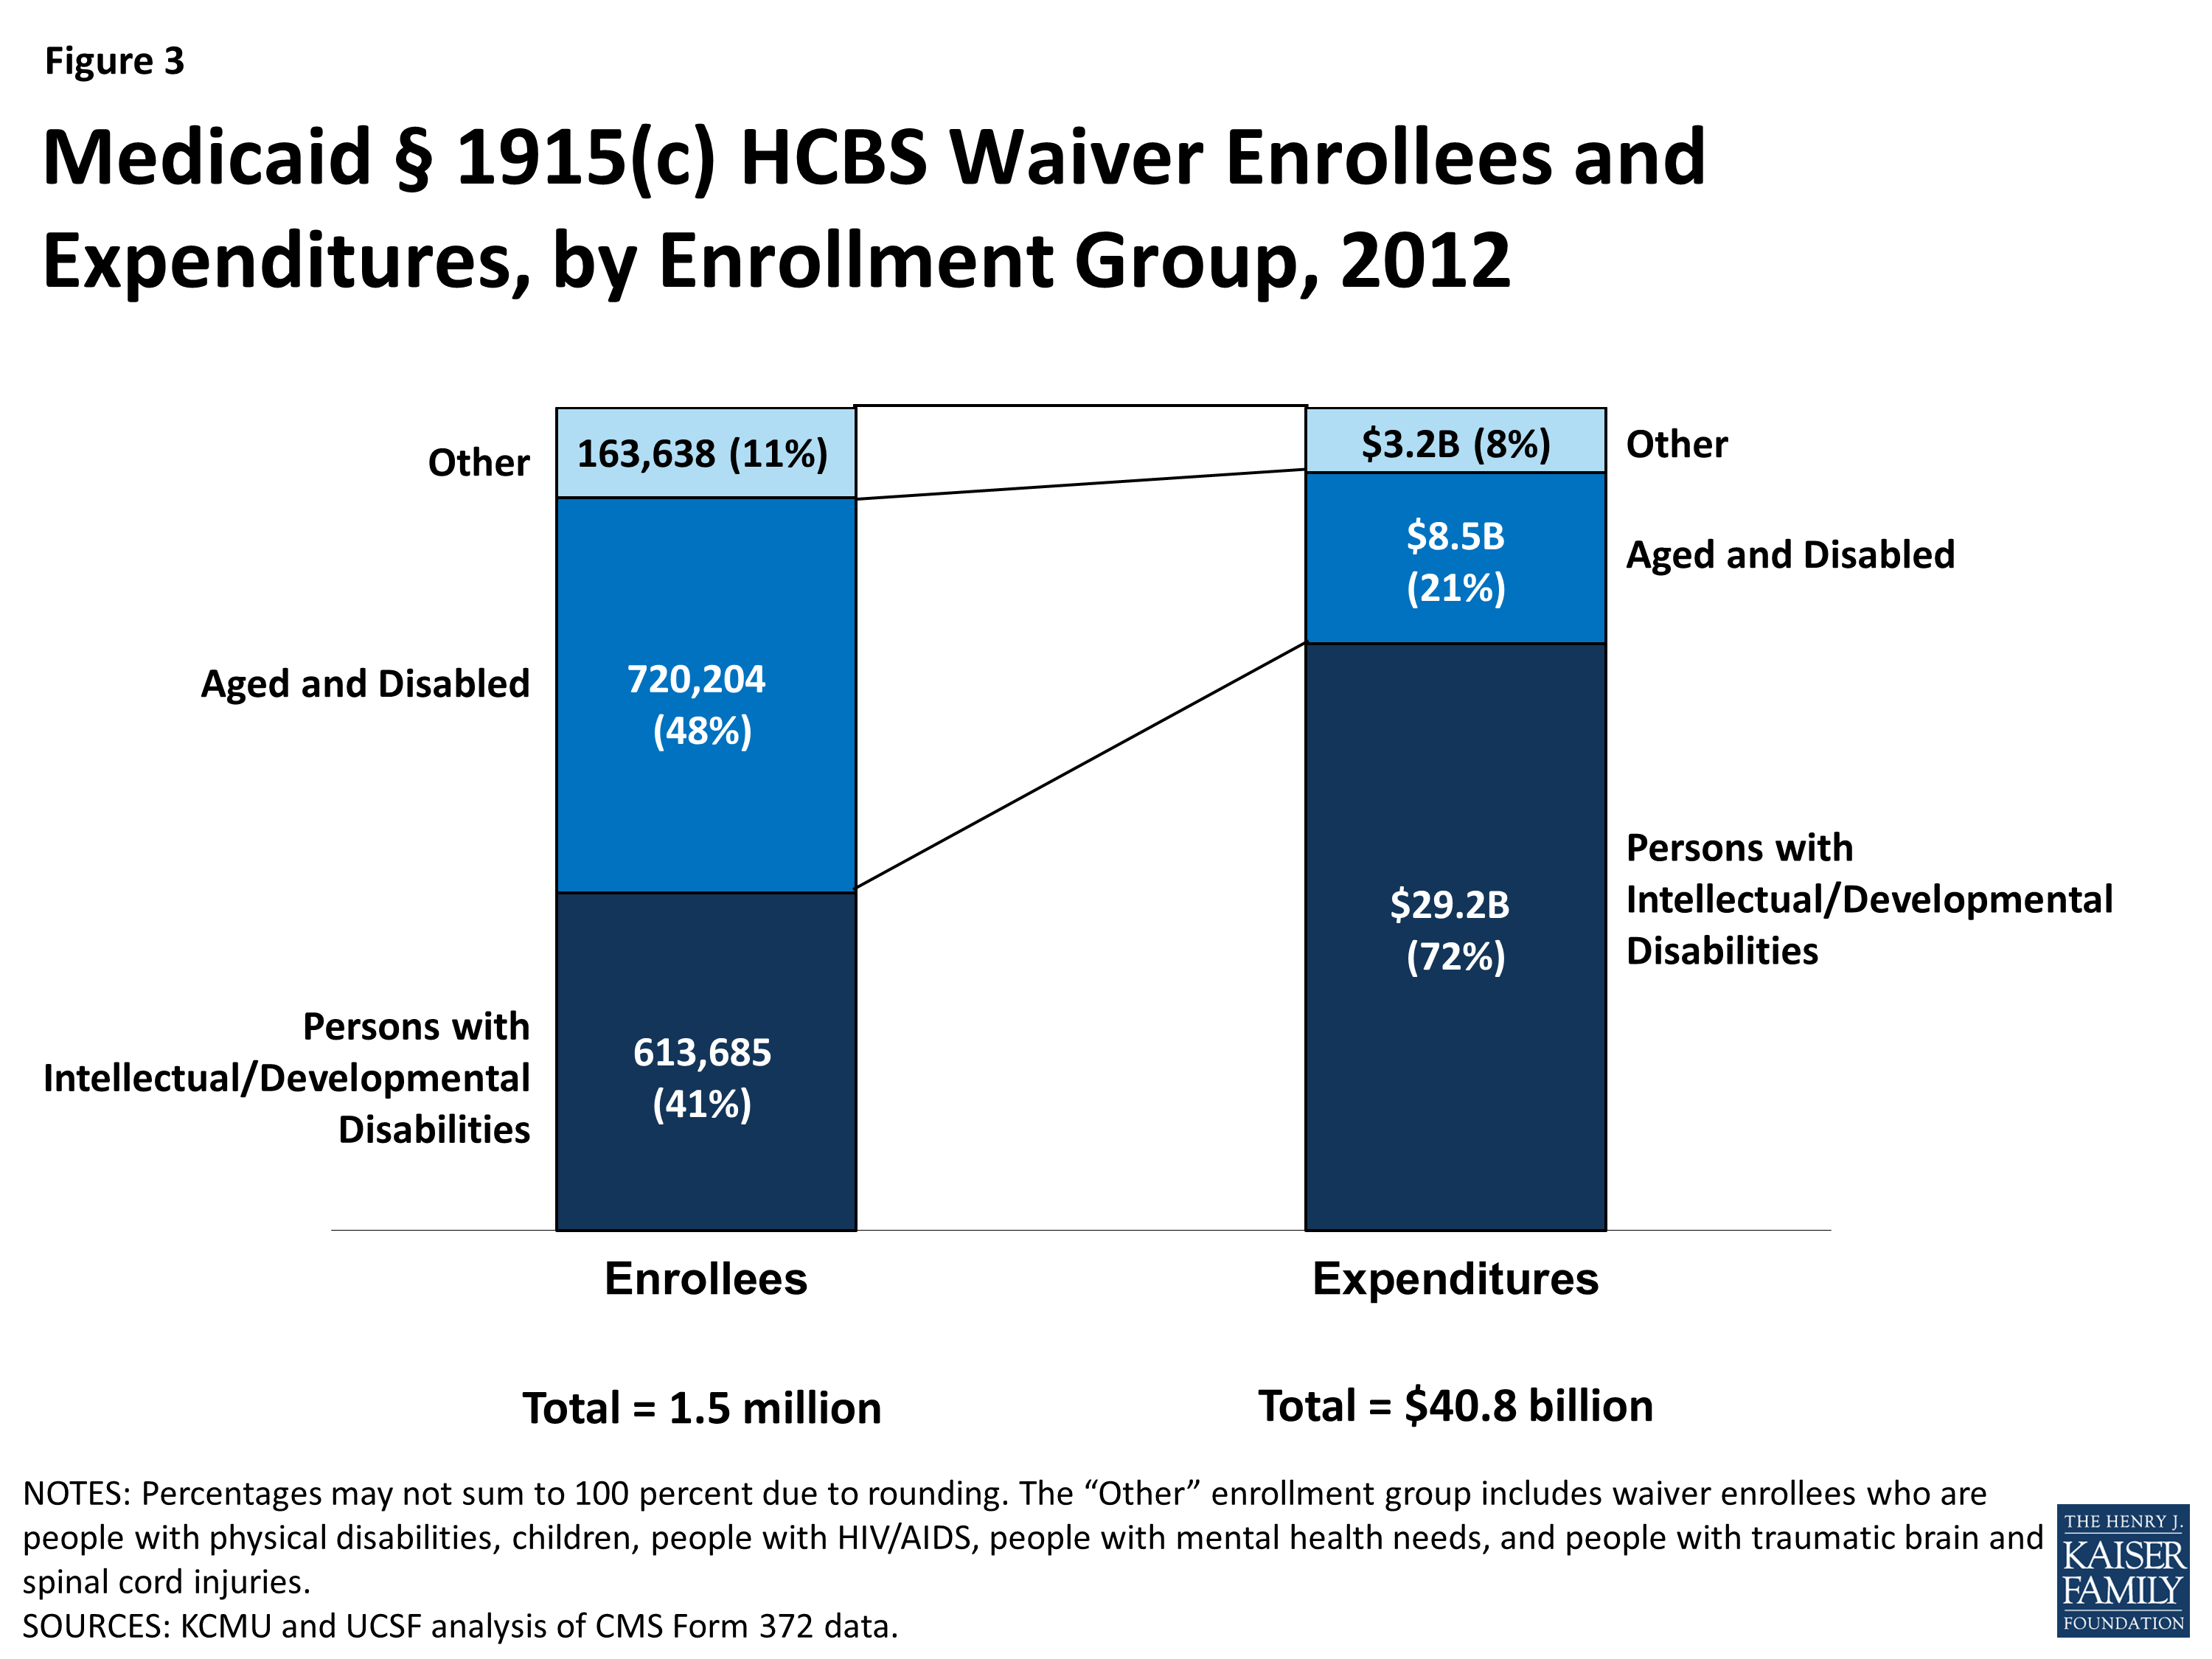
Figure 3: Medicaid § 1915(c) HCBS Waiver Enrollees and Expenditures, by Enrollment Group, 2012
- The aged/disabled population made up the largest share of waiver enrollment (48%) but accounted for 21% of spending on waiver services in 2012. People with I/DD accounted for 41% of HCBS waiver enrollment in 2012, but 72% of spending on waiver services was devoted to this population, again reflecting their more intensive need for LTSS relative to other groups (Figure 3).
- A minority of states use § 1115 demonstration waivers to deliver HCBS. As of 2012, three states (Arizona, Rhode Island, and Vermont) do not operate any § 1915(c) waivers and instead use § 1115 waivers to administer statewide Medicaid managed care programs that include all covered HCBS for all populations and services. Another five states (Delaware, Hawaii, New York, Tennessee, and Texas) use § 1115 waivers for Medicaid managed care programs that include HCBS for at least some geographic areas and/or populations; these states also offer HCBS via § 1915(c) waivers for other geographic areas and/or populations.2
2014 Policies in Medicaid HCBS Programs
- In 2014, all states reported using cost controls in § 1915(c) waivers, such as restrictive financial and functional eligibility standards, enrollment limits, or waiting lists. About 25 percent of § 1915(c) waiver programs used financial eligibility standards that were more restrictive than those used to determine eligibility for Medicaid coverage of institutional care. However, 10 § 1915(c) waivers used more restrictive functional eligibility criteria than those used for institutional care. Almost two-third of states offering personal care state plan services (62%, or 21 states) had some form of cost controls in place, with the majority utilizing service unit limitations. Over half of states (59%, or 30 states) had some form of expenditure or service restriction in place in their home health state plan services programs.
- In 2014, more than 582,000 people were on § 1915(c) waiver waiting lists, and the average waiting time exceeded two years. The growth in the number of people on waiting lists continued to increase, although by a smaller percent than the average annual growth rate (8.5% in 2013 compared to 11% average growth over the preceding decade). The average national waiting time for § 1915(c) waiver services was 29 months, with wide variations among waivers for different target populations and across states. The average length of time a person spent on a waiting list ranged from three months for HIV/AIDS waivers to 47 months for I/DD waivers.
- The use of beneficiary self-direction as an alternative service delivery model was present in each of the three major Medicaid HCBS programs. The self-direction model includes initiatives such as beneficiary choice in the allocation of Medicaid service budgets and/or the selection and dismissal of service providers. Forty-two states (or 90%) with § 1915(c) waivers permitted or required self-direction in at least one of their waivers in 2014. Of the states offering personal care state plan services, 24 (or 71%) permitted self-direction. In contrast, only nine states (or 18%) allowed self-direction of home health state plan services in 2014.
- For both home health and personal care agencies, provider reimbursement rates increased slightly from 2013 to 2014. The national average reimbursement rate per visit for home health agencies was $92.69 and $91.45 in 2014 and 2013, respectively. The hourly reimbursement rate for agencies providing personal care state plan services increased slightly ($18.73 in 2014, and $18.20 in 2013).
Over the past three decades, the increase in access to community-based alternatives to institutional care has resulted in some rebalancing of national Medicaid LTSS dollars, but the size and scope of Medicaid HCBS programs vary across states. Section 1915(c) waivers account for the majority (74%) of spending on LTSS provided in community settings. In the coming years, states will be challenged to continue to expand access to high quality, person-centered HCBS in a cost-effective manner, and it will remain important to monitor states’ adoption of state plan options and other initiatives to expand Medicaid HCBS, differences in services and spending, and the impact of cost control policies on access and quality.
Topics
