How is the ACA Impacting Medicaid Enrollment?
New data released by the Centers for Medicare and Medicaid Services (CMS) shows that as of the end of March 2014, Medicaid and CHIP enrollment had increased by over 4.8 million people since open enrollment began for the new Health Insurance Marketplaces in October 2013. These data help provide a better understanding of how the Affordable Care Act (ACA) is impacting Medicaid enrollment, which has been a keen focus and subject of debate among the press, policymakers, and analysts. However, understanding the ACA’s impact on Medicaid enrollment remains complex given that the ACA promotes increased Medicaid enrollment in varied ways, including changes in eligibility, modernization and simplification of enrollment processes, and increased outreach and enrollment efforts. To interpret the data, it is important to understand what they represent, what they show about the impact of the ACA on Medicaid enrollment, and what questions still remain. This brief discusses the data and its interpretation to assess the influence of the ACA on Medicaid enrollment and finds:
- As of March 2014, Medicaid and CHIP enrollment grew by more than 4.8 million people compared to average monthly enrollment in the three months leading up to the start of open enrollment.
- Enrollment growth in states that have expanded Medicaid coverage to low-income adults outpaced the national average, and was significantly higher than growth in non-expanding states (12.9% vs. 2.6%).
- The recent data show very strong enrollment growth relative to historic trends, with the recent growth exceeding reported growth at the height of the most recent economic downturn.
- Overall, the data suggest that the ACA is having a positive impact on Medicaid and CHIP enrollment, particularly in states that have implemented the Medicaid expansion. However, it remains challenging to quantify and separately identify the impacts of the specific ACA policies on enrollment.
- Although enrollment gains are an important indicator of progress, ultimately the key measure of the ACA’s success in achieving its coverage goals will be a reduction in the number of uninsured.
Three main ACA changes lead to Medicaid enrollment gains.
Even though most observers remain focused on the ACA’s Medicaid expansion, the ACA strengthens and improves Medicaid in other key ways that will increase Medicaid enrollment. Overall, there are three main changes the ACA makes to eligibility and enrollment that are expected to contribute to Medicaid enrollment gains (Figure 1):
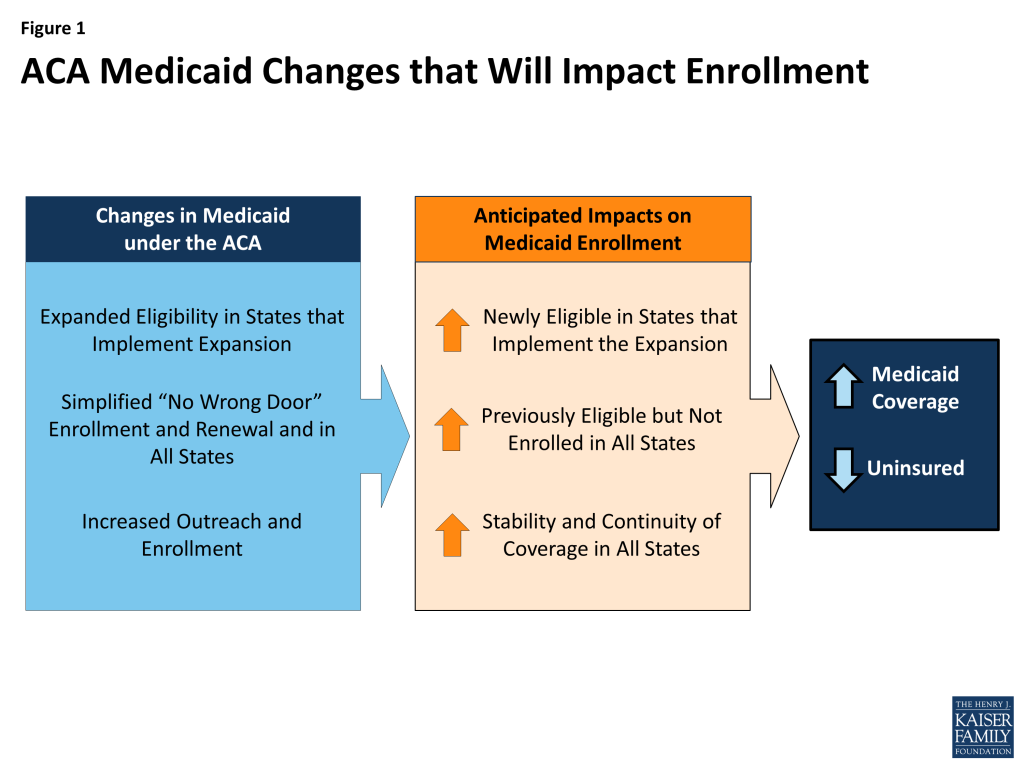
- Medicaid expansion to low-income adults. The ACA expands Medicaid eligibility to adults with incomes at or below 138 percent of the poverty line, which is just over $16,000 per year for an individual today. Historically, Medicaid covered low-income children, pregnant women, elderly and disabled individuals, and some parents, but excluded other low-income adults. The expansion, which the Supreme Court effectively made optional for states in 2012, fills this longstanding gap in the program. To date, 27 states, including DC, are implementing the expansion and additional states may expand moving forward.1
- Modernized, simpler enrollment processes. The ACA makes it easier for people to enroll in and renew Medicaid coverage. Prior to the ACA, states had achieved varied progress in modernizing and simplifying their Medicaid enrollment processes. Under the ACA, all states must offer individuals multiple options to apply (for example, online or by mail or phone), seek to rely on electronic data instead of paper to verify information, and, in as many cases as possible, provide “real time” determinations of eligibility for coverage (Figure 2). These processes are designed to coordinate with the new Marketplaces to create a “no wrong door” enrollment system, so that regardless of whether an individual applies directly to Medicaid or through a Marketplace, he or she is enrolled in the program for which he or she is eligible. All states must implement these changes, regardless of whether a state expands Medicaid.
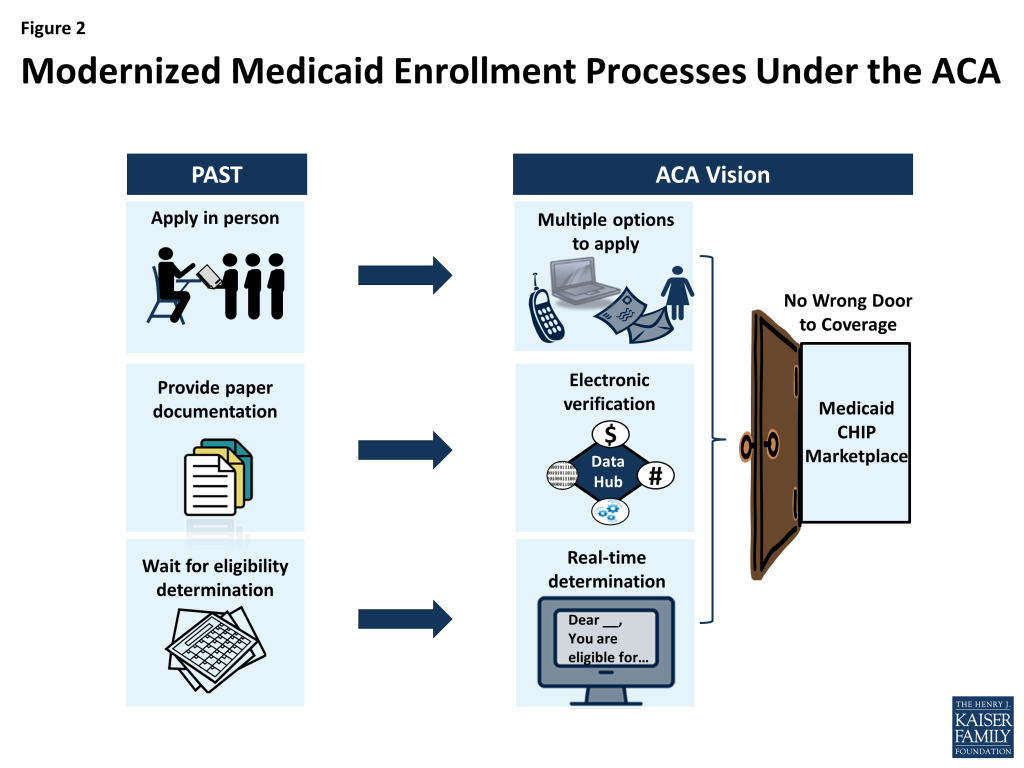
Figure 2: Modernized Medicaid Enrollment Processes Under the ACA - Increased outreach and enrollment efforts. The ACA spurred outreach and enrollment efforts to help connect eligible people to coverage. Leading up to and throughout the open enrollment period for the Marketplaces, there was significant outreach to encourage individuals to apply for coverage and an array of assistance was available to help individuals enroll. Moreover, because Medicaid enrollment is not limited to the Marketplace open enrollment period, Medicaid outreach and enrollment efforts continue year-round.
Together, these three key changes are expected to lead to increased Medicaid coverage and a reduction in the number of uninsured. In states that expand Medicaid, there will be enrollment gains among adults made newly eligible by the expansion. But, in all states, the simpler enrollment processes and broad outreach and enrollment efforts will promote increased enrollment among individuals who were already eligible for Medicaid before the ACA, but not enrolled, many of whom are children. Prior to the ACA, these individuals may not have known that coverage was available, did not think they would be eligible, or may have encountered difficulties enrolling.
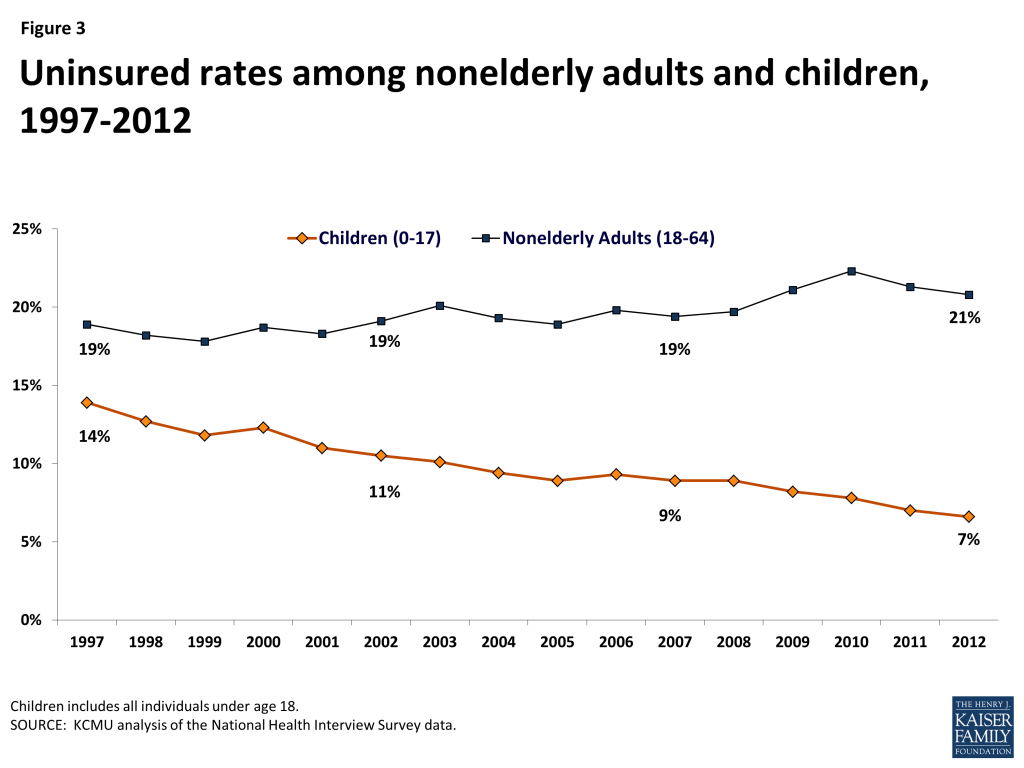
Previous experience with CHIP shows that the combined effects of increased eligibility, simplified enrollment, and enhanced outreach and enrollment efforts lead to decreases in the uninsured rate for children. CHIP was created in 1997 as a complement to Medicaid. It expanded eligibility to uninsured children who were not eligible for Medicaid, led states to simplify enrollment and renewal processes for children, and spurred broad outreach and enrollment efforts. Together, the combined effects of these changes not only increased enrollment of children in both Medicaid and CHIP, but resulted in a steady decline in the uninsured rate for children. Between 1997 and 2012 the uninsured rate for children was cut in half from 14% to a record low of 7%, even as uninsured rates for adults climbed during the recent economic downturn (Figure 3).
What do CMS Medicaid enrollment data show?
CMS recently began publishing monthly reports as part of an initiative to provide data on a broad set of Medicaid and CHIP eligibility and enrollment performance indicators to inform program management and oversight.2 This type of timely data had never before been reported and is providing some of the fastest insights on national Medicaid enrollment in the program’s history. The initial monthly reports provided data on the number of applications submitted and eligibility determinations made for Medicaid and CHIP. The press and assorted experts focused on trying to tease out what share of these determinations were attributable to the ACA and, in particular, the Medicaid expansion. However, it was difficult to disentangle the impacts of the ACA given the limitations of the data. Beginning in its April 2014 report, CMS also began reporting data on total Medicaid and CHIP enrollment. The addition of this data represents progress toward the agency’s goal of reporting a broader set of performance indicators and allows for greater insight into the ACA’s impact on enrollment. To date, CMS has reported point-in-time total Medicaid enrollment as of February 2014 and March 2014, as well as average monthly enrollment data for a comparison period prior to open enrollment (July through September 2013). However, the data are new and remain subject to gaps, inconsistencies and limitations.
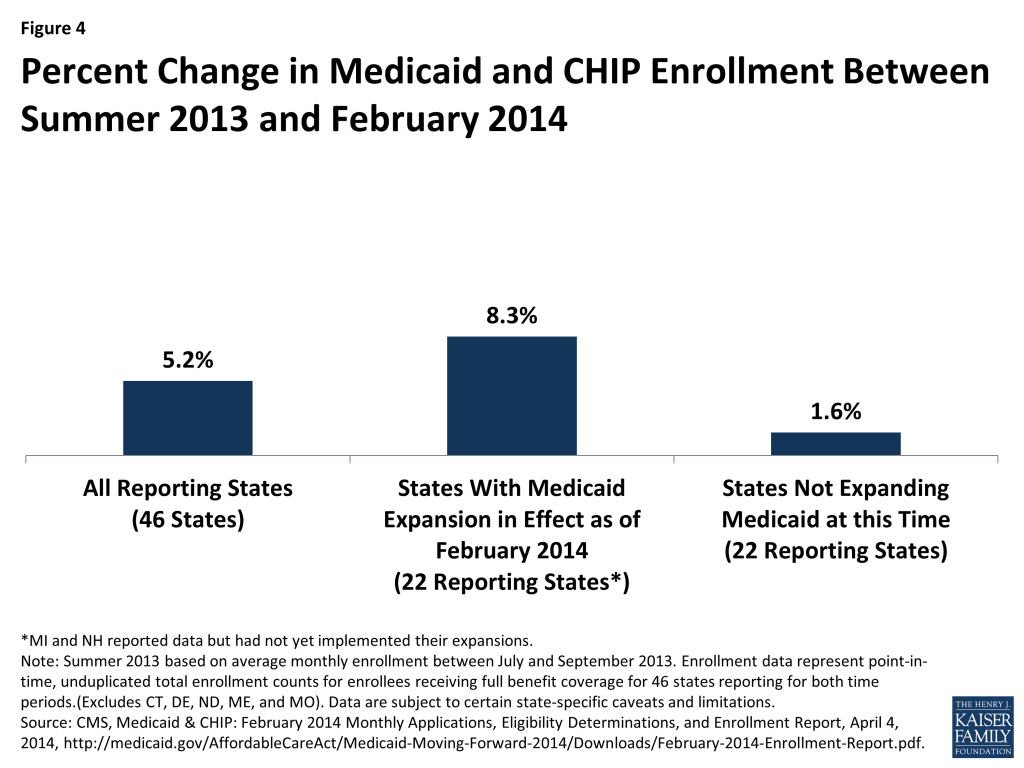
The CMS data show that between the comparison period prior to open enrollment (July to September 2013) and March 2014, total Medicaid and CHIP enrollment grew by over 4.8 million people (from 58.9 to 63.7 million) among the 47 states reporting data for both periods. Nearly all of this growth occurred among the reporting states implementing the Medicaid expansion. In the states expanding Medicaid that reported data for both periods, enrollment grew by 4.2 million (from 34.1 to 38.3 million). In states that are not expanding Medicaid and that reported data for both periods enrollment grew by just over 643,000 people (from 24.7 to 25.4 million).3 This growth reflects a combination of increased enrollment among newly eligible adults in states that have implemented the Medicaid expansion and increased enrollment among previously eligible individuals in all states due to changes in enrollment processes and stronger outreach and enrollment efforts. In the non-expansion states, it is likely that most enrollment gains have been among children, given that children make up most of the eligible but not enrolled uninsured population due to the higher income eligibility levels for children and limited eligibility for adults in these states. The 4.8 million enrollment increase does not reflect the 950,000 individuals enrolled under early expansions in seven states, since most individuals enrolled in these expansions were already enrolled in Medicaid by the July-September 2013 comparison period before the ACA.4
There are wide disparities in enrollment growth between states that have already expanded Medicaid and those that have not expanded. Across the 47 states that reported data for both the period prior to open enrollment and March 2014, enrollment grew by an average of 8.2% between summer 2013 and March 2014 (Figure 4). The 22 states that had their Medicaid expansions in effect as of March 2014 and reported data for both periods experienced significantly greater enrollment growth compared to reporting states that are not expanding at this time (12.9% vs. 2.6%). Overall, 16 of the 22 reporting states that had already expanded Medicaid reported enrollment growth that exceeded 10%, including 5 that experienced growth exceeding 30%. Among expansion states, the variation in enrollment changes in part reflects differences in the size of the coverage expansion that is occurring in 2014. For example, states that previously covered many adults may see a smaller increase. Nearly all (22 of 23) states that are not expanding Medicaid and reported data for both periods had enrollment growth of less than 10%, with 7 reporting negative enrollment growth or net declines in enrollment over the period (Appendix Table 1).5
It is expected that Medicaid and CHIP enrollment will continue to grow. As noted, not all states reported enrollment data for the period and the data that were reported are preliminary and expected to increase as states finalize their data and incorporate retroactive enrollments into their enrollment counts. These enrollment adjustments will likely include some individuals determined eligible for Medicaid or CHIP by the Federally Facilitated Marketplace (FFM) who may not have had their enrollment completed due to delays in the transfers of accounts between the FFM and Medicaid and CHIP agencies. Moreover, because Medicaid and CHIP enrollment is not limited to the open enrollment period for the Marketplaces, new enrollments will continue year-round.
What have we learned from the new enrollment data?
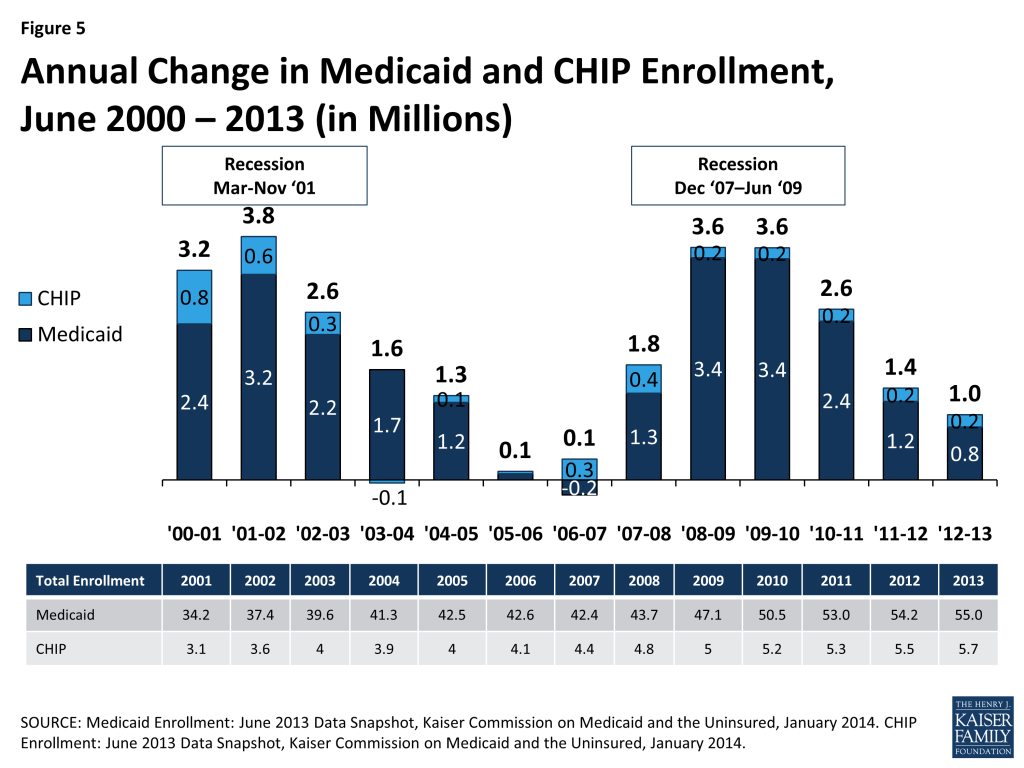
The recent enrollment data from CMS show strong growth relative to previous enrollment trends. Earlier Medicaid and CHIP enrollment data collected and analyzed by the Kaiser Commission on Medicaid and the Uninsured for multiple years show that enrollment growth was slowing prior to the beginning of open enrollment as economic conditions continued to improve, at 1.4 million between June 2011 and 2012 and 1.0 million between June 2012 and 2013 (Figure 5).6 The CMS-reported enrollment gain of 4.8 million between summer 2013 and March 2014 is greater than enrollment trends at the height of the most recent economic downturn, which peaked at 3.6 million between June 2008 to 2009 and June 2009 to 2010. Although these earlier data are not directly comparable to the new CMS data because not all states reported to CMS and there are differences in data adjustments, they both similarly report monthly point-in-time enrollment. Comparing the recent enrollment change reported by CMS to earlier trends suggests that the ACA policy changes are having a positive impact on enrollment. However, it is important to recognize that additional factors may also be influencing enrollment, including seasonal fluctuations, changing economic conditions, and overall population growth.
Even with the new enrollment data, it remains challenging to quantify and separately identify the impacts of the specific ACA policies on enrollment. Although, in principle, it should be relatively easy to calculate the number of adults enrolled in the Medicaid expansion in the states that have expanded, the reality has proven challenging. Many state systems are not yet able to track enrollment in this group separately and report in real-time. Only a few states (such as Washington) have reported data on the number of people enrolling in the expansion group, and it is not possible to extrapolate from a few states to estimate the entire expansion population accurately. In addition, the CMS enrollment data are for overall enrollment and do not separately identify expansion enrollees. In the future, data on expansion enrollees will become available when states begin requesting payments for the higher federal matching rate provided for adults made newly eligible by the Medicaid expansion. It also is difficult to identify how many people are enrolling in Medicaid as a result of the new, simpler processes or as a result of the ACA’s broad outreach and enrollment efforts. Unlike the Marketplaces, Medicaid was an existing program with ongoing enrollment at the time the ACA was implemented, so separating usual enrollment changes from ACA-driven changes is complex. In contrast, the Marketplaces are entirely new entities created by the ACA, so any enrollee in the Marketplace is, by definition, new and growth in enrollment over time can be more easily measured and compared across states.
Looking Ahead
The new enrollment data reported by CMS suggest that the ACA is having a strong positive impact on Medicaid enrollment, particularly in states that have implemented the Medicaid expansion. However, ultimately the key measure of the ACA’s success will changes in the number of uninsured. Early survey findings show promising reductions in the uninsured rate to date. However, fully assessing the impact of the ACA will require monitoring changes in coverage over longer periods of time to determine changing patterns in health insurance coverage and access to care and the extent to which individuals are able to maintain continuous coverage. While waiting for these measures is challenging, they ultimately will provide the most meaningful measures of the ACA’s progress in achieving its broader coverage goals. In the meantime, the data released by CMS is expected to continue to improve and expand over time, allowing for greater analysis, and surveys like the Kaiser Survey of Low-income Americans will provide insight into low-income consumers’ experiences to provide greater understanding about the impact of the ACA on the low-income uninsured.7
| Appendix Table 1: Total Medicaid and CHIP Enrollment, February and March 2014 | |||||
| State | Medicaid Expansion Status | Monthly AverageJuly-Sept 2013 | February 2014 | March 2014 | Percent ChangeJuly-Sept 2013 to March 2014 |
| Arizona | Expanded | 1,201,770 | 1,234,401 | 1,301,010 | 8.3% |
| Arkansas | Expanded | 680,920 | 763,356 | 805,785 | 18.3% |
| California | Expanded | 9,157,000 | 9,999,000 | 10,334,000 | 12.9% |
| Colorado | Expanded | 783,420 | 962,210 | 1,012,944 | 29.3% |
| Connecticut | Expanded | – | – | 704,387 | |
| Delaware | Expanded | – | 230,165 | 233,786 | – |
| District of Columbia | Expanded | 235,786 | 238,000 | 241,243 | 2.3% |
| Hawaii | Expanded | 288,358 | 313,669 | 320,567 | 11.2% |
| Illinois | Expanded | 2,753,227 | 2,735,224 | 2,791,737 | 1.4% |
| Iowa | Expanded | 493,515 | 557,501 | 572,375 | 16.0% |
| Kentucky | Expanded | 840,926 | 966,365 | 1,125,964 | 33.9% |
| Maryland | Expanded | 856,297 | 1,053,589 | 1,092,409 | 27.6% |
| Massachusetts | Expanded | 1,296,359 | 1,453,213 | 1,455,069 | 12.2% |
| Michigan | Expansion effective 4/1/14 | 1,912,009 | 1,845,112 | 1,942,437 | 1.6% |
| Minnesota | Expanded | 873,040 | 976,350 | 972,683 | 11.4% |
| Nevada | Expanded | 332,559 | 404,825 | 437,218 | 31.5% |
| New Hampshire | Expansion effective 7/1/14 | 127,082 | 133,110 | 134,699 | 6.0% |
| New Jersey | Expanded | 1,283,851 | 1,361,513 | 1,382,091 | 7.7% |
| New Mexico | Expanded | 572,111 | 602,014 | 632,489 | 10.6% |
| New York | Expanded | 5,678,418 | 5,823,995 | 6,022,253 | 6.1% |
| North Dakota | Expanded | – | – | – | |
| Ohio | Expanded | 2,341,482 | 2,361,103 | 2,549,762 | 8.9% |
| Oregon | Expanded | 626,357 | 900,933 | 900,038 | 43.7% |
| Rhode Island | Expanded | 190,833 | 227,095 | 244,162 | 27.9% |
| Vermont | Expanded | 127,162 | 168,233 | 173,609 | 36.5% |
| Washington | Expanded | 1,117,576 | 1,369,179 | 1,369,825 | 22.6% |
| West Virginia | Expanded | 354,544 | 473,401 | 490,962 | 38.5% |
| Percent Change in States with Expansion in Effect as of March 2014* | 12.9% | ||||
| Alaska | Not Currently Expanding | 799,176 | 116,720 | 119,767 | -1.0% |
| Alabama | Not Currently Expanding | 120,946 | 769,295 | 774,293 | -3.1% |
| Florida | Not Currently Expanding | 3,086,445 | 3,233,195 | 3,309,501 | 7.2% |
| Georgia | Not Currently Expanding | 1,702,650 | 1,773,327 | 1,801,484 | 5.8% |
| Idaho | Not Currently Expanding | 251,926 | 270,594 | 270,943 | 7.5% |
| Indiana | Not Currently Expanding | 1,120,674 | 1,120,847 | 1,165,718 | 4.0% |
| Kansas | Not Currently Expanding | 397,989 | 415,284 | 420,487 | 5.7% |
| Louisiana | Not Currently Expanding | 1,019,787 | 1,008,176 | 1,011,883 | -0.8% |
| Maine | Not Currently Expanding | – | – | – | |
| Missouri | Not Currently Expanding | 714,055 | 828,478 | 829,585 | -3.9% |
| Mississippi | Not Currently Expanding | 863,417 | 720,292 | 731,876 | 2.5% |
| Montana | Not Currently Expanding | 139,604 | 149,245 | 153,736 | 10.1% |
| North Carolina | Not Currently Expanding | 244,600 | 1,786,369 | 1,802,167 | 3.3% |
| Nebraska | Not Currently Expanding | 1,744,160 | 238,121 | 235,054 | -3.9% |
| Oklahoma | Not Currently Expanding | 790,051 | 814,881 | 828,329 | 4.8% |
| Pennsylvania | Not Currently Expanding | 2,386,046 | 2,398,718 | 2,427,034 | 1.7% |
| South Carolina | Not Currently Expanding | 988,349 | 1,017,333 | 1,041,993 | 5.4% |
| South Dakota | Not Currently Expanding | 115,501 | 115,013 | 115,711 | 0.2% |
| Tennessee | Not Currently Expanding | 1,244,516 | 1,279,336 | 1,298,181 | 4.3% |
| Texas | Not Currently Expanding | 4,441,605 | 4,425,316 | 4,444,819 | 0.1% |
| Utah | Not Currently Expanding | 322,442 | 330,306 | 332,826 | 3.2% |
| Virginia | Not Currently Expanding | 1,003,266 | 1,058,839 | 1,039,822 | 3.6% |
| Wisconsin | Not Currently Expanding | 1,161,876 | 1,162,614 | 1,151,225 | -0.9% |
| Wyoming | Not Currently Expanding | 71,962 | 72,378 | 119,767 | -5.6% |
| Percent Change in States Not Expanding* | 2.6% | ||||
| Percent Change in All States* | 8.2% | ||||
| * Percent change based on states reporting for both the July-September 2013 and March 2014 periods.Sources: CMS March 2014 and Updated February 2014 Medicaid and CHIP Application and Eligibility Report. See CMS reports for data definitions and state-specific data notes and caveats. | |||||
This insight was prepared by Vikki Wachino from NORC at the University of Chicago and Samantha Artiga and Robin Rudowitz from the Kaiser Family Foundation.
- State Health Facts, “Status of State Action on the Medicaid Expansion Decision, 2014,” Kaiser Family Foundation, http ://kff.org/medicaid/state-indicator/state-activity-around-expanding-medicaid-under-the-affordable-care-act/. ↩︎
- See Monthly Medicaid and CHIP reports, Medicaid Moving Forward 2014, Eligibility Data http://medicaid.gov/AffordableCareAct/Medicaid-Moving-Forward-2014/medicaid-moving-forward-2014.html#. ↩︎
- Centers for Medicare and Medicaid Services, “Medicaid & CHIP: March 2014 Monthly Applications, Eligibility Determinations, and Enrollment Report,” May 1, 2014, http://medicaid.gov/AffordableCareAct/Medicaid-Moving-Forward-2014/medicaid-moving-forward-2014.html#. ↩︎
- Seven states (CA, CO, CT, DC, MN, NJ, WA) implemented an “early option” to expand Medicaid coverage to adults between April 1, 2010 and January 1, 2014, using new state plan authority provided by the ACA or a Section 1115 demonstration waiver. Some of these states previously covered some adults enrolled in these early expansions through state- or locally-funded coverage programs. Overall, nearly 950,000 people are covered under these early expansions. Because most of these individuals were already enrolled in Medicaid by the July-September 2013 comparison period before the ACA, most of these beneficiaries are not counted as part of the 4.8 million enrollment gain. ↩︎
- Ibid. ↩︎
- Snyder, L., et al., “Medicaid Enrollment: June 2013 Data Snapshot,” Kaiser Family Foundation, January 29, 2014, https://modern.kff.org/report-section/medicaid-enrollment-june-2013-data-snapshot-total-enrollment/ and Smith, V., et al, “CHIP Enrollment: June 2013 Data Snapshot,” Kaiser Family Foundation, January 29, 2014, https://modern.kff.org/medicaid/issue-brief/chip-enrollment-june-2013-data-snapshot/. ↩︎
- Garfield, R., Licata, R., and K. Young, “The Uninsured at the Starting Line: Findings from the 2013 Kaiser Survey of Low-Income Americans,” February 6, 2014, https://modern.kff.org/uninsured/report/the-uninsured-at-the-starting-line-findings-from-the-2013-kaiser-survey-of-low-income-americans-and-the-aca/. ↩︎