Health Care Spending Among Low-Income Households with and without Medicaid
Issue Brief
Medicaid provides coverage for over 70 million low-income families and adults.1 The Affordable Care Act (ACA) sought to extend Medicaid’s reach by expanding eligibility to nonelderly adults with incomes at or below 138% of the federal poverty level (FPL) ($27,310 for a family of three in 2014).2 While the Medicaid expansion was intended to be national, the 2012 Supreme Court decision effectively made it optional for states, and as of January 2016, 19 states have not adopted the expansion.3
For low-income families and individuals not eligible for Medicaid, affordable health coverage options may be limited. Some low-income workers may be offered coverage by their employers, and those in states that have not expanded Medicaid who do not have coverage through their jobs may be eligible for premium subsidies in the Marketplaces if their income is above the poverty level. These private insurance options, however, often require consumers to pay premiums and may also require cost sharing in the form of deductibles, copayments, and co-insurance when they access care.
To gain a better understanding of the impact of insurance on the health care spending and budgets of low-income households, we use data from the 2014 Consumer Expenditure Survey to compare health care spending among low-income households (those with income below 138% FPL or $27,310 for a family of three in 2014) covered by Medicaid to those households not covered by Medicaid. Spending on health care as a share of total household spending, and the distribution of health spending on premiums and out-of-pocket costs for medical services, supplies and prescription drugs are assessed.
health care spending among Low-Income Households
Low-income households allocate limited resources to competing necessities. The majority of spending among low-income households is devoted to housing, food, and transportation (Figure 1). In addition, average spending among low-income households greatly exceeds average income,4 suggesting that they accrue debt, even as they earn. As a result, spending even small amounts on health care can crowd out other necessities or require low-income families to go further into debt.
Low-income households with Medicaid spend a smaller portion of their annual budget on health care compared to non-Medicaid households. Despite having smaller household budgets overall, low-income households in which all members are covered by Medicaid devote a much smaller portion of their annual budget to health care expenses compared to households in which no members are covered by Medicaid—(1% vs. 6%, respectively). On average, health spending by Medicaid households was about one-fifth that of non-Medicaid households ($235 vs. $1,739) (Figure 1). The absence of premiums and only nominal copayments for services in Medicaid likely explain the differences in spending. In addition, low-income non-Medicaid households spent a smaller share of their budget on food (19% vs. 24%) and housing (37% vs. 44%) than did Medicaid households, suggesting that health care spending may be crowding out what non-Medicaid households are able to allocate to other necessities.

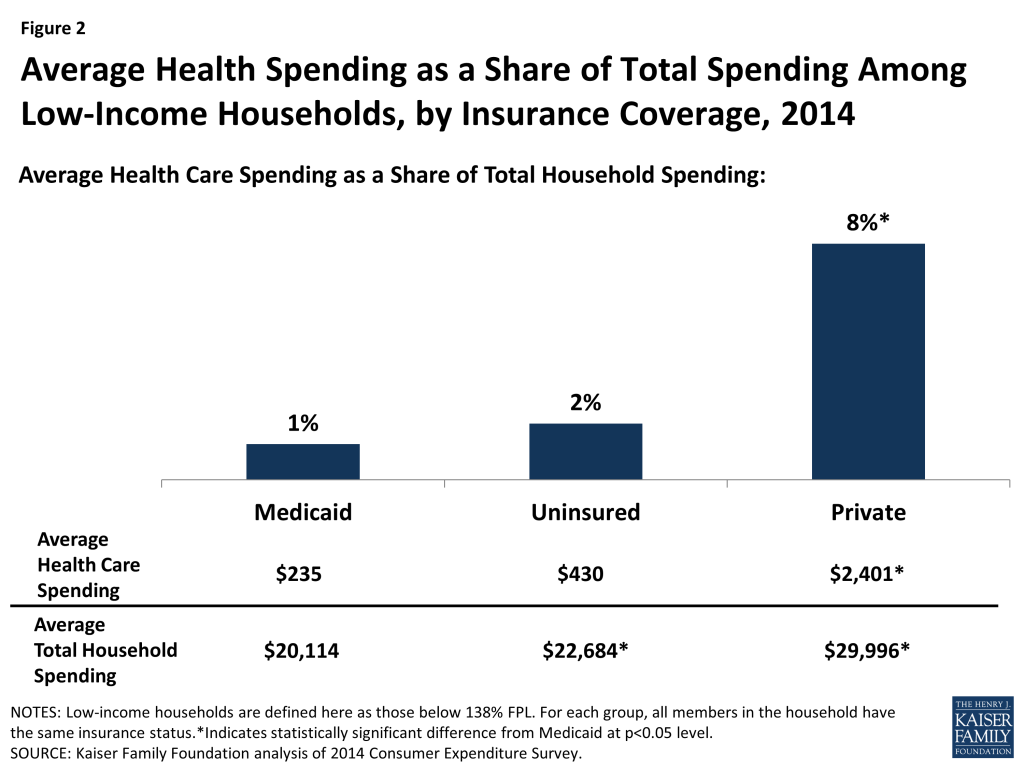
The differences in health spending are starker when comparing low-income Medicaid households to those with private insurance. Compared to low-income households with Medicaid, those in which every family member is covered by private insurance spend ten times more on health care ($2,401 vs. $235) and devote a greater share of their household budgets to health care spending (8% vs. 1%). Low-income households in which every family member is uninsured also spend less on health care compared with households in which all members are covered by private insurance (Figure 2). However, other research indicates that uninsured individuals are less likely than those covered by private insurance or Medicaid to use health care services, and more likely to postpone or go without care due to cost.5
Low-income households are particularly vulnerable to the rising cost of health insurance premiums and the increasing use of deductibles and other cost-sharing requirements in private health plans that shift a greater share of health costs to consumers.6 Focusing on premiums specifically, low-income households with private insurance spend an average of $1,729 on premiums or nearly 6% of their total household budgets. In comparison, Medicaid households spend an average of $88 on premiums or 0.4% of their total household budgets (data not shown). Although it is somewhat surprising that Medicaid households report any spending on premiums, these premiums may be for limited dental or vision coverage or for a family member who may have private coverage in addition to Medicaid.
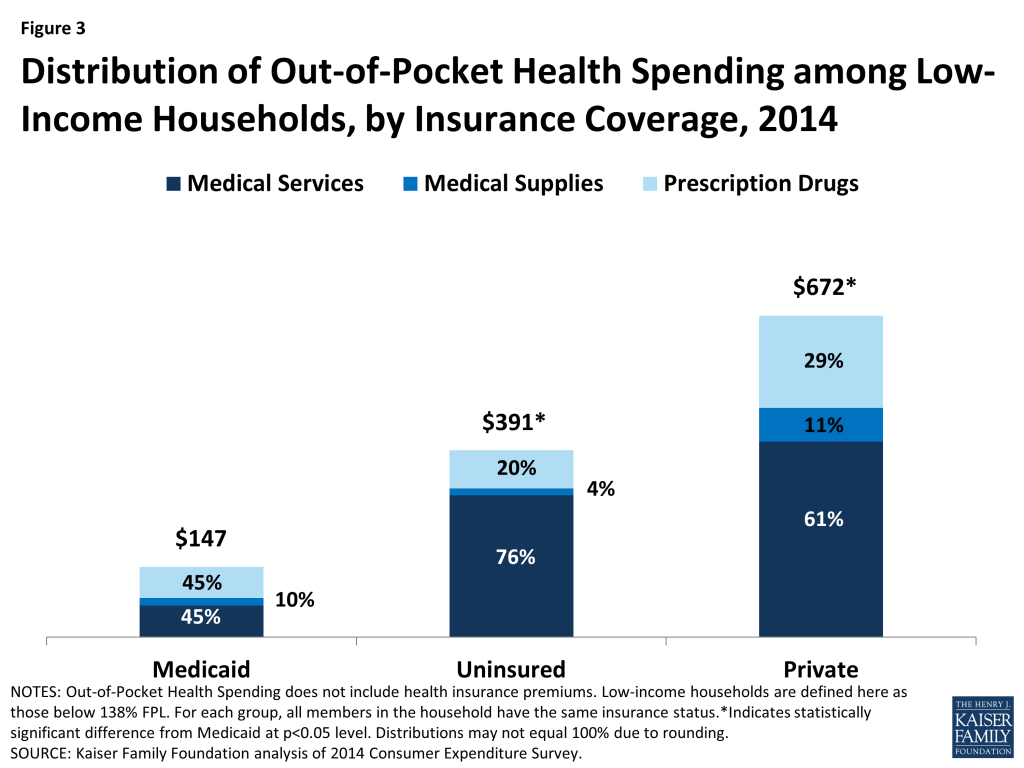
Out-of-pocket (OOP) health care spending among low-income Medicaid households is a fraction of what it is among their uninsured and privately insured counterparts. Low-income households in which all members are covered by Medicaid spend less than half on OOP expenses as those households in which all members are uninsured ($147 vs. $391), and less than a quarter as those households in which all members have private coverage ($147 vs. $672) (Figure 3). Again, this difference is likely explained by Medicaid rules that permit only nominal copayments for benefits and services for individuals with incomes less than 150% FPL. A closer examination of OOP spending shows the distribution of spending on medical services and prescription drugs differs for Medicaid households compared to households with private insurance. For Medicaid households, OOP spending is divided equally between medical services and prescription drugs (45%), while households with private insurance spend twice as much on medical services as on prescription drugs (61% vs. 29%) (Figure 3).7 This difference suggests Medicaid beneficiaries may be more likely to face copayments for prescription drugs than for other services,8 or may reflect the higher share of Medicaid enrollees taking prescription drugs, as compared to those with private insurance.9
Conclusion
Low-income households allocate the majority of their budgets to necessities such as food, housing, transportation, and health care and often spend more than they earn. Health care spending varies considerably across low-income households with different health coverage. Those households with private insurance dedicate a substantial share of their modest budgets to premium and out-of-pocket health care costs—nearly one in every ten dollars (8%). Those households in which all members are covered by Medicaid spend about a tenth of what their counterparts with private coverage spend on health care costs, and devote a much smaller share of their total household budget to health-related expenses. As such, for the lowest income families, Medicaid enables beneficiaries to access health care services without placing additional strain on their resources, in comparison to the health spending faced by families with private insurance or among the uninsured.
Methods
Our analysis is based on the 2014 Consumer Expenditure Survey, which is the primary source of data on national consumer spending. We limited the analysis to households with income below 138% of the poverty level or $27,310 for a family of three in 2014. In order to ensure that the Medicaid, Private, and Uninsured groups were mutually exclusive, we limited our analysis to households in which all members had the same insurance status. However, some Medicaid and uninsured households may also have some form of private coverage, such as dental, prescription, or vision insurance, and some households with private coverage may also have Medicaid, but instances of such overlap are few. In addition, we excluded households with one or more family members over age 65 to focus the analysis on populations targeted by the ACA Medicaid expansion. Household spending includes food; housing; transportation; health care; entertainment; personal care products and services; reading; education; tobacco products and smoking supplies; cash contributions; life, endowment, annuities, and other personal insurance; contributions to retirement pensions and Social Security. Health care spending includes health insurance premiums, medical services, medical supplies, and prescription drugs. Estimates were derived by summing household expenditures across components (housing, food, transportation, health care, etc.) and dividing this total amount by the aggregate amount for each component to calculate the share of total spending. The analysis focuses on average rather than median values to show the distribution of household spending across all components, which sums to 100%.
Melissa Majerol and Jennifer Tolbert are with the Kaiser Family Foundation. Anthony Damico is an independent consultant to the Kaiser Family Foundation.
Endnotes
- “Medicaid and CHIP Program Information”, CMS. Accessed December 17, 2015, http://www.medicaid.gov/medicaid-chip-program-information/medicaid-and-chip-program-information.html. ↩︎
- “2014 Poverty Guidelines,” U.S. Department of Health and Human Services, Office of the Assistant Secretary for Planning and Evaluation, http://aspe.hhs.gov/2014-poverty-guidelines. ↩︎
- Kaiser Family Foundation State Health Facts, “Status of State Action on the Medicaid Expansion Decision,” accessed January 13, 2016, https://modern.kff.org/health-reform/state-indicator/state-activity-around-expanding-medicaid-under-the-affordable-care-act/. ↩︎
- 2014 Consumer Expenditure Survey, Bureau of Labor Statistics, September, 2015, Annual Calendar Year Tables Table 1202 “Income before taxes: Annual expenditure means, shares, standard errors, and coefficients of variation,” http://www.bls.gov/cex/#tables_longhttp://www.bls.gov/cex/. ↩︎
- Melissa Majerol, Vann Newkirk, and Rachel Garfield, The Uninsured: A Primer Key Facts about Health Insurance and the Uninsured in the Era of Health Reform (Washington, DC: Kaiser Commission on Medicaid and the Uninsured, November 2015), https://modern.kff.org/uninsured/report/the-uninsured-a-primer-key-facts-about-health-insurance-and-the-uninsured-in-the-era-of-health-reform/. ↩︎
- Gary Claxton, Matthew Rae, Michelle Long, Nirmita Panchal, Anthony Damico, Kevin Kenward, Heidi Whitmore, 2015 Kaiser/HRET Employer Health Benefits Survey (Washington, DC: Kaiser Family Foundation and Health Research & Educational Trust, 2013), https://modern.kff.org/health-costs/report/2015-employer-health-benefits-survey/. ↩︎
- Although the total absolute dollar value of OOP health spending statistically significantly differs between Medicaid beneficiaries and the low-income uninsured, the distribution of such spending between these two groups does not vary to a detectable extent. This may be partially attributed to the high degree of variation of the components of healthcare spending within these two groups. ↩︎
- In 2012, 43 states required copayments for prescription drugs, while only 31 states required copayments for physician services, 28 required copayments for Federally Qualified Health Center services, and 24 required copayments for nurse practitioner services. Kaiser Family Foundation State Health Facts. Data source: KCMU Medicaid Benefits Database, prepared by Health Management Associates for the Kaiser Commission on Medicaid and the Uninsured (KCMU), available at: https://modern.kff.org/data-collection/medicaid-benefits/ ↩︎
- 2014 Kaiser Family Foundation Survey of Low-Income Americans and the ACA. ↩︎