States and Medicaid Provider Taxes or Fees
Medicaid is jointly financed by states and the federal government. Provider taxes are an integral source of Medicaid financing governed by long-standing regulations. All but one state (Alaska) reported a provider tax in FY 2016 (Figure 1). Under current regulations, states may not use provider tax revenues for the state share of Medicaid spending unless the tax meets three requirements: must be broad-based, uniformly imposed, and cannot hold providers harmless from the burden of the tax. Federal regulations create a safe harbor from the hold-harmless test for taxes where collections are 6.0 percent or less of net patient revenues.1 However, federal health reform legislation under consideration in the Senate as of June 2017 would phase down the maximum federally allowable safe harbor limit under the “hold-harmless” rule, beginning in fiscal year (FY) 2021, to 5.0 percent of net patient revenues by FY 2025.
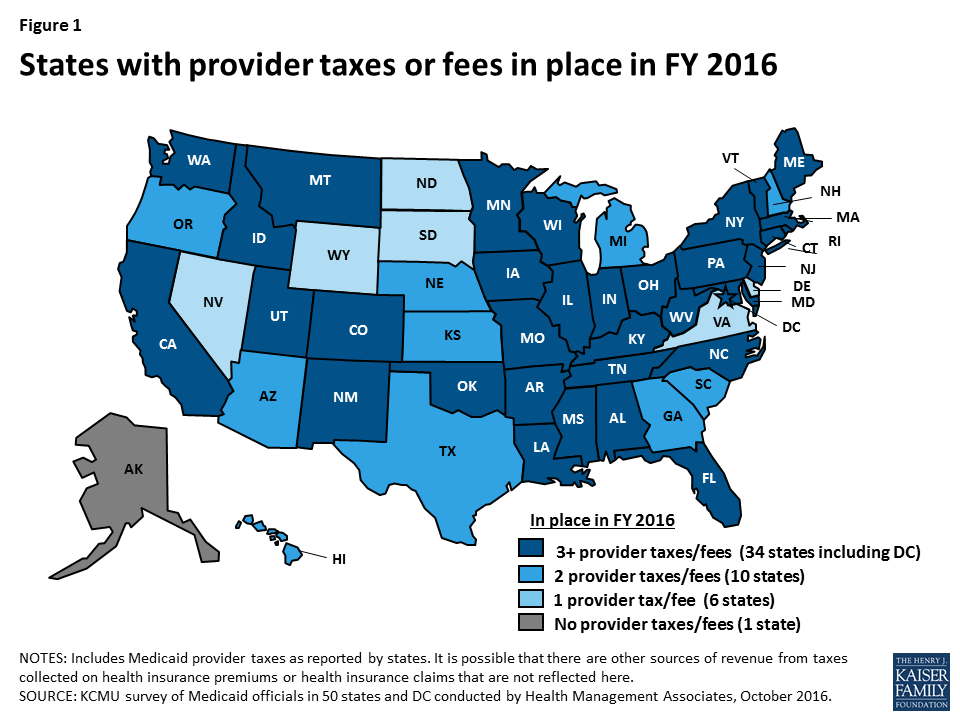
Figure 1: States with provider taxes or fees in place in FY 2016
This would restrict states’ ability to come up with the state share to finance Medicaid and could therefore shift additional costs to states. If states were not able to find additional funds to replace provider tax funding with other state sources, limits on provider taxes could result in program cuts with implications for Medicaid providers and beneficiaries. Since states use provider taxes differently, limits would have different effects across states. This fact sheet briefly highlights the role of provider taxes in states and the possible impact of limiting the use of these taxes. Data is based on findings from the 50-state Medicaid budget survey conducted in July 2016 by the Kaiser Commission on Medicaid and the Uninsured and Health Management Associates.
HOW IS THE MEDICAID PROGRAM FINANCED?
States and the federal government share in the financing of the Medicaid program. Under federal Medicaid law, the federal government pays between 50 and 74 percent of all the costs of providing services to beneficiaries under the program. These matching rates (FMAPs) vary across states based on the state’s per capita income in comparison to the national average (i.e., states with lower per capita income have higher matching rates). The remaining share of program funding comes from state and local sources. One of the ways states raise funds for their share of Medicaid spending is through provider taxes/fees. Eight states, of the 32 states (including DC) that have adopted the ACA Medicaid expansion, also indicated that they planned to use provider taxes/fees to fund the state share of the Medicaid expansion when the federal match dropped from 100% to 95% in January 2017.2
WHAT ROLE DO PROVIDER TAXES PLAY IN STATE FINANCING OF MEDICAID?
Provider taxes are imposed by states on health care services where the burden of the tax falls mostly on providers, such as a tax on inpatient hospital services or nursing facility beds. Provider taxes have become an integral source of financing for Medicaid. For FY 2016, all but one state (Alaska) reported having at least one Medicaid provider tax and two-thirds of states reported three or more provider taxes (Table 1, Figure 1).
States use the additional revenue collected by provider taxes in a number of ways to support Medicaid programs. For example, provider taxes help to support provider rate increases or to help mitigate provider rate cuts. States also have used funds collected from provider taxes to support the Medicaid program more broadly. For example, Colorado used some of the funds raised through their hospital provider fee to expand eligibility to parents and children. During economic downturns, when state tax revenues fall at the same time that demand for public services like Medicaid increases, states are more likely to impose or increase provider taxes to help fund the state share of Medicaid.
In the past, states were able to use provider taxes and other state financing arrangements to enable states to receive higher effective federal matching rates than the statutory formula provides. However, legislation enacted in 1991 restricted the use of provider taxes to curb abusive practices. Under current regulations, states may not use provider tax revenues for the state share of Medicaid spending unless the tax meets three requirements: must be broad-based, uniformly imposed, and cannot hold providers harmless from the burden of the tax. Federal regulations create a safe harbor from the hold-harmless test for taxes where collections are 6.0 percent or less of net patient revenues.3
WHAT WOULD THE IMPACT OF LIMITING THE USE OF PROVIDER TAXES BE ON STATES?
On June 22, 2017, the Senate released the “Better Care Reconciliation Act of 2017” which proposes a phase down of the provider tax safe harbor threshold from 6.0 percent to 5.0 percent of net patient revenues over 5 years beginning in 2021. The threshold would be reduced to 5.8 percent in 2021, 5.6 percent in 2022, 5.4 percent in 2023, 5.2 percent in 2024, and 5.0 percent in 2025 and beyond. The 2016 Kaiser Medicaid budget survey asked states to identify whether each of the provider taxes they reported exceeded 3.5 percent of net patient revenues and/or exceeded 5.5 percent of net patient revenues as of July 1, 2016. States indicated that over 3 in 10 provider taxes in use were above the 5.5 percent threshold. In the 2016 survey, 28 states estimated that at least one provider tax was above this 5.5 percent threshold (Figure 2) and 11 of these states reported 2 or more provider taxes/fees above this threshold4 (Table 1). Broken out by type of provider tax, 20 states reported having nursing facility taxes exceeding 5.5 percent of net patient revenues, 15 states reported having taxes on intermediate care facilities for the intellectually disabled exceeding 5.5 percent, and 6 states reported having hospital taxes exceeding 5.5 percent as of July 1, 2016 (Table 2).
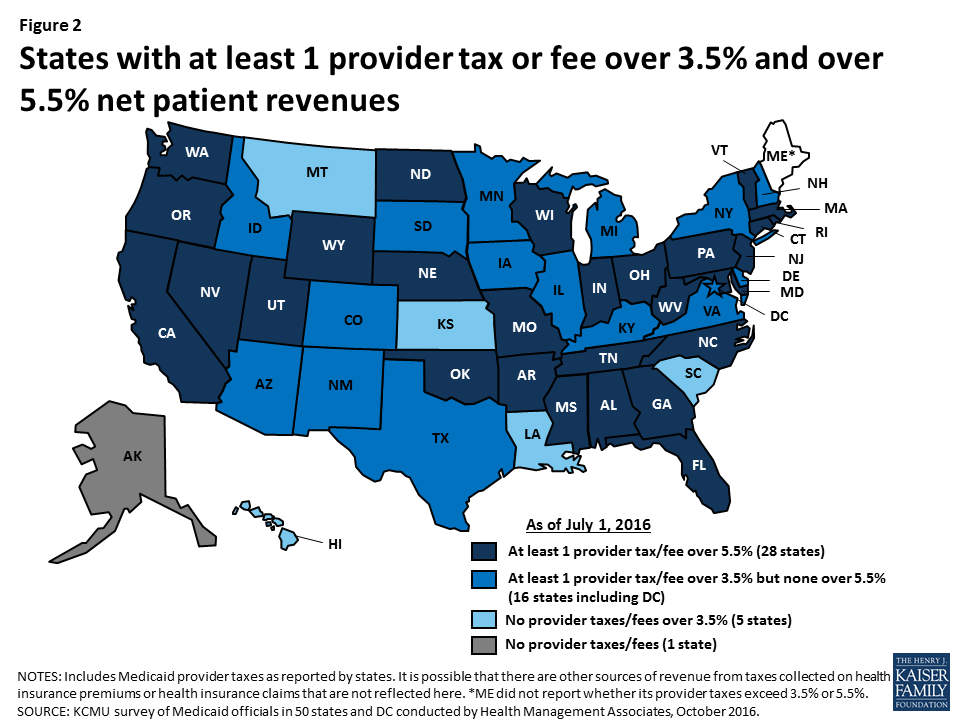
Figure 2: States with at least 1 provider tax or fee over 3.5% and over 5.5% net patient revenues
Limitations on provider taxes would have a more notable impact in those states that are heavily dependent on provider tax revenues to fund their state share of Medicaid spending. If provider taxes are limited, states would need to increase state funds to maintain current programs or make program cuts. Such changes in available financing could have negative implications for providers and beneficiaries under the current operation of the program as well as for the implementation of the ACA.
| Table 1: Provider Taxes and Fees in Place in FY 2016 | |||||
| State | Have at least 1 provider tax | Have at least 1 provider tax over 3.5% of net patient revenue | # of taxes over 3.5% | Have at least 1 provider tax over 5.5% of net patient revenue | # of taxes over 5.5% |
| AK | – | – | 0 | – | 0 |
| AL | X | X | 2 | X | 1 |
| AR | X | X | 2 | X | 2 |
| AZ | X | X | 1 | – | 0 |
| CA | X | X | 3 | X | 3 |
| CO | X | X | 3 | – | 0 |
| CT | X | X | 4 | X | 3 |
| DC | X | X | 2 | – | 0 |
| DE | X | X | 1 | – | 0 |
| FL | X | X | 2 | X | 2 |
| GA | X | X | 1 | X | 1 |
| HI | X | – | 0 | – | 0 |
| IA | X | X | 1 | – | 0 |
| ID | X | X | 1 | – | 0 |
| IL | X | X | 1 | – | 0 |
| IN | X | X | 3 | X | 1 |
| KS | X | – | 0 | – | 0 |
| KY | X | X | 3 | – | 0 |
| LA | X | – | 0 | – | 0 |
| MA | X | X | 1 | X | 1 |
| MD | X | X | 3 | X | 2 |
| ME | X | NR | NR | NR | NR |
| MI | X | X | 2 | – | 0 |
| MN | X | X | 1 | – | 0 |
| MO | X | X | 4 | X | 3 |
| MS | X | X | 4 | X | 4 |
| MT | X | – | 0 | – | 0 |
| NC | X | X | 2 | X | 1 |
| ND | X | X | 1 | X | 1 |
| NE | X | X | 1 | X | 1 |
| NH | X | X | 2 | – | 0 |
| NJ | X | X | 1 | X | 1 |
| NM | X | X | 1 | – | 0 |
| NV | X | X | 1 | X | 1 |
| NY | X | X | 3 | – | 0 |
| OH | X | X | 3 | X | 3 |
| OK | X | X | 2 | X | 2 |
| OR | X | X | 2 | X | 1 |
| PA | X | X | 5 | X | 2 |
| RI | X | X | 2 | X | 1 |
| SC | X | – | 0 | – | 0 |
| SD | X | X | 1 | – | 0 |
| TN | X | X | 4 | X | 1 |
| TX | X | X | 1 | – | 0 |
| UT | X | X | 2 | X | 1 |
| VA | X | X | 1 | – | 0 |
| VT | X | X | 4 | X | 4 |
| WA | X | X | 2 | X | 1 |
| WI | X | X | 2 | X | 1 |
| WV | X | X | 3 | X | 1 |
| WY | X | X | 1 | X | 1 |
| Total | 50 | 44 | 92 | 28 | 47 |
| NOTES: This table includes Medicaid provider taxes as reported by states. Some states also have premium or claims taxes that apply to managed care organizations and other insurers. Since this type of tax is not considered a provider tax by CMS, these taxes are not counted as provider taxes in this report. CA, DC, MD, NM, OH, PA, RI, TN, TX reported MCO taxes that were counted as Medicaid provider taxes; these taxes exceed 5.5% of net patient revenues in OH and TN. NR=Not reported by state.
SOURCE: Kaiser Commission on Medicaid and the Uninsured Survey of Medicaid Officials in 50 states and DC conducted by Health Management Associates, October 2016. |
|||||
| Table 2: Provider Taxes and Fees in Place in FY 2016, by Provider Type | ||||||||||||
|
State |
Nursing Facilities | ICF/ID | Hospitals | Total | ||||||||
| Tax in place | Over 3.5% | Over 5.5% | Tax in place | Over 3.5% | Over 5.5% | Tax in place | Over 3.5% | Over 5.5% | Total # taxes | Total over 3.5% | Total over 5.5% | |
| AK | – | – | – | – | – | – | – | – | – | 0 | 0 | 0 |
| AL | X | X | X | – | – | – | X | X | – | 3 | 2 | 1 |
| AR | X | X | X | X | X | X | X | – | – | 3 | 2 | 2 |
| AZ | X | – | – | – | – | – | X | X | – | 2 | 1 | 0 |
| CA | X | X | X | X | X | X | X | X | X | 4 | 3 | 3 |
| CO | X | X | – | X | X | – | X | X | – | 3 | 3 | 0 |
| CT | X | X | X | X | X | – | X | X | X | 4 | 4 | 3 |
| DC | X | X | – | X | X | – | X | – | – | 4 | 2 | 0 |
| DE | X | X | – | – | – | – | – | – | – | 1 | 1 | 0 |
| FL | X | X | X | X | X | X | X | – | – | 3 | 2 | 2 |
| GA | X | X | X | – | – | – | X | – | – | 2 | 1 | 1 |
| HI | X | – | – | – | – | – | X | – | – | 2 | 0 | 0 |
| IA | X | – | – | X | X | – | X | – | – | 3 | 1 | 0 |
| ID | X | X | – | X | – | – | X | – | – | 3 | 1 | 0 |
| IL | X | – | – | X | X | – | X | – | – | 3 | 1 | 0 |
| IN | X | X | – | X | X | X | X | X | – | 3 | 3 | 1 |
| KS | X | – | – | – | – | – | X | – | – | 2 | 0 | 0 |
| KY | X | X | – | X | X | – | X | – | – | 5 | 3 | 0 |
| LA | X | – | – | X | – | – | – | – | – | 3 | 0 | 0 |
| MA | X | X | X | – | – | – | X | – | – | 3 | 1 | 1 |
| MD | X | X | X | X | X | X | X | X | – | 4 | 3 | 2 |
| ME | X | NR | NR | X | NR | NR | X | NR | NR | 4 | NR | NR |
| MI | X | X | – | – | – | – | X | X | – | 2 | 2 | 0 |
| MN | X | – | – | X | X | – | X | – | – | 4 | 1 | 0 |
| MO | X | X | X | X | X | X | X | X | X | 5 | 4 | 3 |
| MS | X | X | X | X | X | X | X | X | X | 4 | 4 | 4 |
| MT | X | – | – | X | – | – | X | – | – | 3 | 0 | 0 |
| NC | X | X | X | X | X | – | X | – | – | 3 | 2 | 1 |
| ND | – | – | – | X | X | X | – | – | – | 1 | 1 | 1 |
| NE | X | – | – | X | X | X | – | – | – | 2 | 1 | 1 |
| NH | X | X | – | – | – | – | X | X | – | 2 | 2 | 0 |
| NJ | X | – | – | X | X | X | X | – | – | 5 | 1 | 1 |
| NM | – | – | – | – | – | – | – | – | – | 3 | 1 | 0 |
| NV | X | X | X | – | – | – | – | – | – | 1 | 1 | 1 |
| NY | X | X | – | X | X | – | X | X | – | 5 | 3 | 0 |
| OH | X | X | X | X | X | X | X | – | – | 4 | 3 | 3 |
| OK | X | X | X | X | X | X | X | – | – | 3 | 2 | 2 |
| OR | X | X | X | – | – | – | X | X | – | 2 | 2 | 1 |
| PA | X | X | X | X | X | X | X | X | – | 5 | 5 | 2 |
| RI | X | X | – | – | – | – | X | X | X | 3 | 2 | 1 |
| SC | – | – | – | X | – | – | X | – | – | 2 | 0 | 0 |
| SD | – | – | – | X | X | – | – | – | – | 1 | 1 | 0 |
| TN | X | X | – | X | X | – | X | X | – | 4 | 4 | 1 |
| TX | – | – | – | X | X | – | – | – | – | 2 | 1 | 0 |
| UT | X | X | X | X | X | – | X | – | – | 4 | 2 | 1 |
| VA | – | – | – | X | X | – | – | – | – | 1 | 1 | 0 |
| VT | X | X | X | X | X | X | X | X | X | 4 | 4 | 4 |
| WA | X | X | – | X | X | X | X | – | – | 3 | 2 | 1 |
| WI | X | – | – | X | X | – | X | – | – | 4 | 2 | 1 |
| WV | X | X | X | X | X | – | X | – | – | 5 | 3 | 1 |
| WY | X | X | X | – | – | – | – | – | – | 1 | 1 | 1 |
| Total | 44 | 32 | 20 | 36 | 31 | 15 | 40 | 17 | 6 | 152 | 92 | 47 |
| NOTES: This table includes Medicaid provider taxes in place as of FY 2016 and state-reported data on whether each provider tax exceeded 3.5% and/or 5.5% of net patient revenues as of July 1, 2016. Total numbers of provider taxes in place, over 3.5%, and over 5.5% include some “other” provider taxes reported by states that are not included in this table. Therefore, state counts across the three categories do not sum to totals for all states. ICF/ID=Intermediate care facilities for the intellectually disabled. NR=Not reported by state.
SOURCE: Kaiser Commission on Medicaid and the Uninsured Survey of Medicaid Officials in 50 states and DC conducted by Health Management Associates, October 2016. |
||||||||||||
Endnotes
Prior to October 2011, this safe harbor threshold was temporarily reduced to 5.5 percent of net patient revenues.
As of the survey conducted in July 2016, eight states (Arkansas, Arizona, Colorado, Illinois, Indiana, Louisiana, New Hampshire, and Ohio) reported plans to use new or increased provider taxes/fees, or insurance premium taxes, to fund at least some of the state share of Medicaid expansion costs in 2017 when the federal match rate declined from 100% for those newly eligible under expansion.
Prior to October 2011, this safe harbor threshold was temporarily reduced to 5.5 percent of net patient revenues.
State responses reflect estimates; some taxes are imposed in a way that is not directly tied to the % of net patient revenue (e.g. nursing home bed tax).