Mapping Marketplace Enrollment
Compare Actual vs. Potential Signups By Local Area
The analysis below and zip code tool estimate the share of the potential Marketplace shoppers in geographic areas across the U.S. who enrolled in coverage in 2015.
See what share of potential Marketplace enrollees signed up for coverage in 2015 in your area
What share of potential marketplace enrollees signed up for coverage in 2015?
Percentage of the Potential Marketplace Enrollees who Signed up for Coverage in 2015
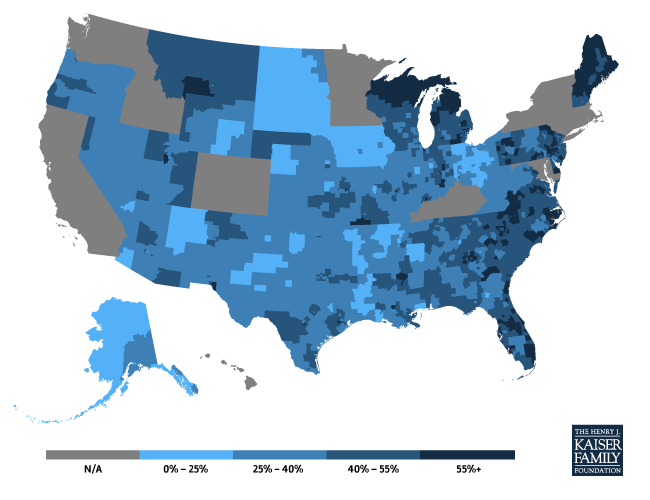
Source: KFF analysis of federal marketplace signup data by zip code and modeling based on the Current Population Survey (CPS) applied to the American Community Survey (ACS). See methodology for more information.
Note: We define the potential market for marketplaces as including people who were uninsured or buying their own insurance before the ACA went into effect, who are not eligible for Medicaid or employer coverage, who are not in the coverage gap, and who are citizens or authorized immigrants.
This analysis was prepared by Larry Levitt, Anthony Damico, Cynthia Cox, and Gary Claxton of the Kaiser Family Foundation.
In order to determine the potential market population of each PUMA, we applied our Current Population Survey (CPS) modeling work to the American Community Survey (ACS) to achieve sub-state geographic estimates. Using the ACS microdata, we computed the population most comparable to the definition of health insurance exchange potential market (discussed in our state estimates of subsidy-eligibles) and then controlled statewide totals to our CPS estimates. Although it lacks sufficient sample size for most sub-state analyses, the detailed income and household relationship information in the CPS allow for more accurate state estimates of the potential market population than the ACS.
To calculate the number of plan selections in each PUMA, we merged the HHS Marketplace Enrollment by Zip Code file to a crosswalk between zip code tabulation areas (ZCTAs) and PUMAs provided by the Missouri Census Data Center. Zip codes with missing enrollment due to less than 50 signups were allocated a proportion of the total missing statewide selections based on the 2010 Census population. Nationwide, this affected approximately four percent of plan selections. In cases where a ZCTA had residents in multiple PUMAs, we allocated the reported number of plan selections across each of those PUMAs based on the distribution of the total Census 2010 population. Because the geographies presented by this interactive were originally constructed for the 2010 Decennial Census, some zip codes with small populations or recent changes by the United States Postal Service might be unavailable.
In certain areas of Miami-Dade and Broward counties in Florida, the number of actual sign-ups exceeded our estimate of the potential market in those areas, so sign-ups as a percent of the total market were capped at 100%. As mentioned above, we exclude from our estimates of the potential market people eligible for Medicaid or employer coverage. However, it is possible that some people who were eligible for Medicaid or employer coverage ended up enrolling in Marketplace coverage (even if they would not have received subsidies).
-
Frequently Asked Questions
As of the end of the 2015 Affordable Care Act open enrollment period, 11.7 million people had signed up for coverage in a Health Insurance Marketplace (though somewhat fewer likely ended up paying their first month’s premium and getting covered.)
2015 Marketplace signups varied substantially across states when looked at as a share of the “potential market” for the Marketplaces, ranging from a high of 70% in Vermont and 64% in Florida to lows of less than 25% in Iowa, South Dakota, Minnesota, North Dakota, Hawaii, and Alaska. While the vast majority of the population – with the exception of undocumented immigrants and Medicare beneficiaries – can sign up for a plan through a Marketplace, only people not eligible for Medicaid or without access to employer coverage meeting certain minimum requirements are eligible for tax credits based on their income. Therefore, we define the potential market for Marketplaces as including people who were uninsured or buying their own insurance before the ACA went into effect, who are not eligible for Medicaid or employer coverage, who are not in the coverage gap, and who are citizens or authorized immigrants.
Using newly-released federal Marketplace 2015 signup data by zip code, we are able to examine how signups varied within states that used Healthcare.gov. We translated zip code enrollment data into Public Use Microdata Areas (PUMA), which are statistical geographic areas defined for the tabulation and dissemination of certain census data that allow the enrollment information to be matched to federal survey data. PUMAs are built on counties and census tracks within states and each one contains about 100,000 people. (Enrollment data by zip code is not available for states operating their own Marketplaces.)
The results show tremendous variation across the country. Healthcare.gov signups totaled 90% or more as a share of the potential market in parts of Miami-Dade and Broward counties in Florida; Philadelphia, Pennsylvania; Jackson, Mississippi; and Atlanta, Georgia. Enrollment was less than 15% of the potential market in parts of Texas, Iowa, and Ohio.
Even within states, the enrollment results vary substantially. For example, in Florida – a state that in general had strong enrollment with 64% of the potential market signing up statewide in 2015 – the signup percentage ranged from 21% in the Tallahassee area to approximately 100% in parts of Miami. In Texas – a state that had more modest enrollment at 39% of the potential market – the share signing up ranged from 12% in the College Station area to 81% in some Houston suburbs.
There are no strong patterns in enrollment by the income, educational attainment, or race/ethnicity of the regions. While PUMAs can encompass both urban and rural areas, signups as a share of the potential market tended to be higher in more urban parts of the country and lower in more rural locations, though that’s not always the case. Outreach might have been more successfully focused on areas with high population density and low enrollment, particularly where there were community-based resources on the ground that can be marshalled.
It may be that targeted outreach efforts – by the federal government and national and local organizations – explain much of the variation in enrollment across the country. However, that effect is difficult to quantify without systematic public data on those outreach activities.
Areas with very high or very low enrollment as a share of the potential market in 2014 tended to see similar patterns in 2015. Some of the most significant Healthcare.gov enrollment growth from 2014 to 2015 (as a share of the potential market) took place in parts of Pennsylvania, Florida, and Indiana. Among areas with available zip code sign up data in both 2014 and 2015, Detroit, Michigan was the only place to see a decrease in the share of the potential market enrolled (ranging from a decrease of 5 percentage points in Northeast to a decrease of 11 percentage points in Northwest and North Central Detroit).