2015 Employer Health Benefits Survey
Section Two: Health Benefits Offer Rates
While nearly all large firms (200 or more workers) offer health benefits to at least some employees, small firms are significantly less likely to do so. The percentage of all firms offering health benefits in 2015 (57%) is not statistically different from the percentage of firms that offered health benefits in 2005 when 60% of firms offered coverage to at least some employees. Firms not offering health benefits continue to cite “cost” as the most important reason they do not do so. Almost all firms that offer coverage offer coverage to dependents such as children and the spouses of eligible employees.
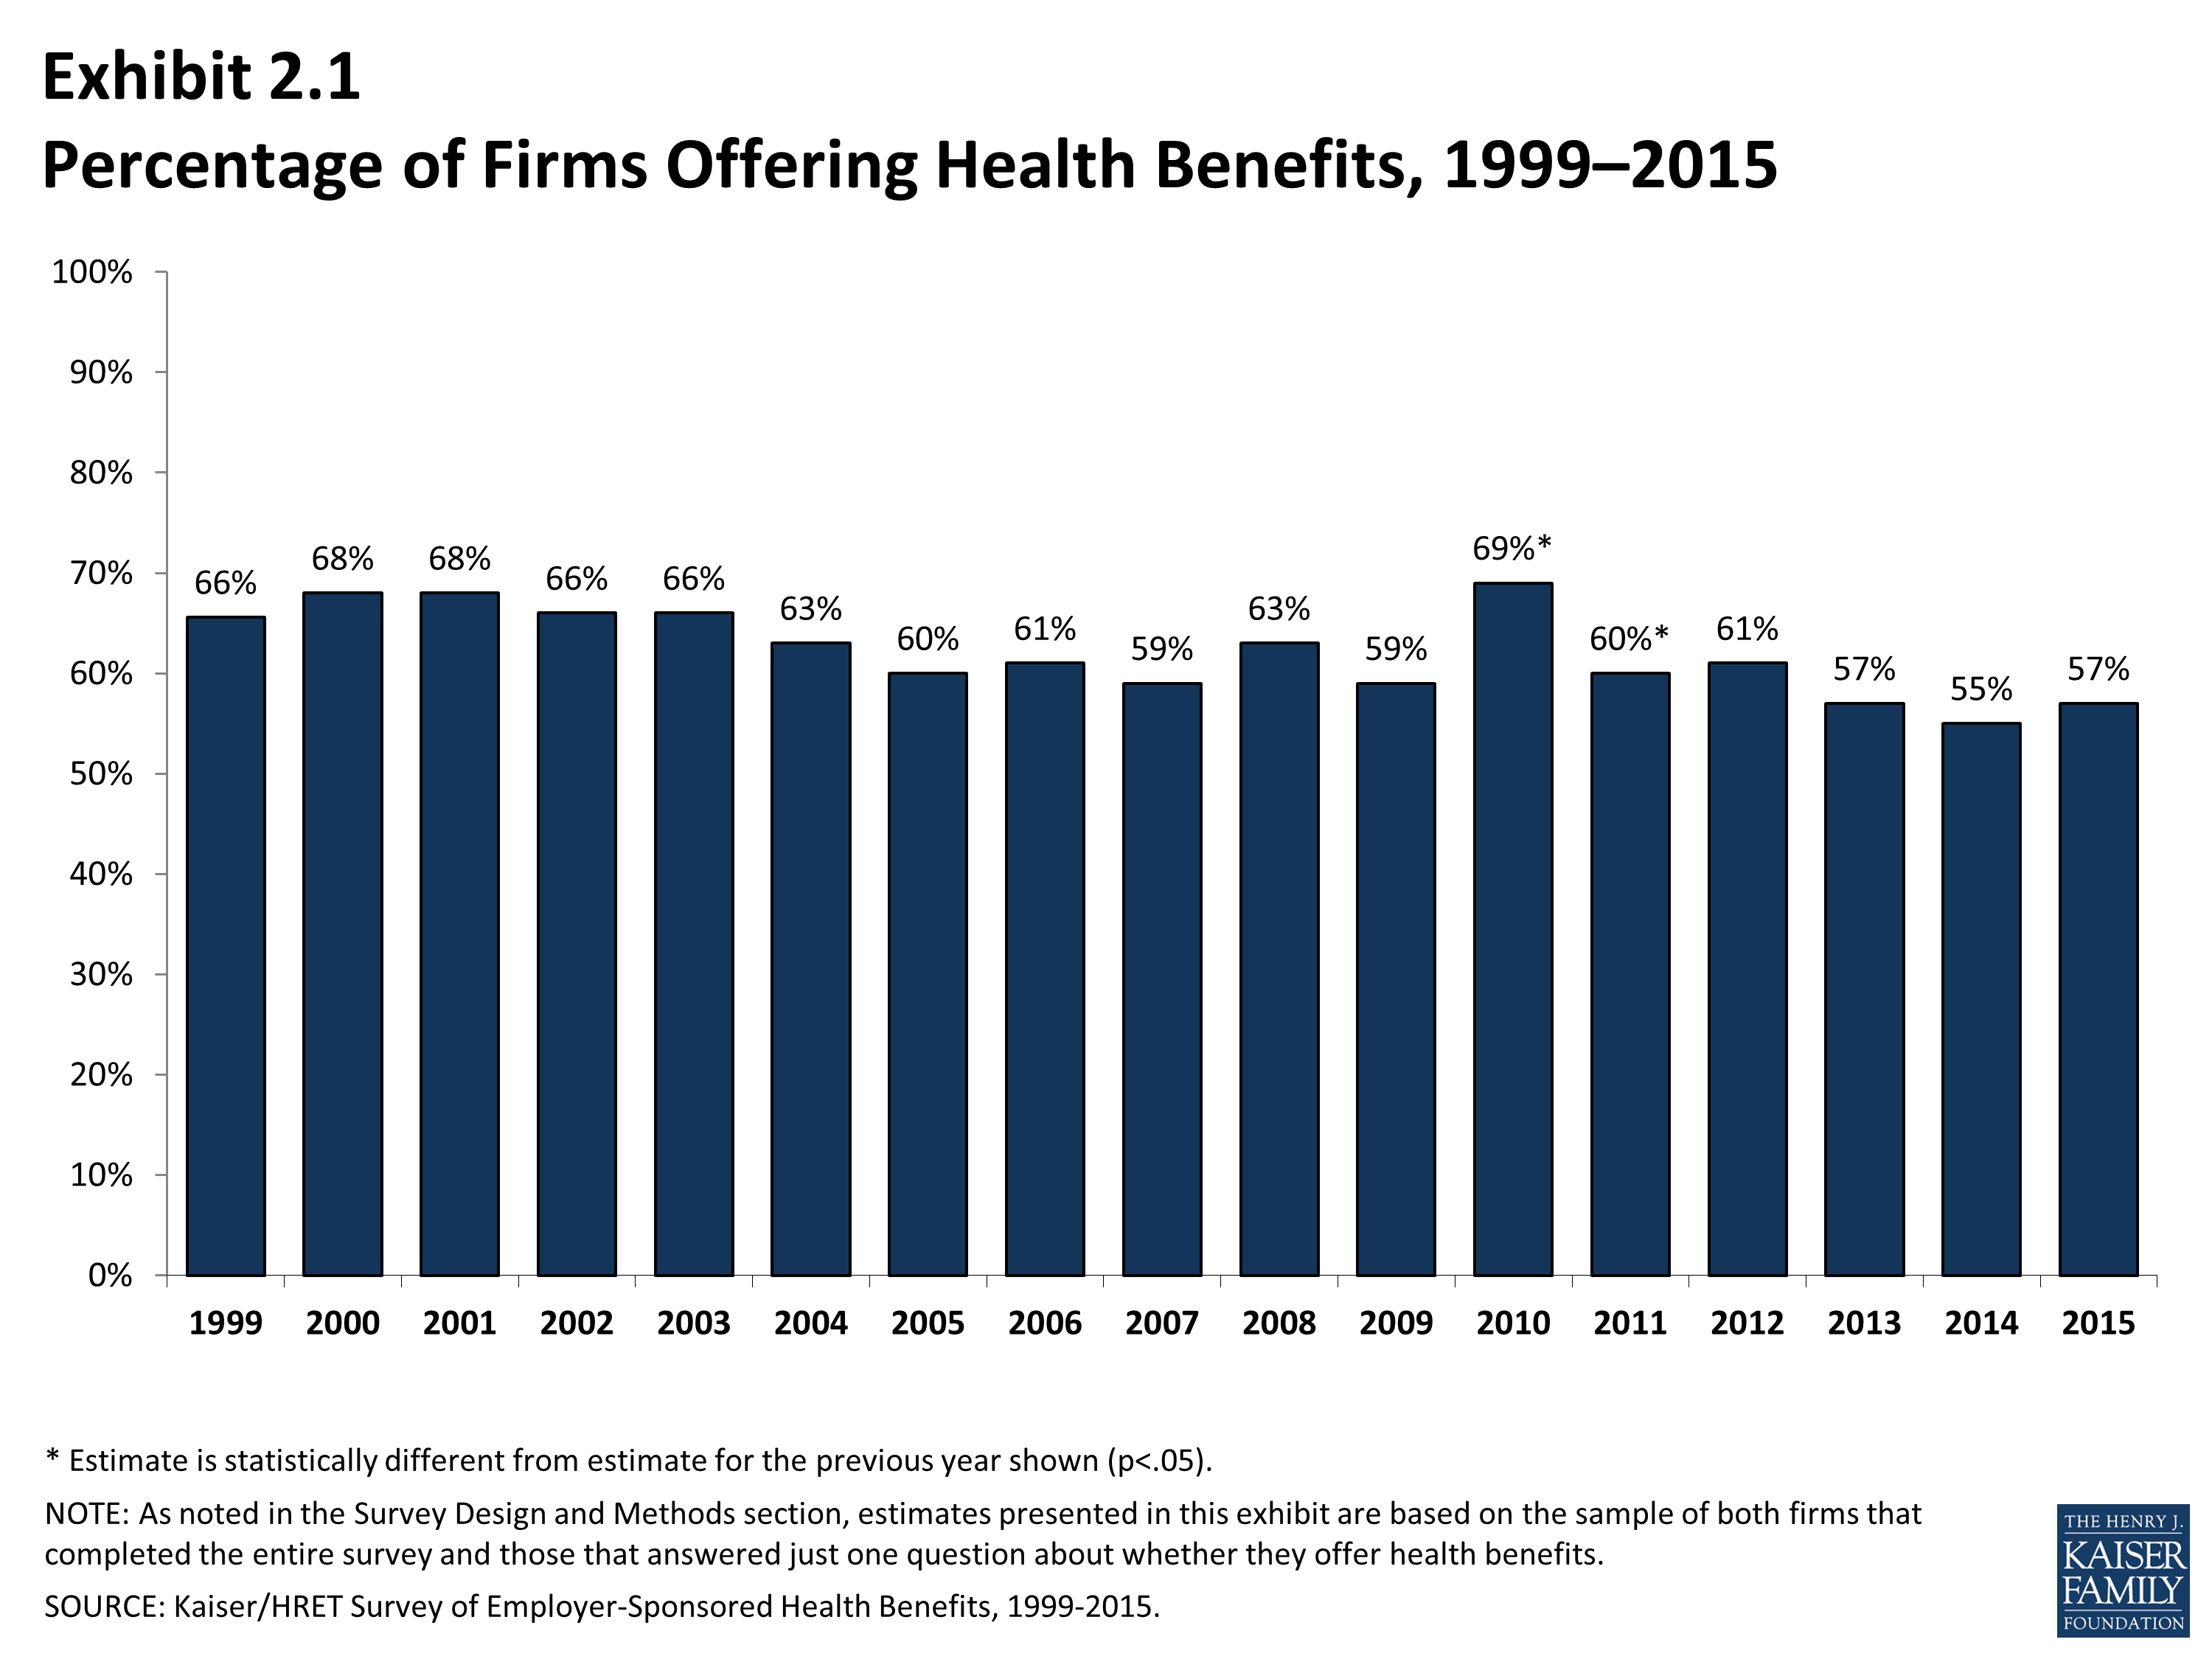
- In 2015, 57% of firms offer health benefits, not statistically different from the 55% who reported doing so in 2014 (Exhibit 2.1).
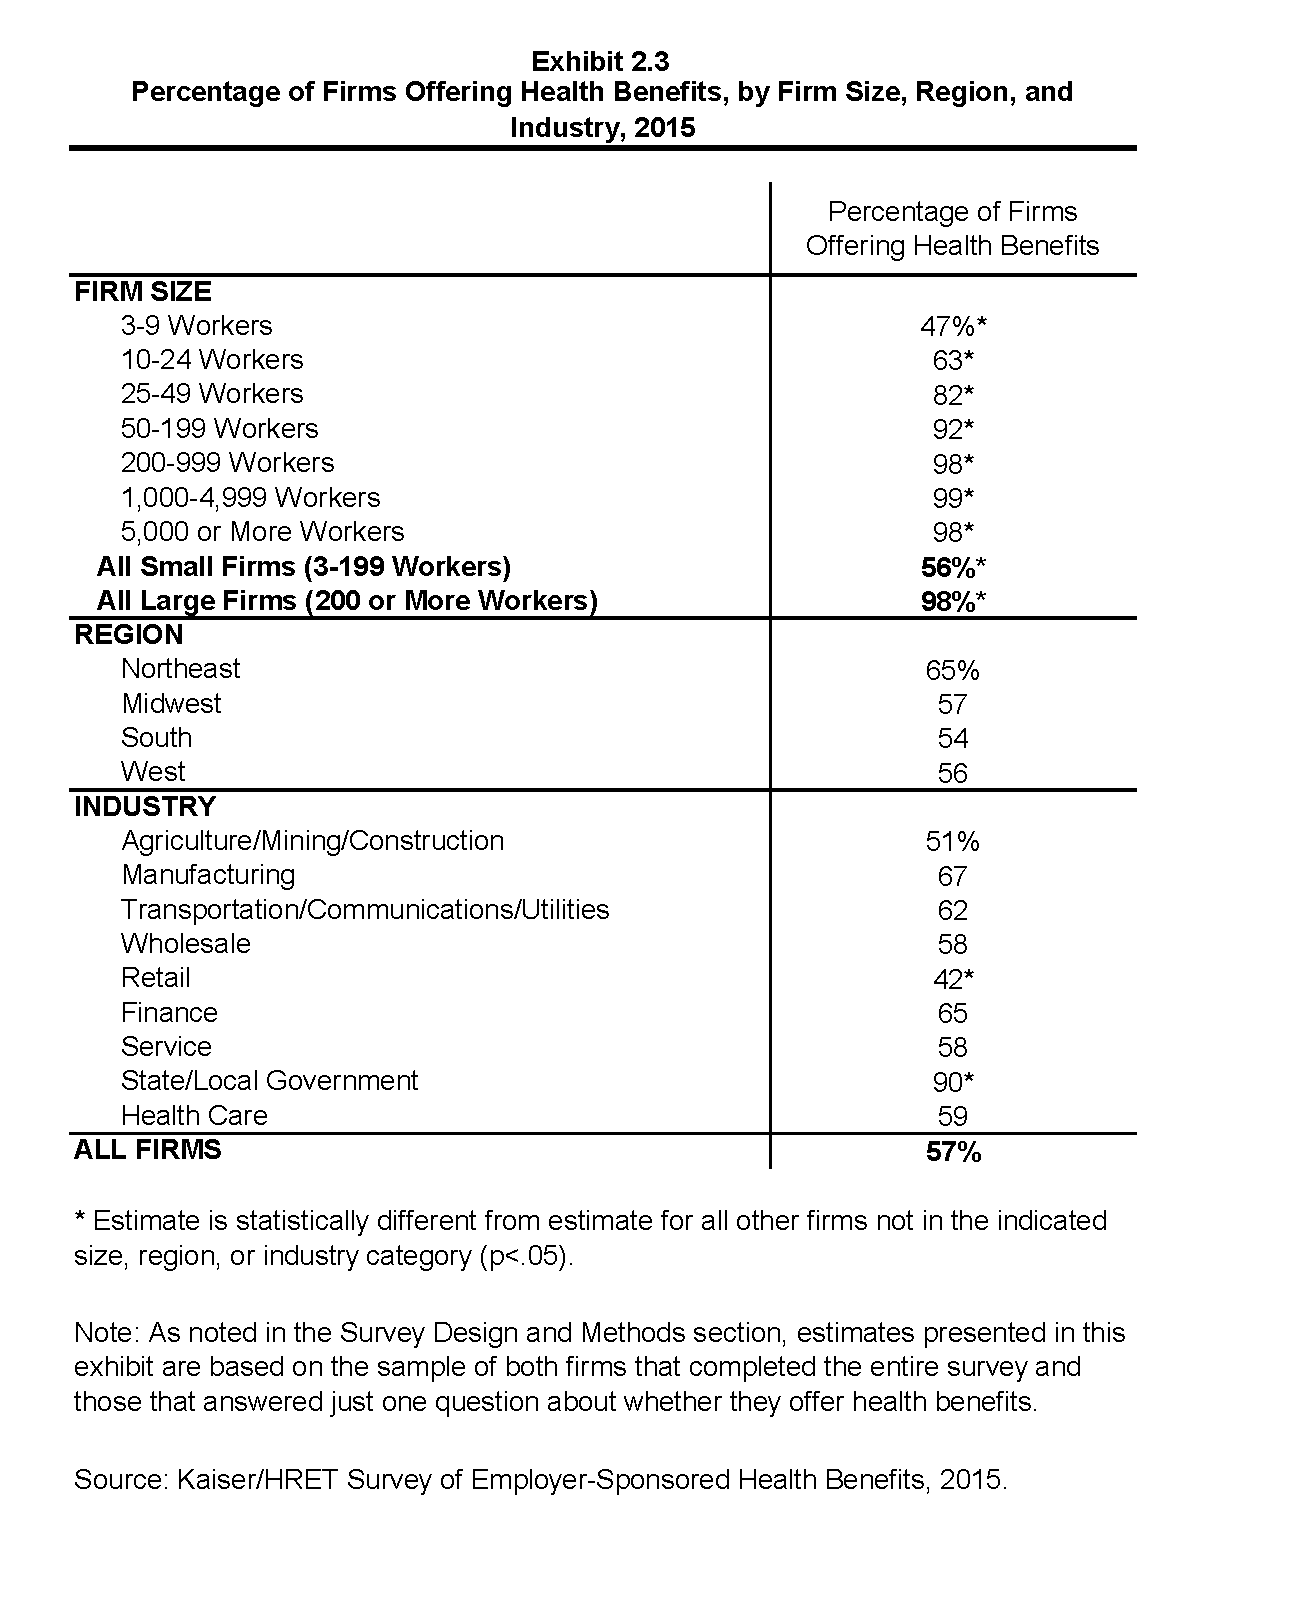
- Ninety-eight percent of large firms (200 or more workers) offer health benefits to at least some of their workers (Exhibit 2.3). In contrast, only 56% of small firms (3 to 199 workers) offer health benefits in 2015. The percentage of both small and large firms offering health benefits to at least some of their workers is similar to last year (Exhibit 2.2).
- Since most firms in the country are small, variation in the overall offer rate is driven primarily by changes in the percentages of the smallest firms (3 to 9 workers) offering health benefits. For more information on the distribution of firms in the country, see the Survey Design and Methods Section and Exhibit M1.1
- Ninety-seven percent of firms with 100 or more employees offered health benefits to at least some of their employees in 2015. Eighty-nine percent of firms with between 50 and 99 workers offered benefits to at least some workers (Exhibit 2.5). The percentage of firms offering health benefits in each of these firm size categories is similar to last year.
- Over the 1999 to 2015 period, there has been a statistically significant decrease in the percentage of firms offering health benefits. This decline is due to changes in offer rates for small firms.
- Offer rates vary across different types of firms.
- Smaller firms are less likely to offer health insurance: 47% of firms with 3 to 9 workers offer coverage, compared to 63% of firms with 10 to 24 workers, 82% of firms with 25 to 49 workers, and 92% of firms with 50 to 199 employees (Exhibit 2.3).
- Offer rates throughout different firm size categories in 2015 remained similar to those reported in 2014 (Exhibit 2.2).
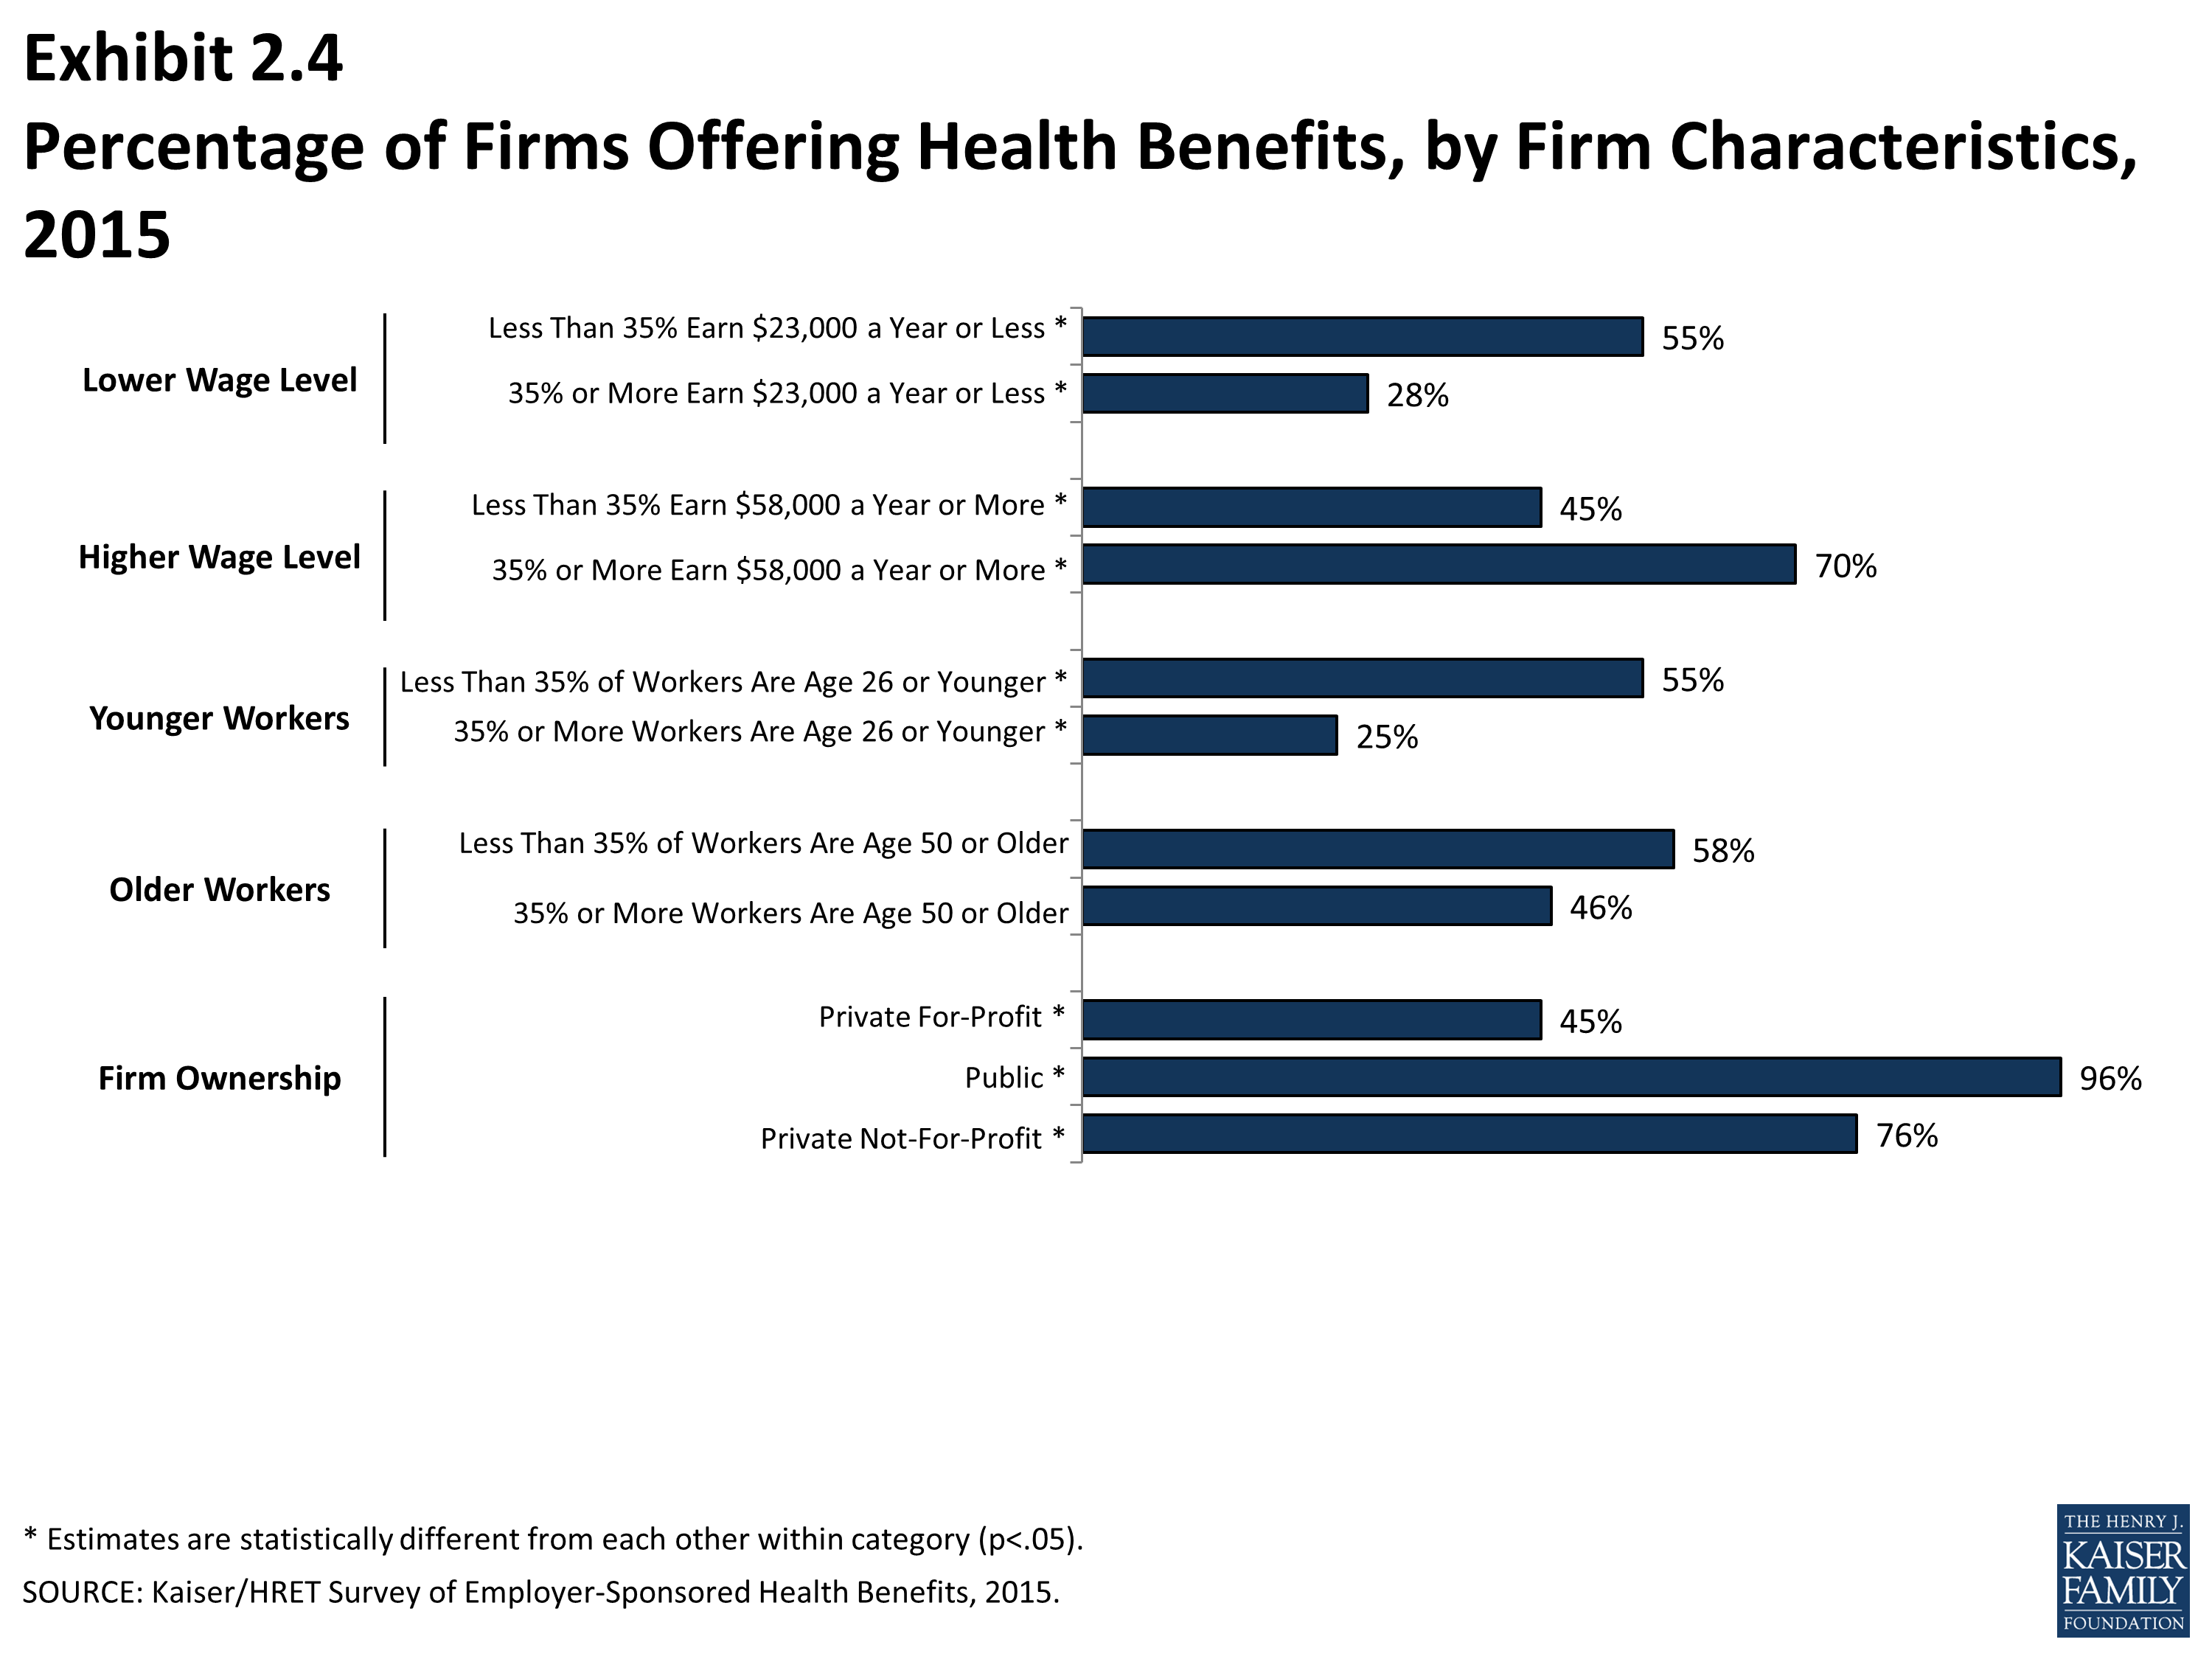
- Firms with fewer lower-wage workers (less than 35% of workers earn $23,000 or less annually) are significantly more likely to offer health insurance than firms with many lower-wage workers (55% vs. 28%) (Exhibit 2.4). The offer rate for firms with many lower-wage workers is not significantly different from the 33% reported in 2014.
- We observe a similar pattern among firms with many higher-wage workers (35% or more of workers earn $58,000 or more annually) being more likely to offer coverage to employees (70% versus 45%) (Exhibit 2.4).
- The age of the workforce correlates with the probability of a firm offering health benefits. Firms where 35% or more of their workers are age 26 or younger are less likely to offer health benefits than firms where less than 35% of workers are age 26 or younger (25% and 55%, respectively) (Exhibit 2.4). The percentage of firms with many younger workers that offer health benefits is similar to the 30% reported in 2014.
Part-Time and Temporary Workers
- Among firms offering health benefits, relatively few offer benefits to their part-time and temporary workers.
- The Affordable Care Act defines part-time workers as those who on average work fewer than 30 hours per week. The employer shared responsibility provision of the Affordable Care Act requires that large firms offer full-time employees a minimum standard of coverage or be assessed a penalty2. Beginning this year, we modified the survey to explicitly ask employers whether they offered benefits to employees working fewer than 30 hours. Our previous question did not include a definition of “part-time”. For this reason, historical data on part-time offer rates are shown but we did not test whether the differences between 2014 and 2015 were significant. Many employers may work with multiple definitions of part-time; one for their compliance with legal requirements and another for internal policies and programs.
- In 2015, 19% of all firms that offer health benefits offer them to part-time workers (Exhibit 2.6). Firms with 200 or more workers are more likely to offer health benefits to part-time employees than firms with 3 to 199 workers (35% vs. 18%) (Exhibit 2.9).
- Among firms offering health benefits to at least some employees, relatively few report that they stopped offering benefits to part-time workers in the last year (2%) (Exhibit 2.7).
- A small percentage (3%) of firms offering health benefits offer them to temporary workers (Exhibit 2.8). More large firms (200 or more workers) offering health benefits elect to offer temporary workers coverage than small firms (11% vs. 3%) (Exhibit 2.10).
Spouses, Dependents and Domestic Partner Benefits
- The vast majority of firms offering health benefits offer benefits to spouses and dependents, such as children. In 2015, 98% of small firms (3 to 199 workers) and 100% of large firms offering health benefits offer coverage to spouses. Similarly, 96% of small firms and 100% of large firms offering health benefits cover other dependents, such as children. Two percent of small firms offering health benefits do not offer coverage to any dependents (Exhibit 2.11).
- This year we asked employers whether same-sex and opposite-sex domestic partners were allowed to enroll in a firm’s coverage. While definitions may vary, employers often define domestic partners as an unmarried couple who have lived together for a specified period of time. Firms may define domestic partners separately from any legal requirements a state may have, and also, employers may have a different policy in different parts of the country. Employers were asked these questions during the survey’s fielding period from January 2015 to the beginning of June 2015. Some employers may elect to change their policies for offering same-sex and opposite-sex domestic partner benefits following recent judicial decisions.
- In 2015, 28% of firms offering health benefits offered coverage to unmarried opposite-sex partners, similar to the 39% who did so in 2014. In 2015, 42% of firms offering benefits covered same-sex domestic partners, similar to the 39% who did so last year (Exhibit 2.13).
- The rates at which firms have offered domestic partner benefits have increased over a longer period of time. For example, in 2015, 39% of firms offering health benefits offered coverage to same-sex domestic partners, a significant increase from the 21% that did so in 2009 (Exhibit 2.13).
- When we ask employers if they offer health benefits to opposite or same-sex domestic partners, many firms report that they have not encountered this issue. At many small firms (3 to 199 workers), the firm may not have formal human resource policies on domestic partners simply because none of the firm’s employees have asked to cover a domestic partner. Regarding health benefits for opposite-sex domestic partners, 30% of firms report in 2015 that they have not encountered this need or that the question was not applicable. The vast majority of firms in the United States are small businesses; 61% of firms have between 3 and 9 employees and 98% have between 3 and 199 employees (Exhibit M.1). Therefore, statistics about the percentage of firms that offer domestic partner benefits are largely determined by small businesses. More small firms (31%) compared to large firms (3%) indicate that they have not encountered this need or that the question was not applicable (Exhibit 2.12). Regarding health benefits for same-sex domestic partners, 32% of firms report that they have not encountered the need or that the question was not applicable. More small firms (32%) than large firms (5%) report that they have not encountered the issue of offering benefits to same-sex domestic partners (Exhibit 2.12).
Firms Not Offering Health Benefits
- The survey asks firms that do not offer health benefits if they have offered insurance or shopped for insurance in the recent past, and about their most important reasons for not offering coverage. Because such a small percentage of large firms report not offering health benefits, we present responses for small non-offering firms (3 to 199 workers) only.
- The cost of health insurance remains the primary reason cited by firms for not offering health benefits. Among small firms (3-199 workers) not offering health benefits, 41% cite high cost as “the most important reason” for not doing so, followed by “employees are generally covered under another plan” (26%) (Exhibit 2.14). Relatively few employers indicate that they did not offer because they believe that employees will get a better deal on the health insurance exchanges (4%).
- Many non-offering small firms have either offered health benefits in the past five years, or shopped for alternative coverage options recently.
- Twenty-five percent of non-offering small firms (3 to 199 workers) have offered health benefits in the past five years, while 27% have shopped for coverage in the past year (Exhibit 2.15). The 25% of non-offering small firms which have offered coverage in the past five years is similar to the 18% reported last year.
- Among non-offering small firms (3 to 199 workers), 17% report that they provide funds to their employees to purchase health insurance through the individual, also known as the non-group, market, such as on an individual health insurance marketplace (Exhibit 2.16). The percentage of small firms (3 to 199 workers) offering funds to purchase non-group coverage is significantly higher than last year (7%). The IRS has issued guidance limiting the circumstances in which employers can contribute to an employee’s non-group plan going forward3. Thirty-five percent of small firms that do not offer health benefits but provide employees funds to purchase coverage on the non-group market reported that they started providing funds in the last year.
- Small firms (3 to 199 workers) not offering health insurance gave a variety of estimates regarding the amount they believe the firm could afford to pay for health insurance for an employee with single coverage. Thirty-five percent reported that they could pay less than $100 per month; 14% reported that they could pay $400 or more per month (Exhibit 2.17). Alternatively, 23% of small firms not offering health benefits believed that their employees could afford less than $100 a month for single coverage. Twelve percent of firms not offering health benefits believed that their employees could afford more than $400 or more per month (Exhibit 2.18).
- Small firms (3 to 199 workers) not offering health benefits were asked to estimate the percentage of their employees who had coverage from another source. Employees could have a variety of other coverage options including a spouse’s plan, a public plan such as Medicaid, coverage through the health insurance exchanges or another employer’s plan. Fifty-eight percent of small employers estimated that three quarters or more of their employees were covered by another source of coverage (Exhibit 2.19).
SHOP Exchanges
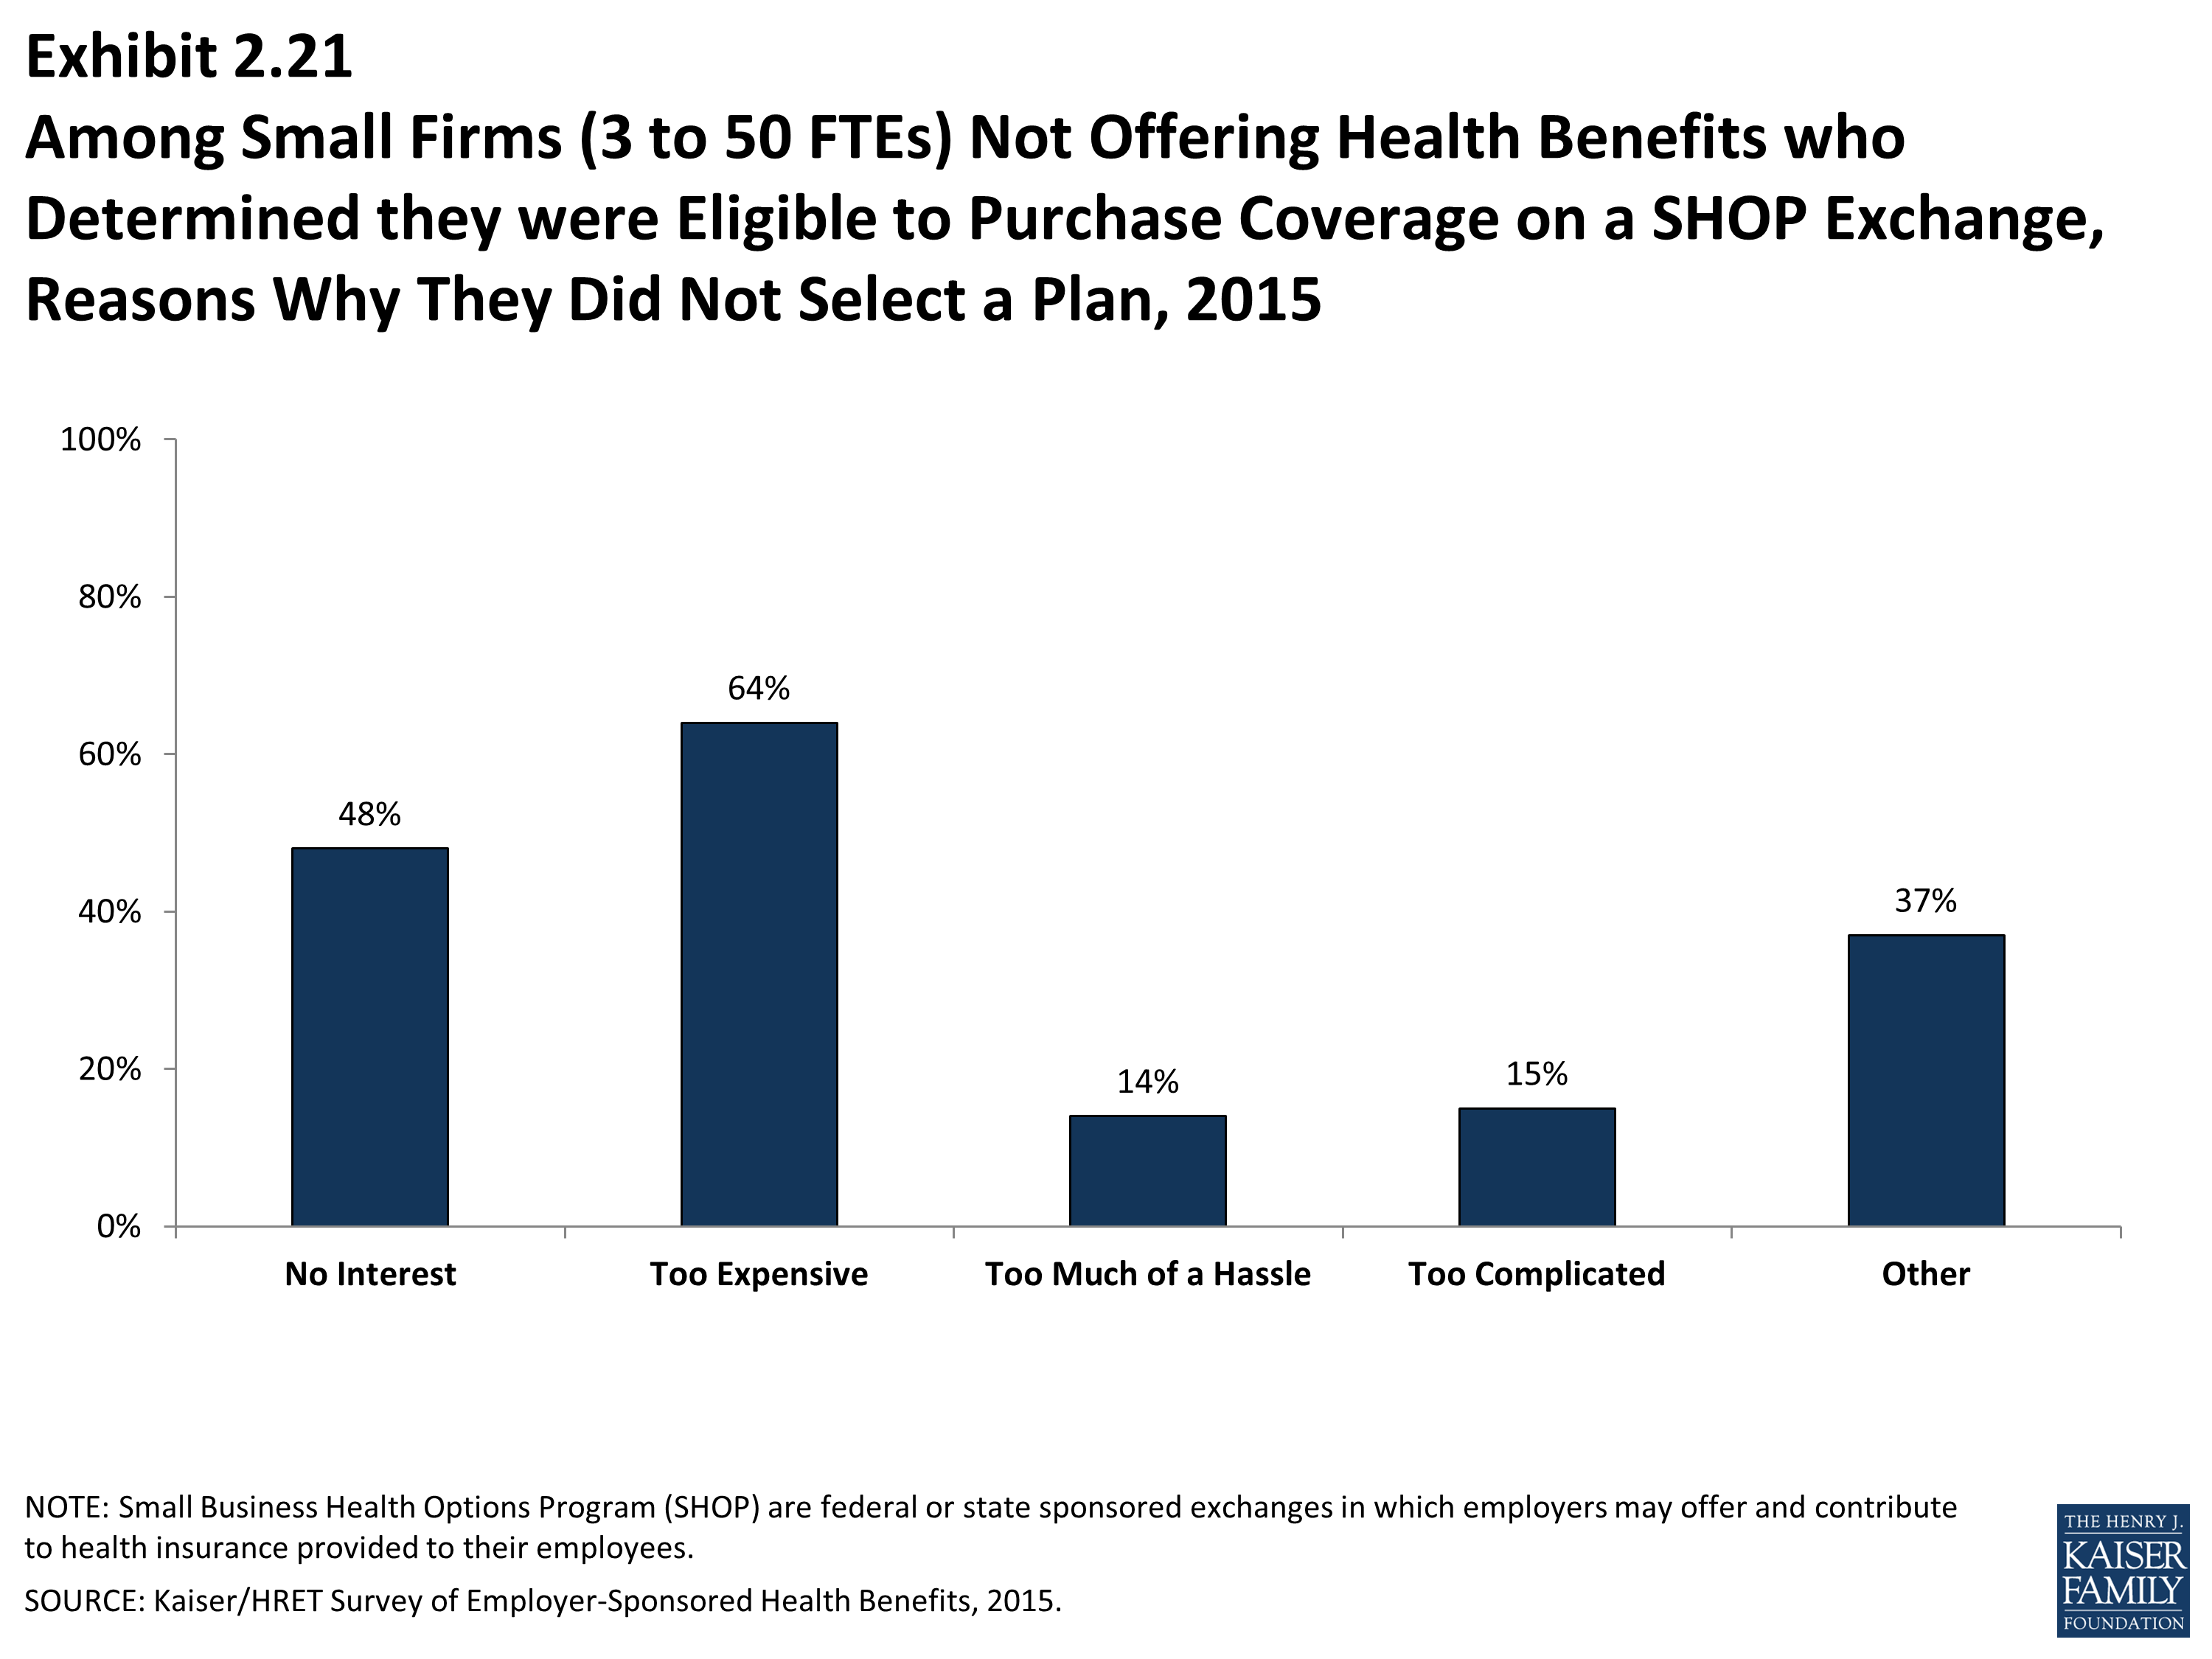
The Small Business Health Options Program (SHOP) is federal or state sponsored exchanges in which employers may offer and contribute to health insurance provided to their employees. In 2015, firms with 50 or fewer full-time equivalents are eligible to participate in a SHOP exchange. Some employers are eligible for tax credits when purchasing coverage on the exchanges.
- Seventeen percent of firms with 3 to 5o full-time equivalents who do not offer health benefits said they considered purchasing coverage on a SHOP exchange (Exhibit 2.20).
- Among non-offering firms with 5o or fewer full-time equivalents that chose not to purchase coverage on a SHOP exchange, 64% reported they did not do so because the plans were too expensive (Exhibit 2.21).
Percentage of Firms Offering Health Benefits, 1999–2015

Percentage of Firms Offering Health Benefits, by Firm Size, 1999-2015
Percentage of Firms Offering Health Benefits, by Firm Size, Region, and Industry, 2015
Percentage of Firms Offering Health Benefits, by Firm Characteristics, 2015
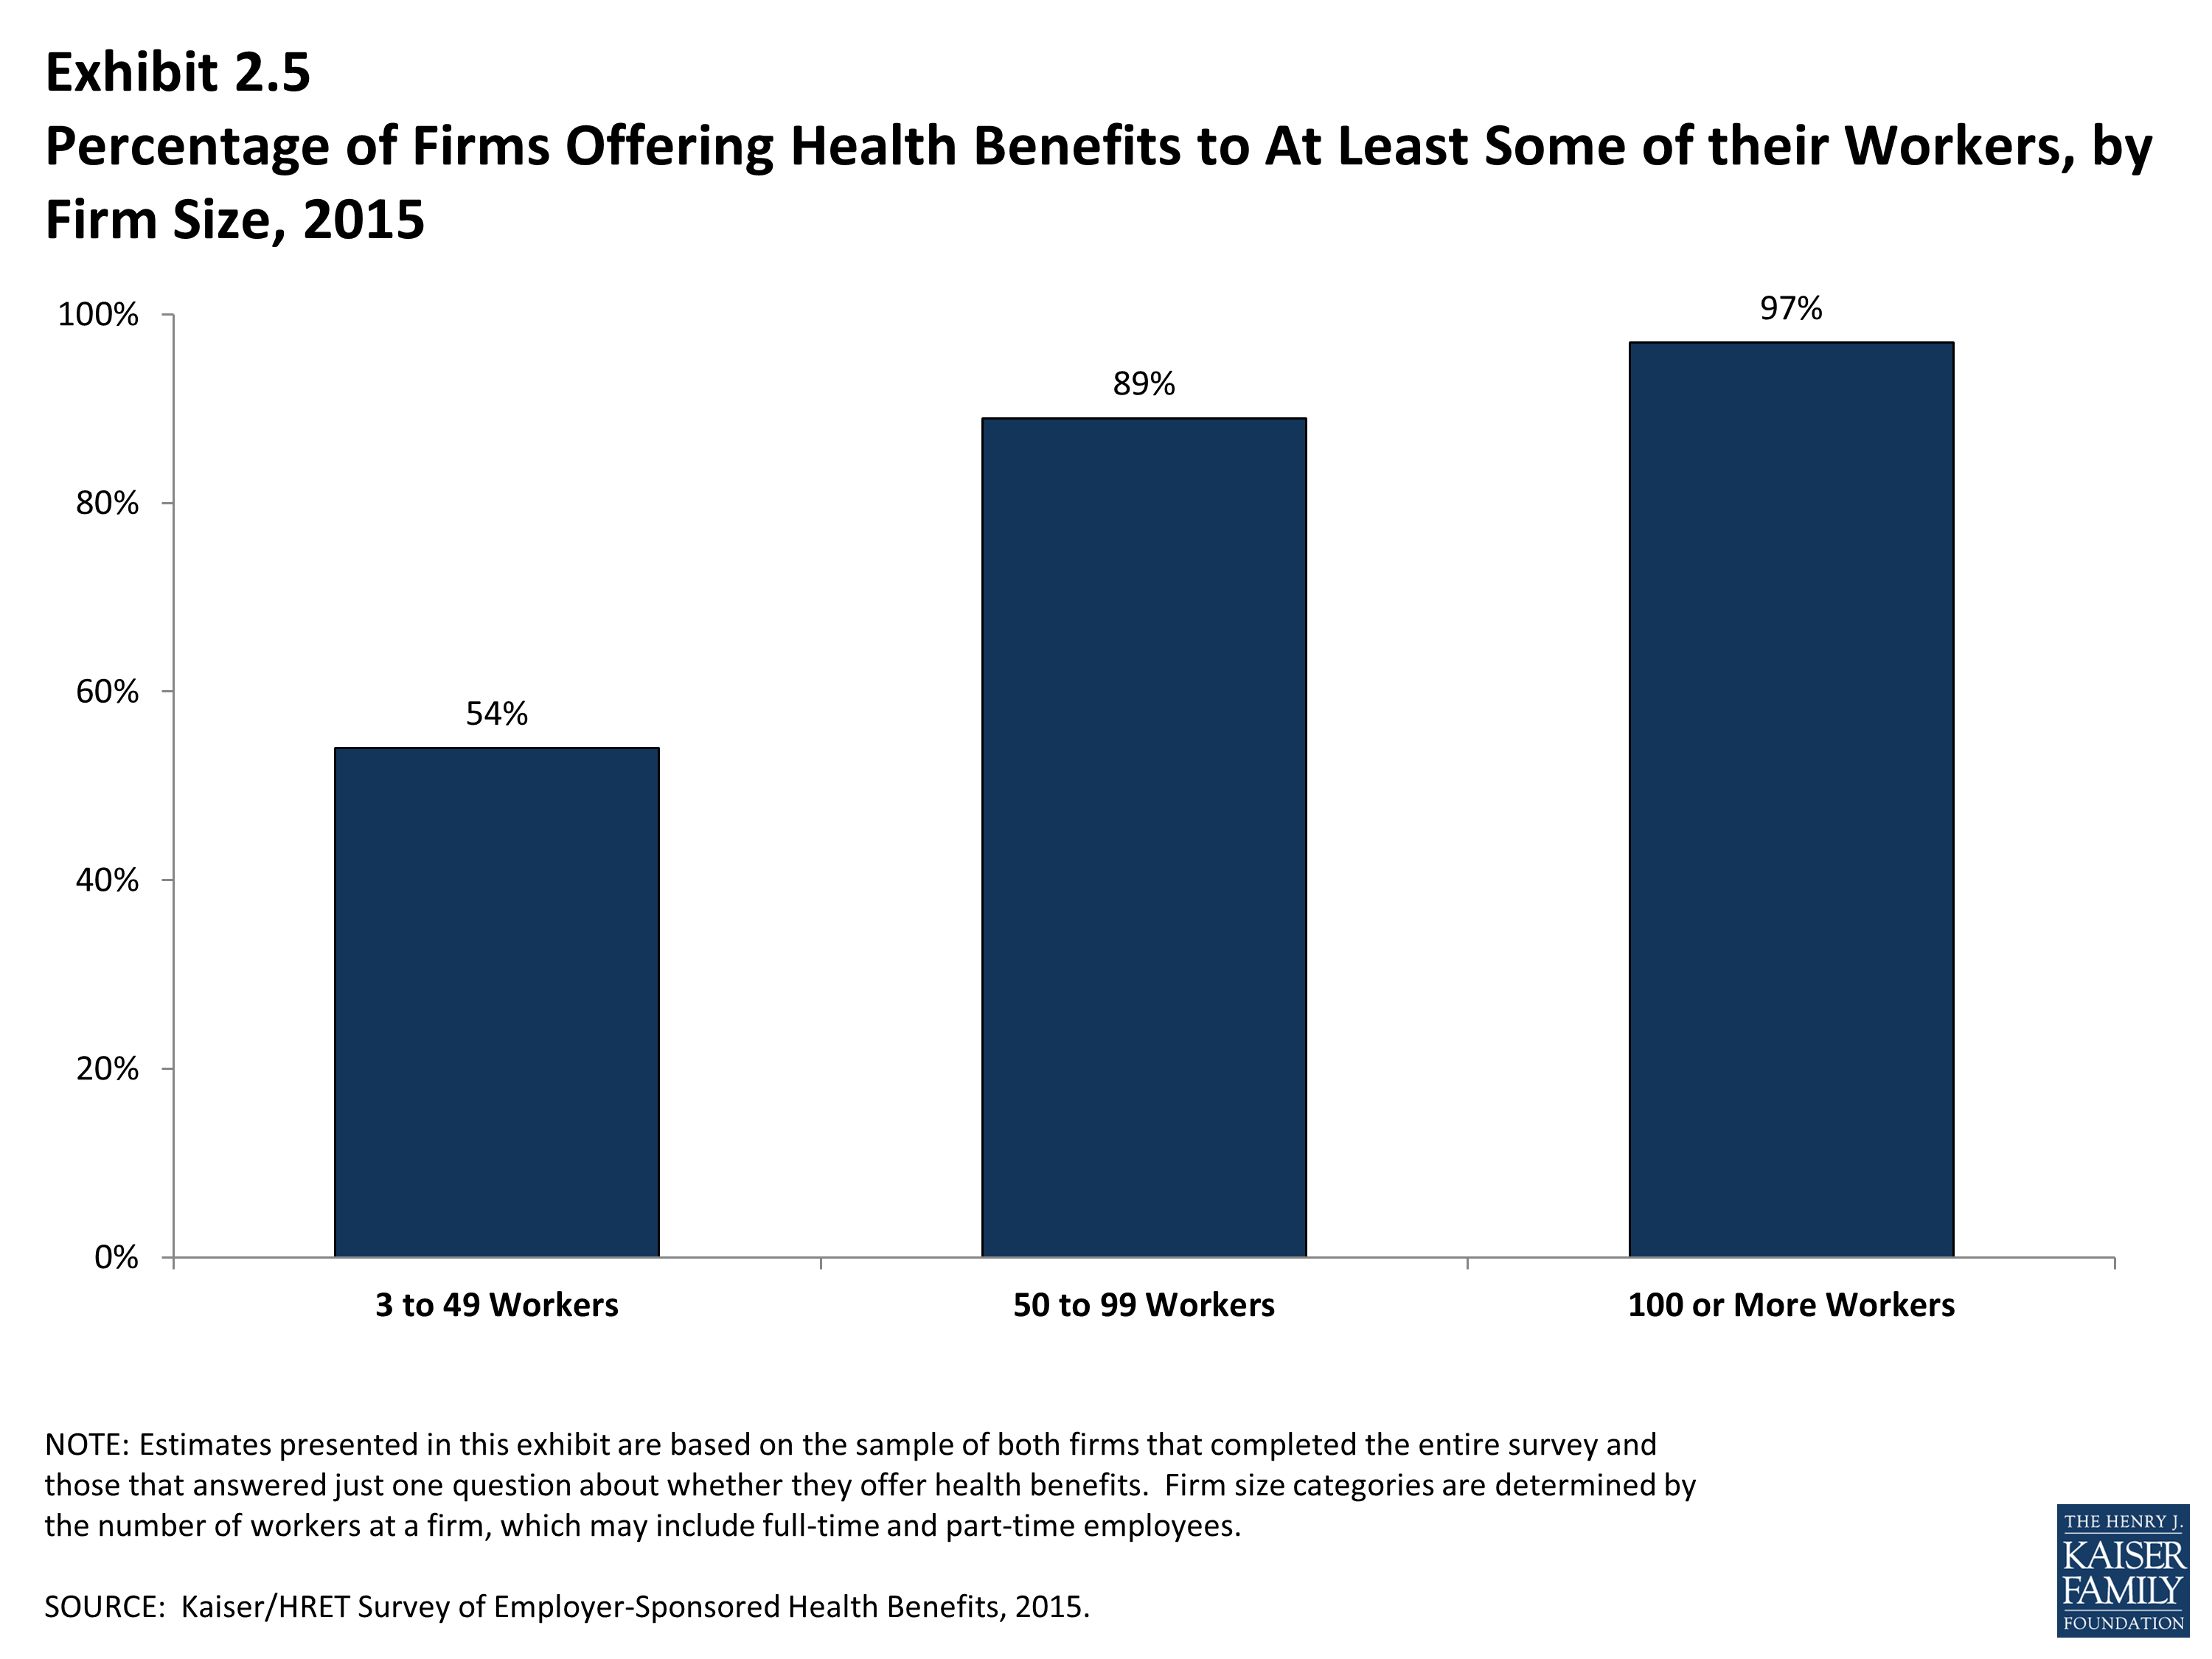
Percentage of Firms Offering Health Benefits to At Least Some of their Workers, by Firm Size, 2015
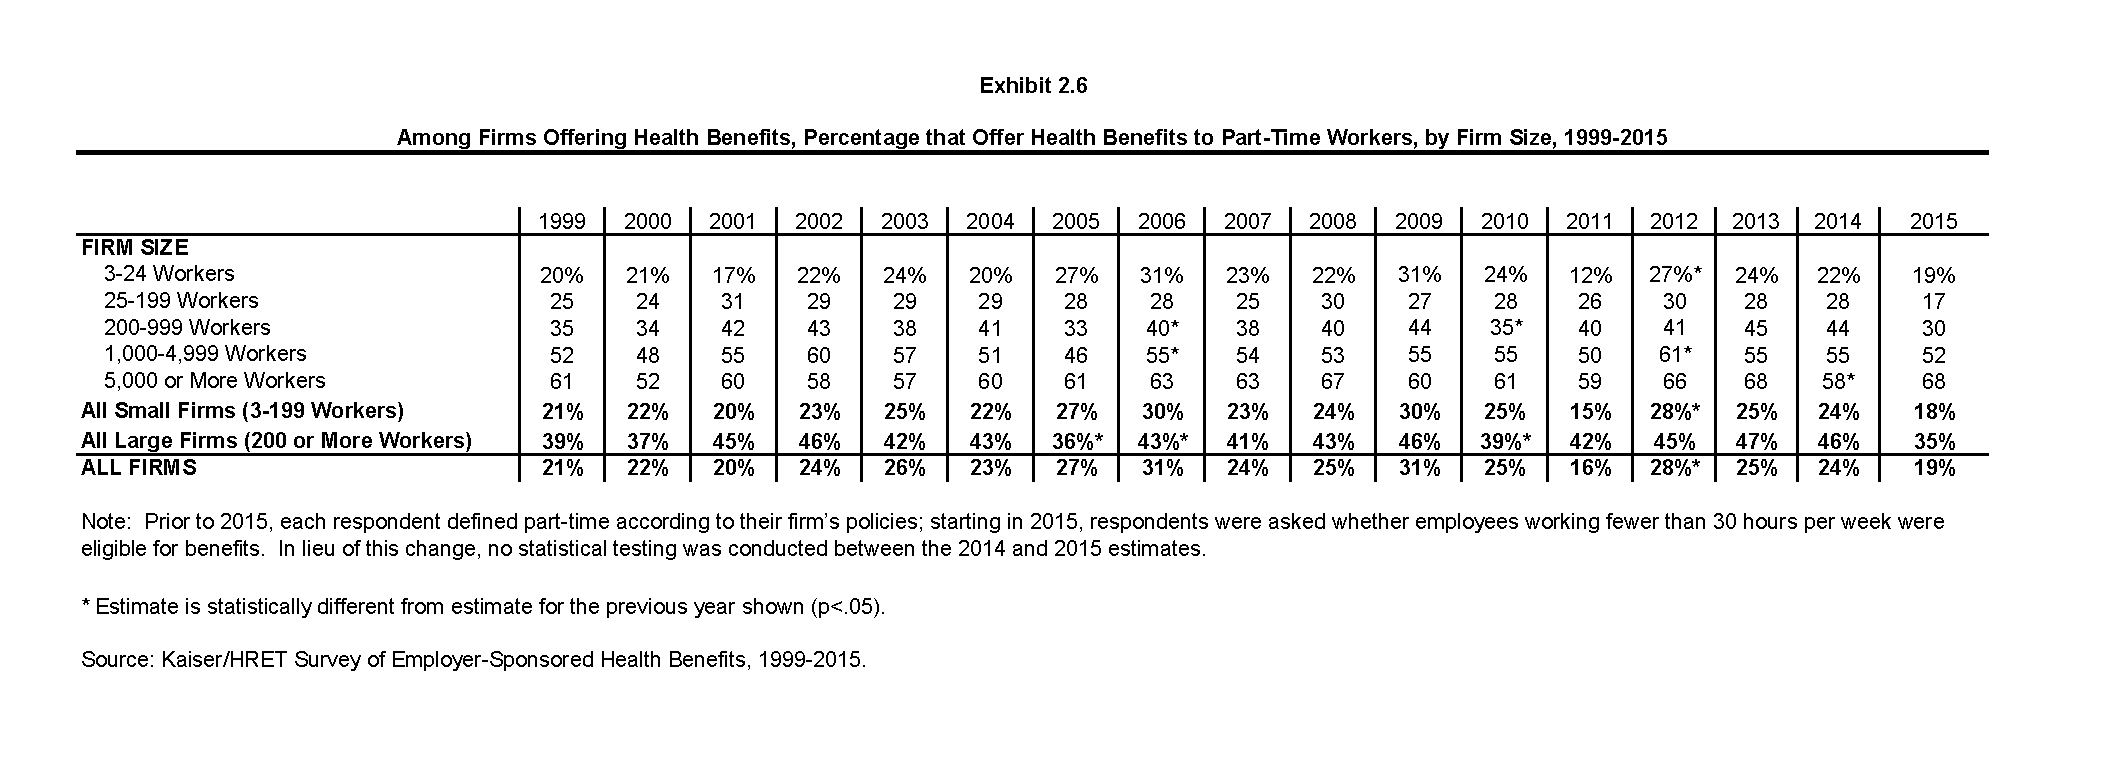
Among Firms Offering Health Benefits, Percentage that Offer Health Benefits to Part-Time Workers, by Firm Size, 1999-2015
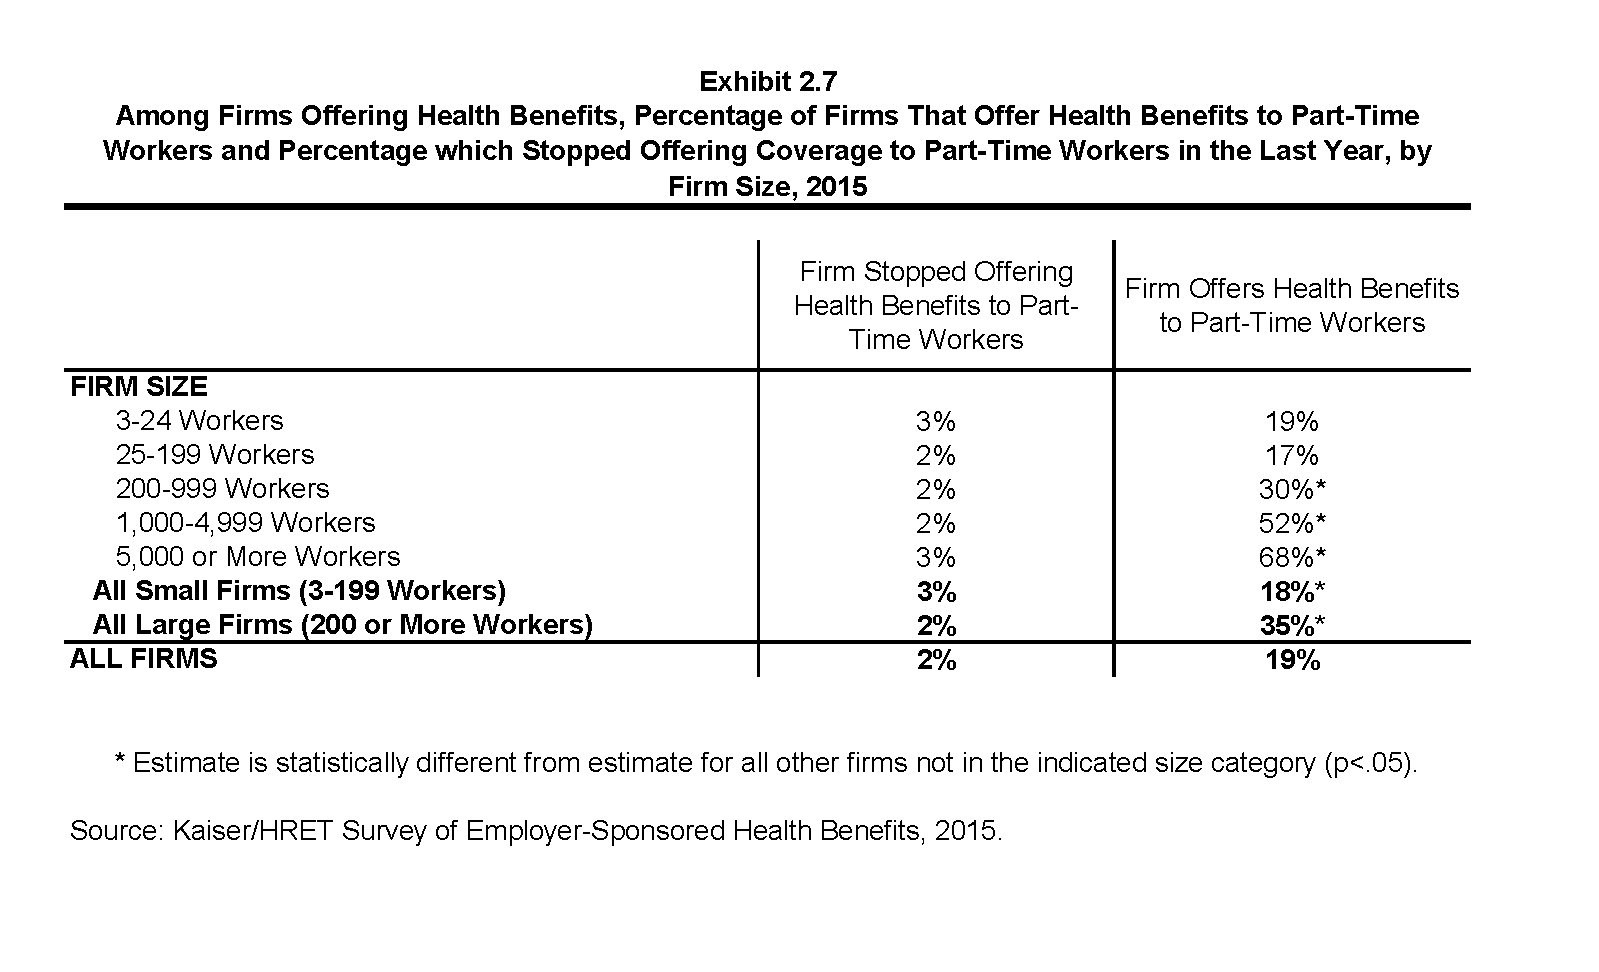
Among Firms Offering Health Benefits, Percentage of Firms That Offer Health Benefits to Part-Time Workers and Percentage which Stopped Offering Coverage to Part-Time Workers in the Last Year, by Firm Size, 2015
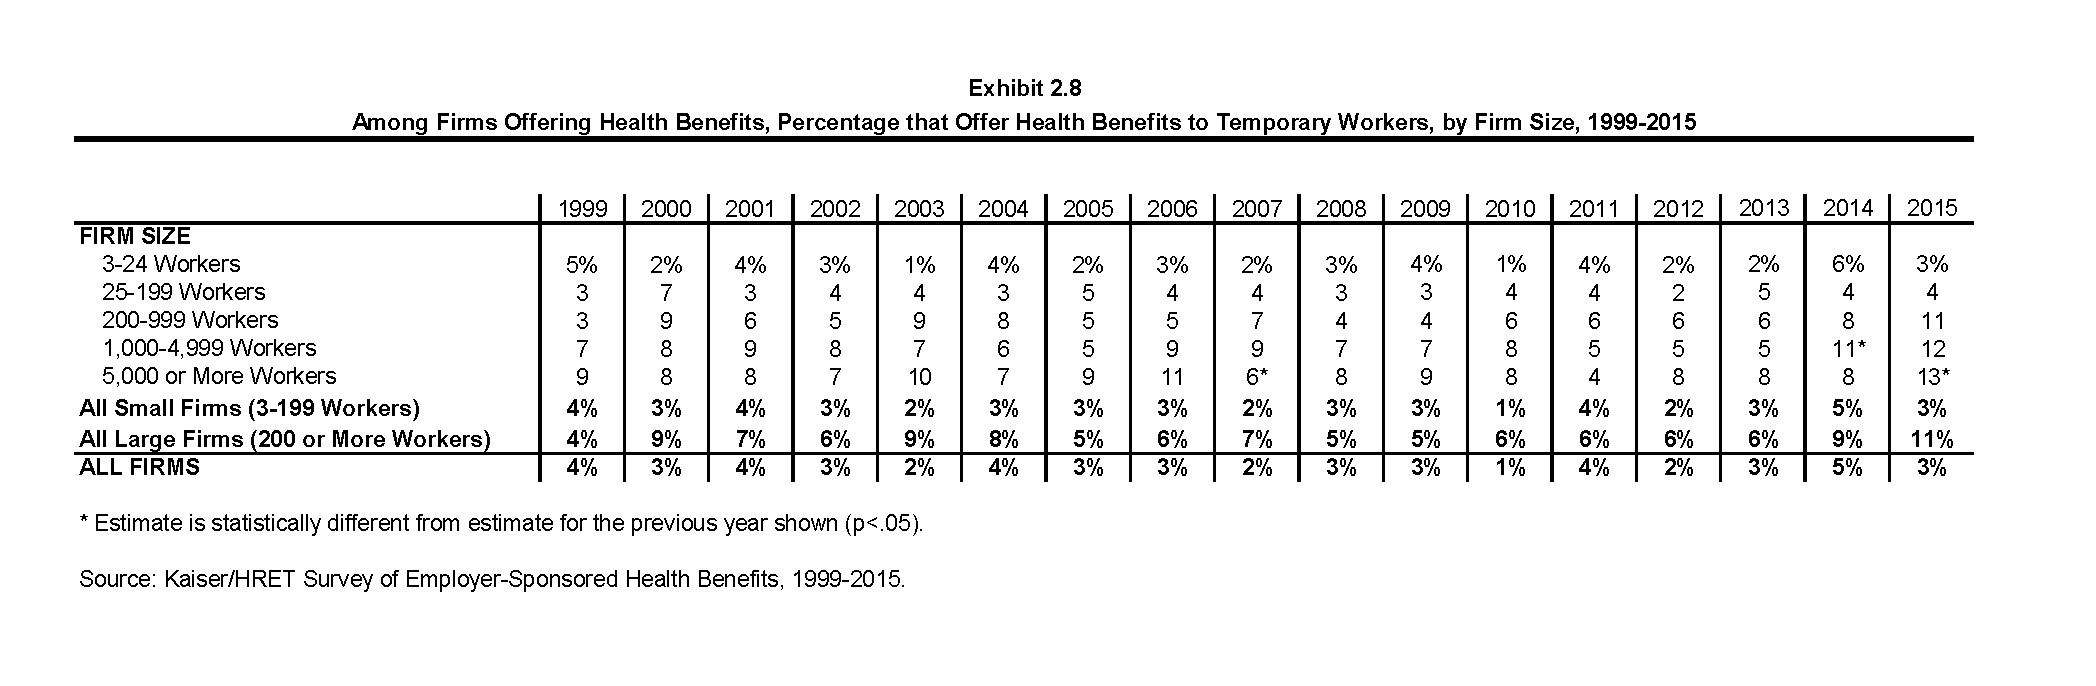
Among Firms Offering Health Benefits, Percentage that Offer Health Benefits to Temporary Workers, by Firm Size, 1999-2015
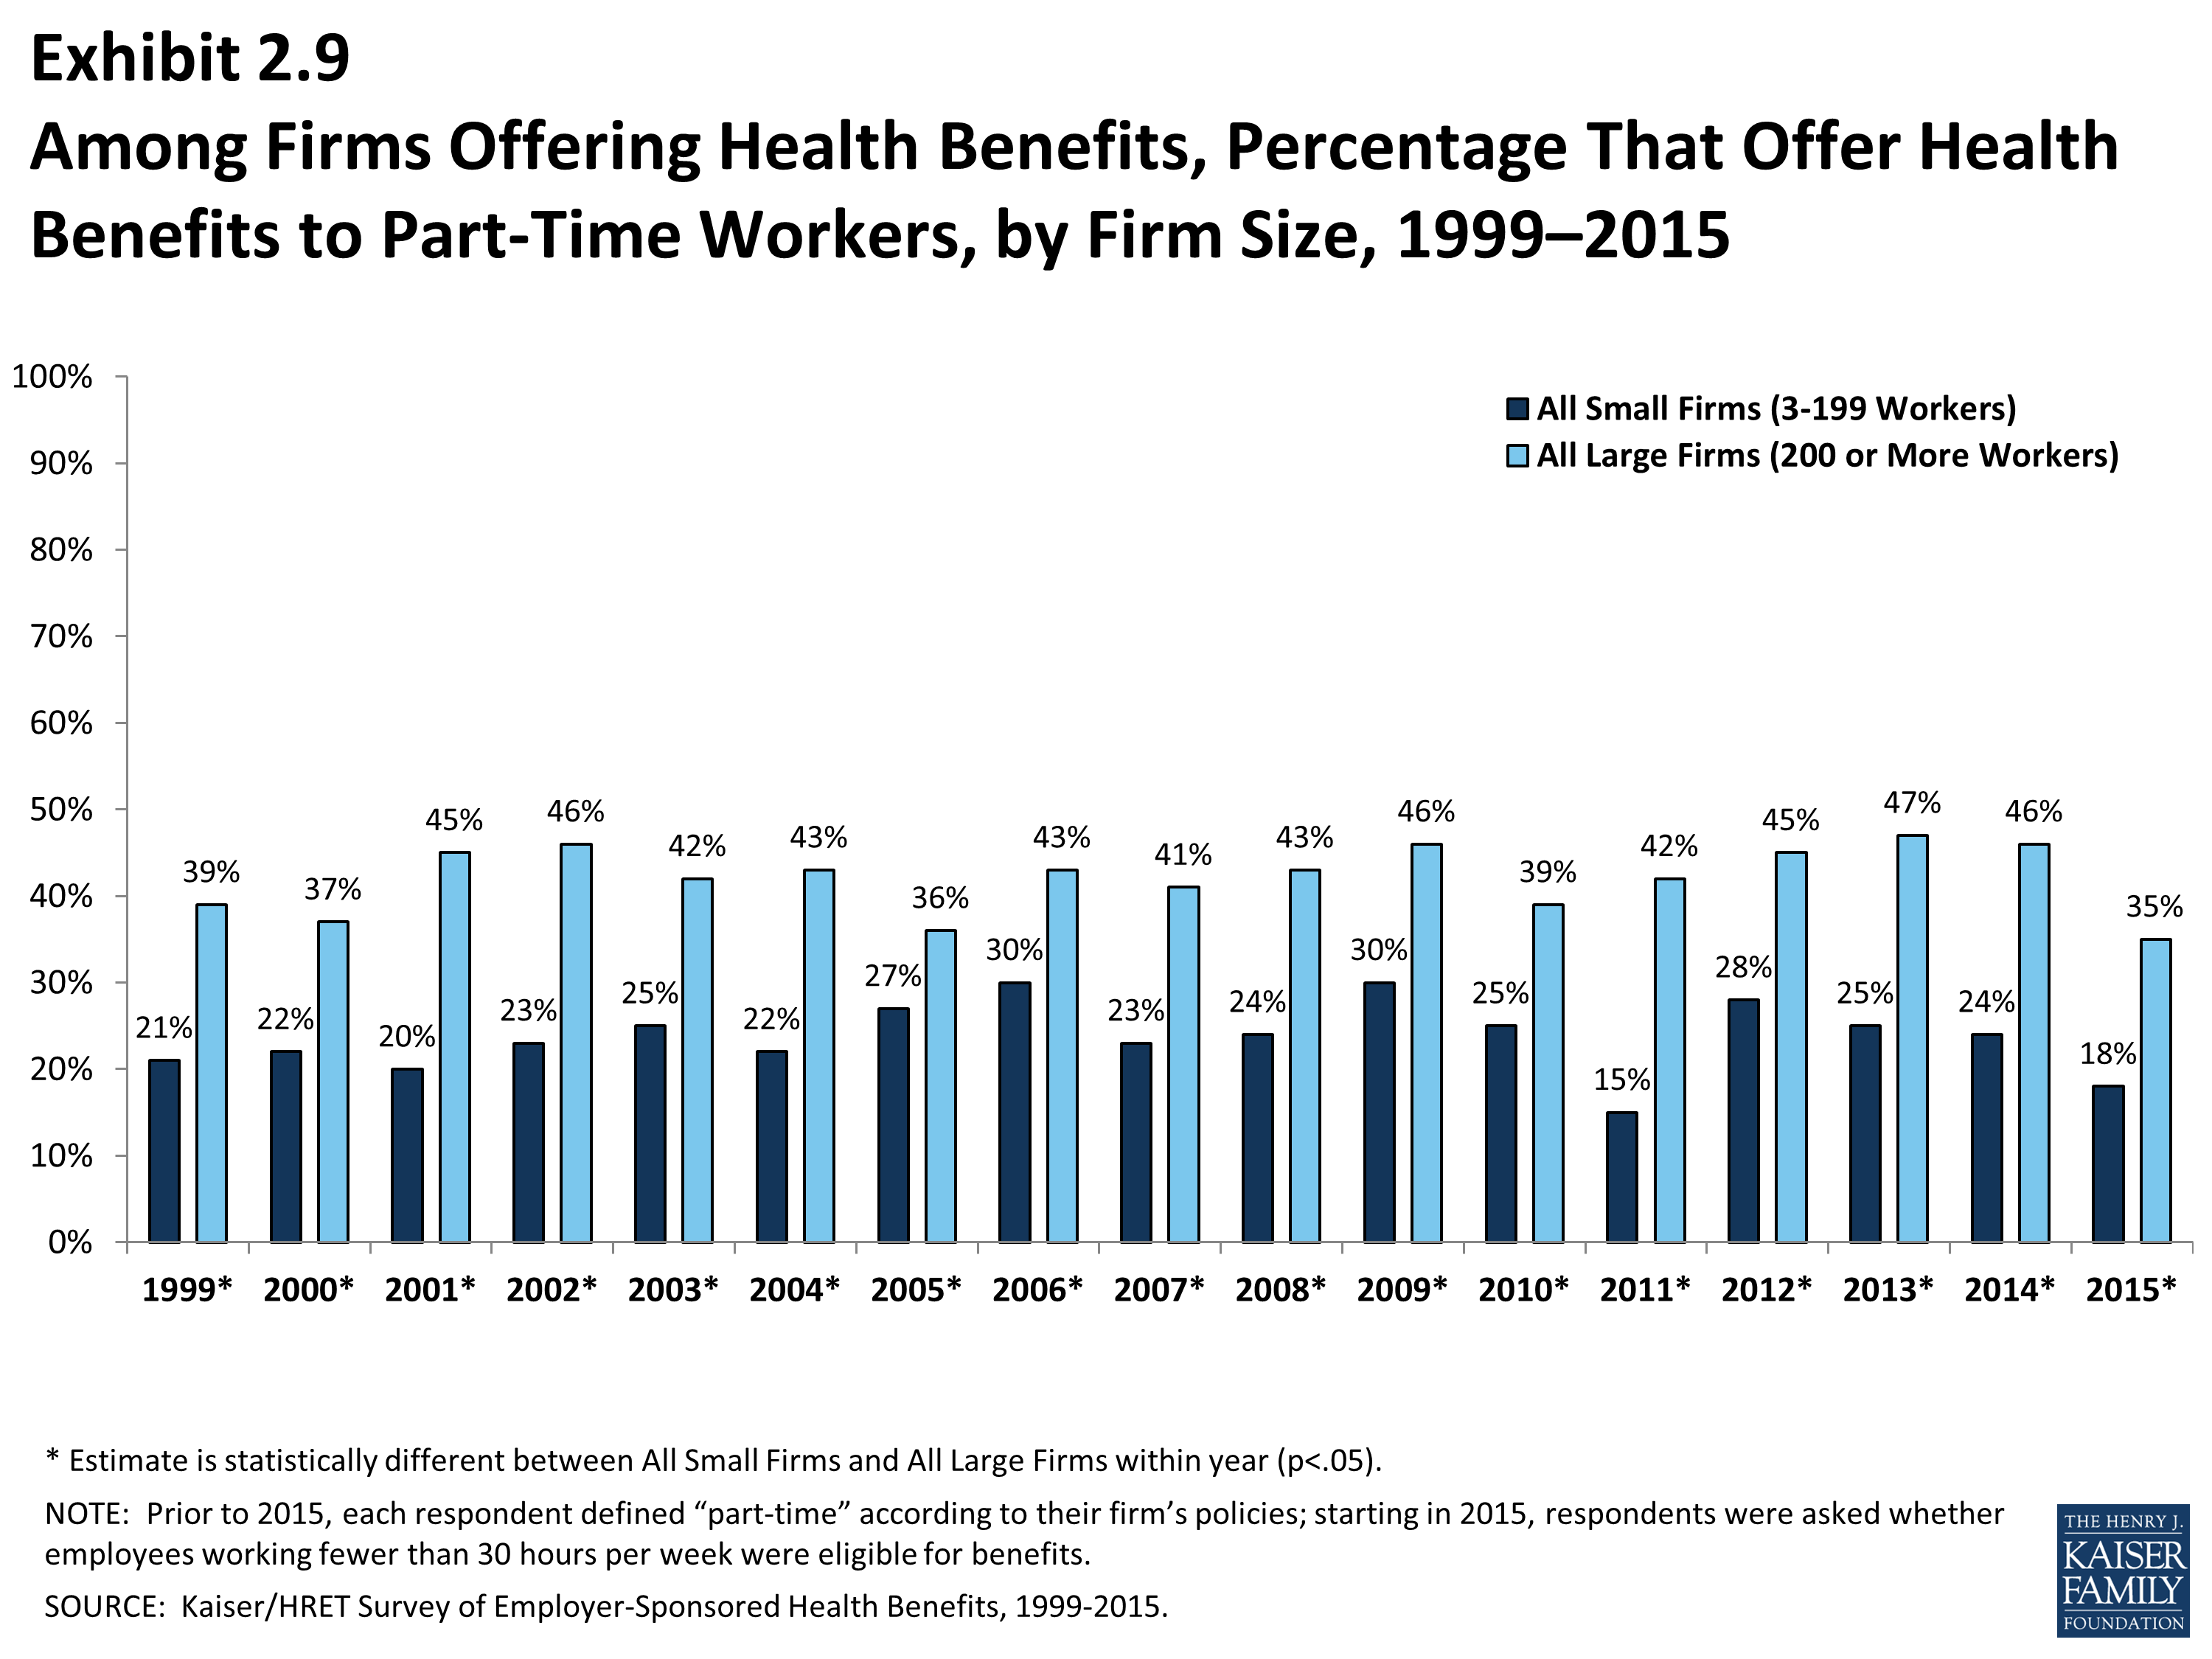
Among Firms Offering Health Benefits, Percentage That Offer Health Benefits to Part-Time Workers, by Firm Size, 1999–2015
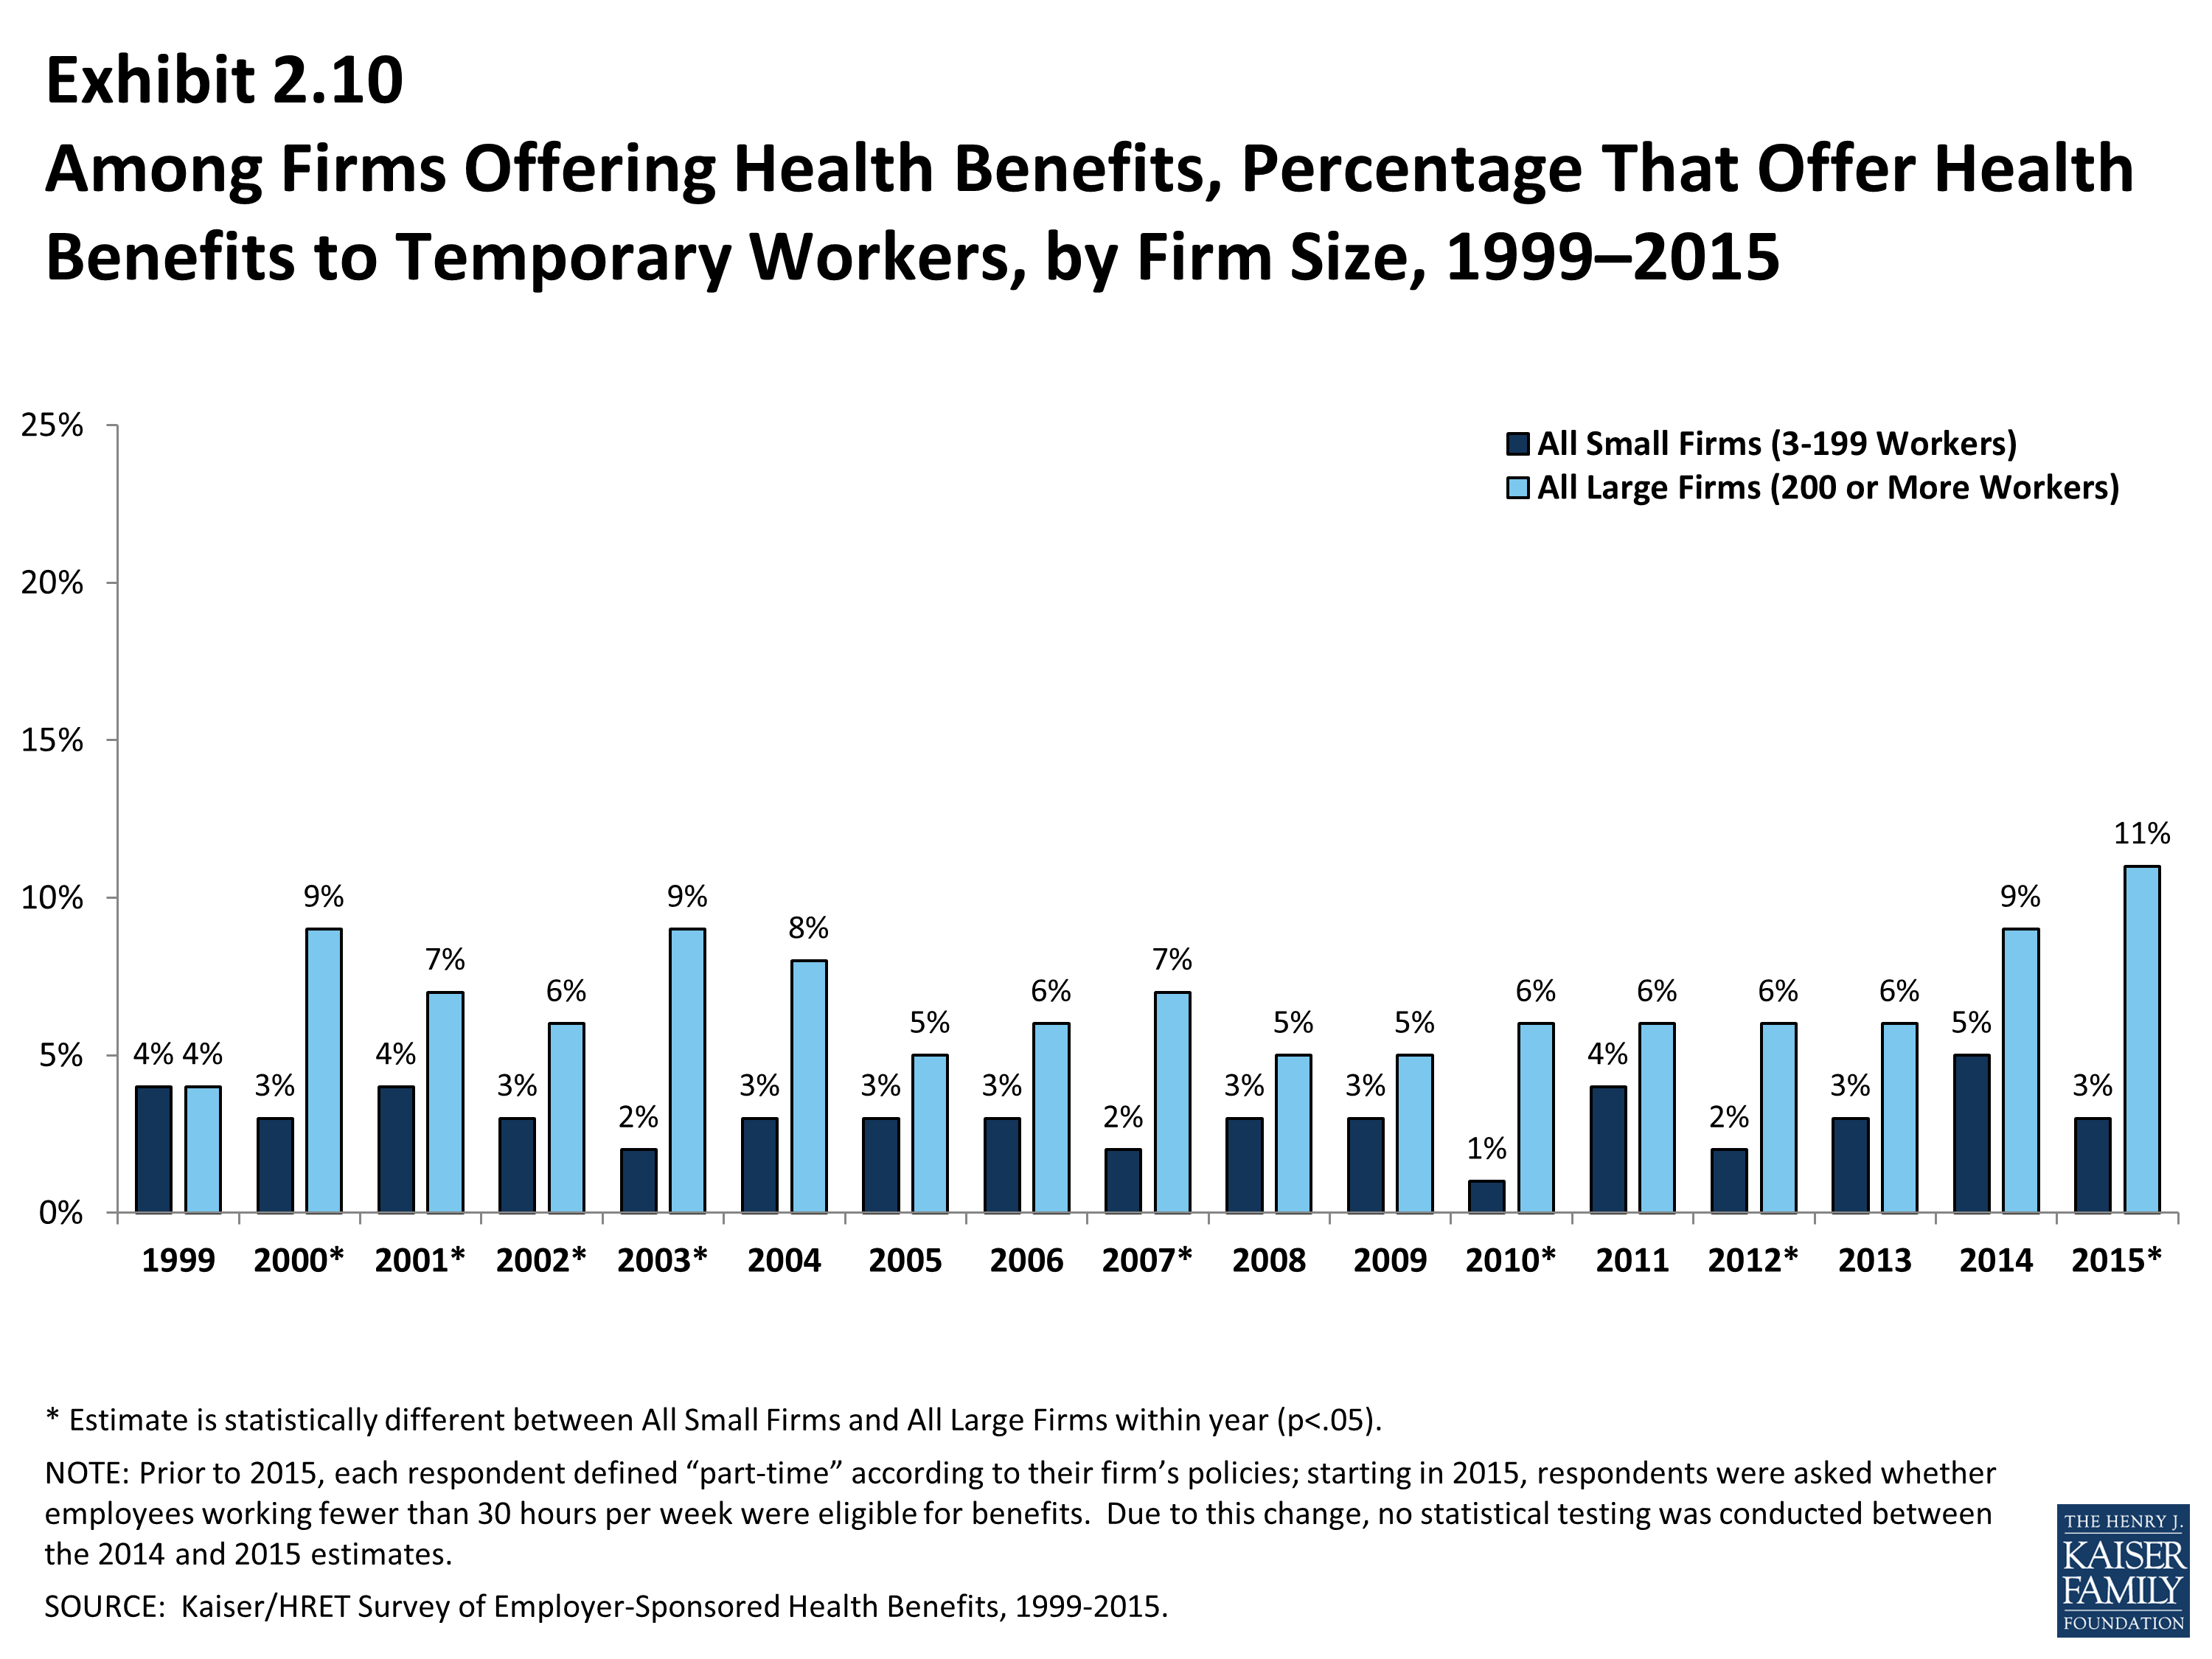
Among Firms Offering Health Benefits, Percentage That Offer Health Benefits to Temporary Workers, by Firm Size, 1999–2015
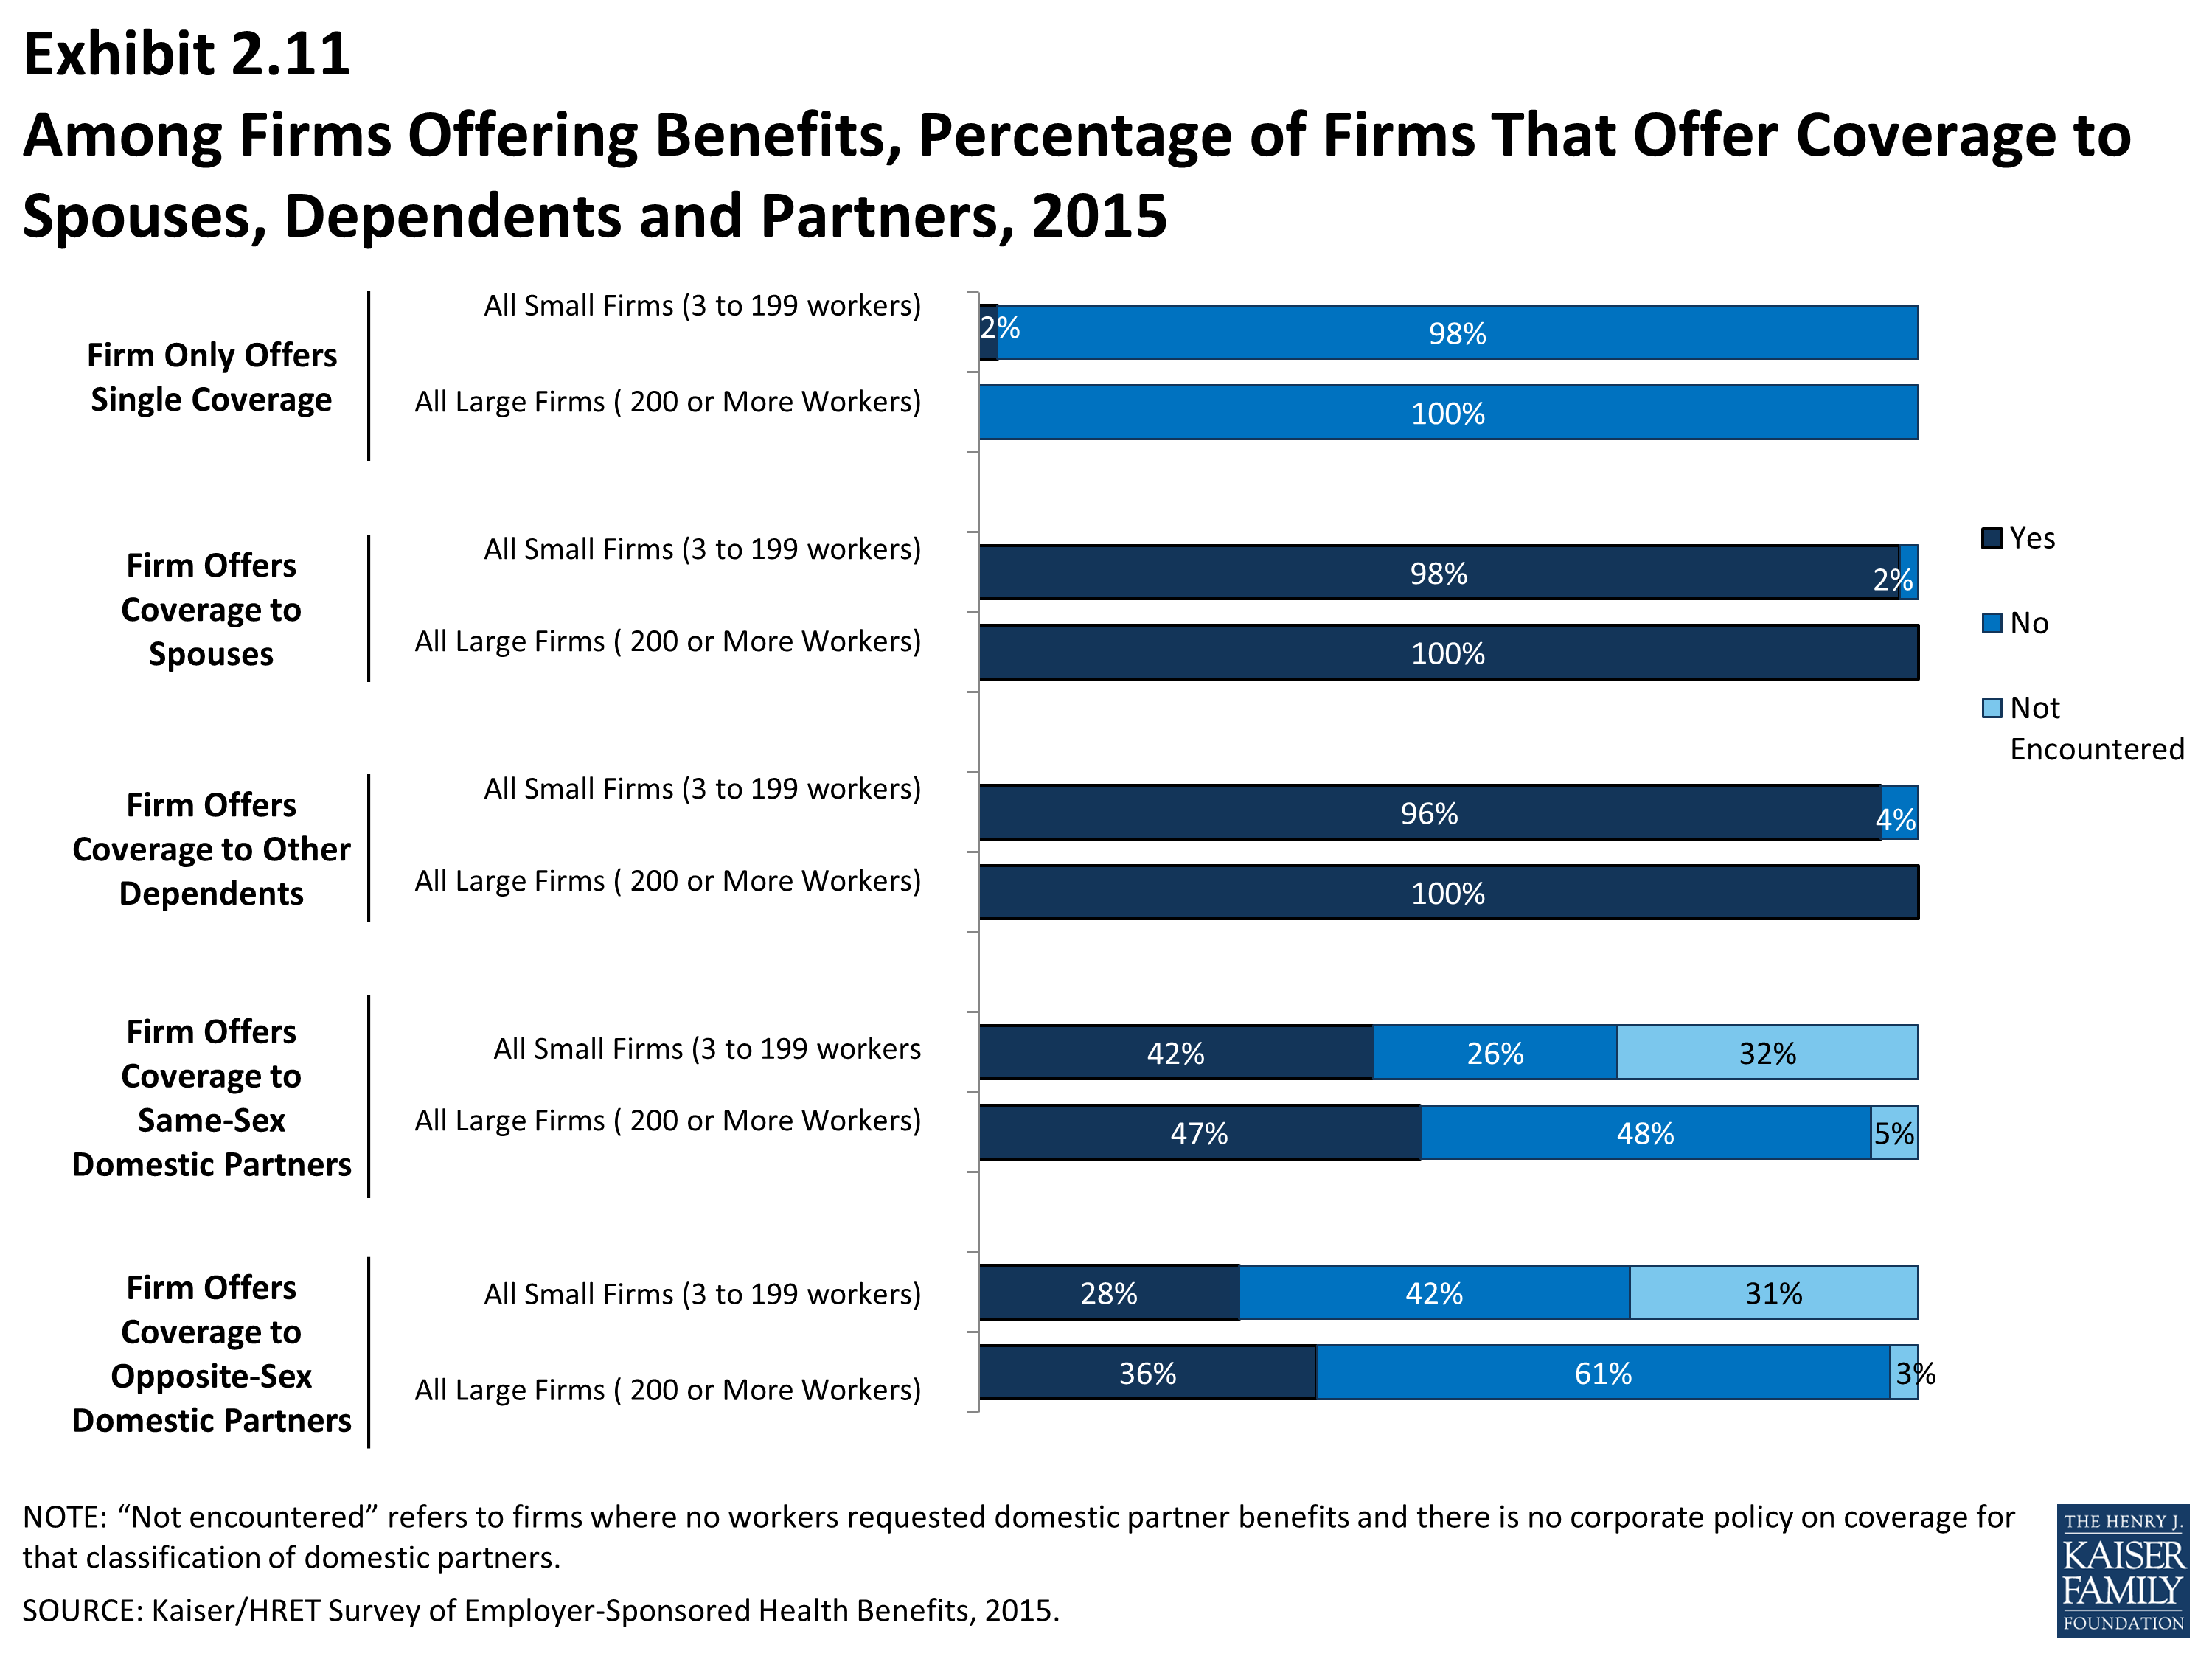
Among Firms Offering Benefits, Percentage of Firms Which Offer Coverage to Spouses, Dependents and Partners, 2015
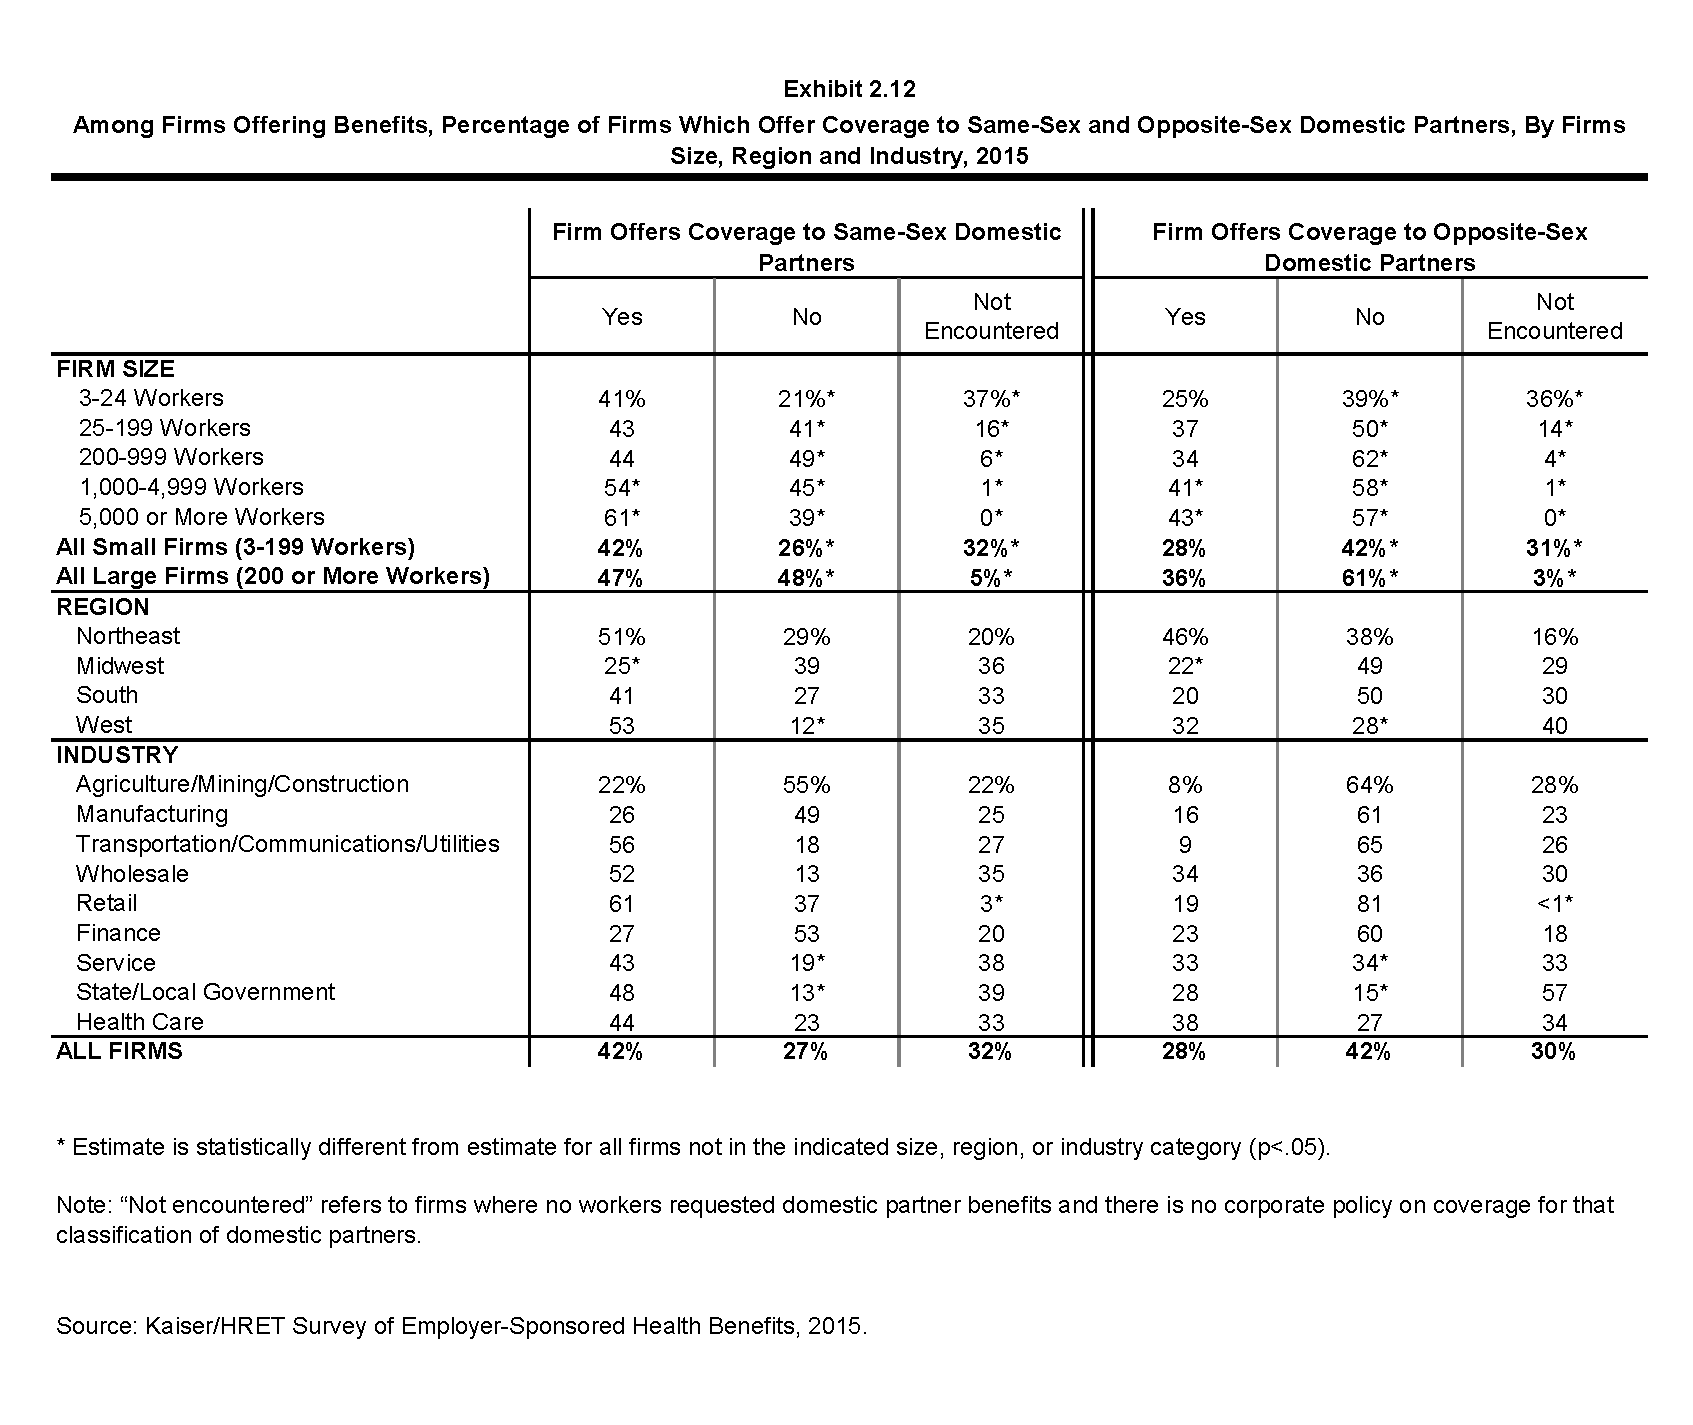
Among Firms Offering Benefits, Percentage of Firms Which Offer Coverage to Same-Sex and Opposite-Sex Domestic Partners, By Firms Size, Region and Industry, 2015
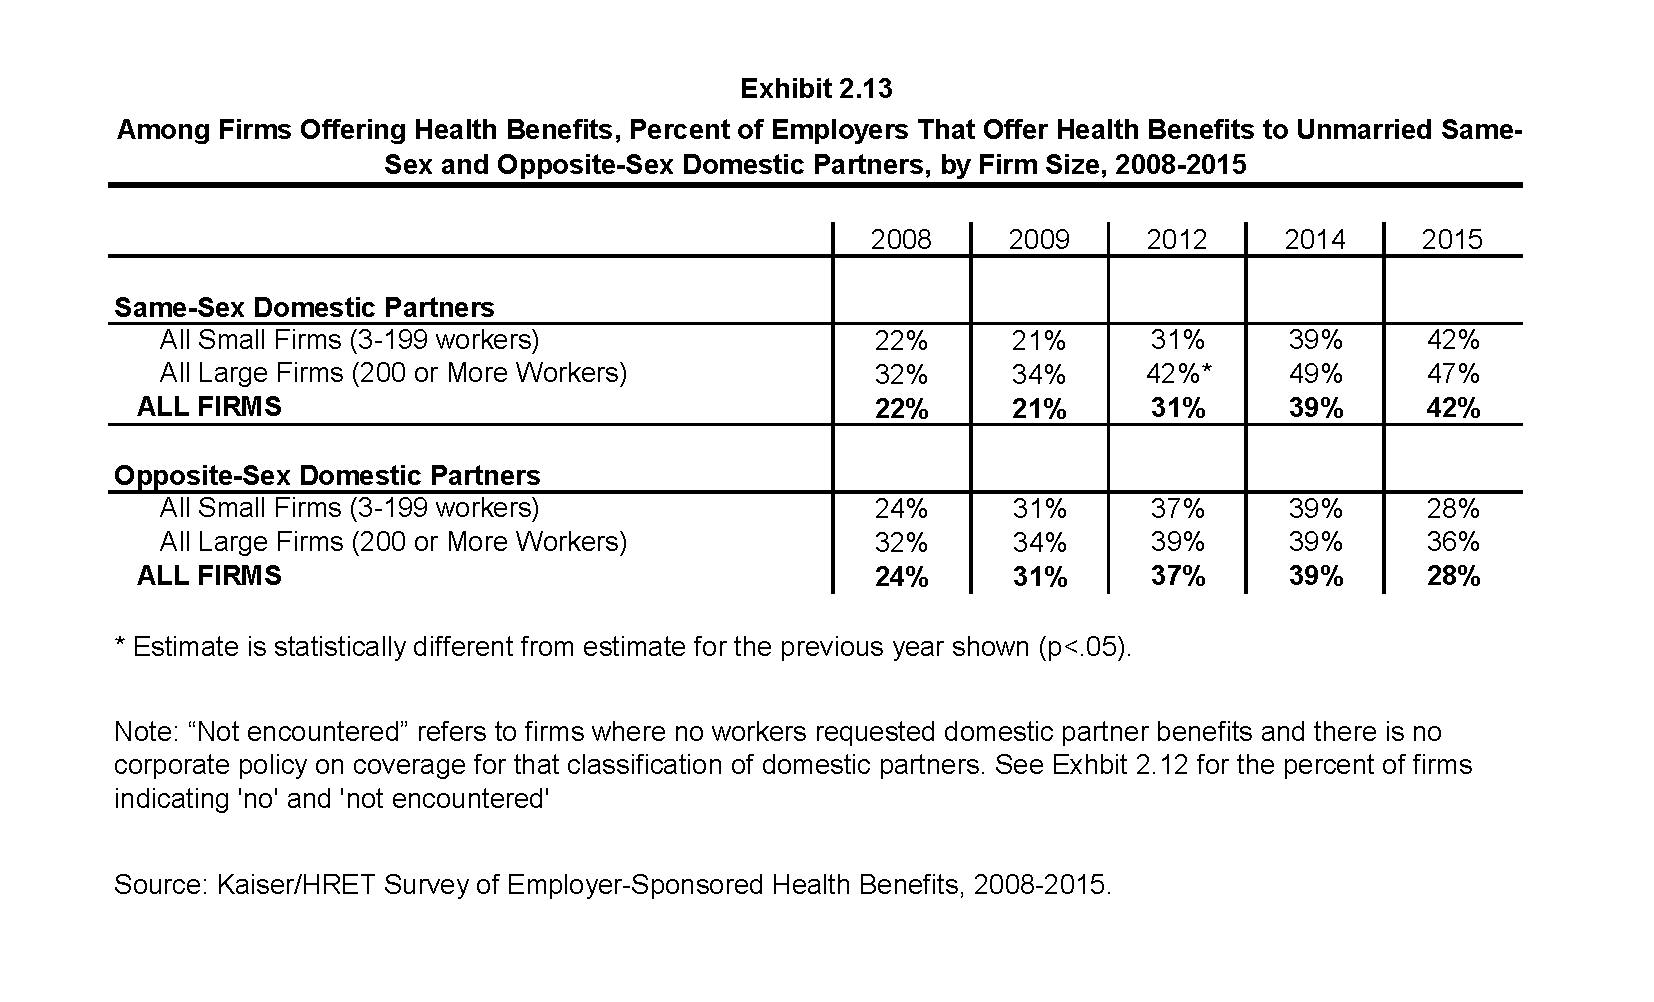
Among Firms Offering Health Benefits, Percent of Employers That Offer Health Benefits to Unmarried Same-Sex and Opposite-Sex Domestic Partners, by Firm Size, 2008-2015
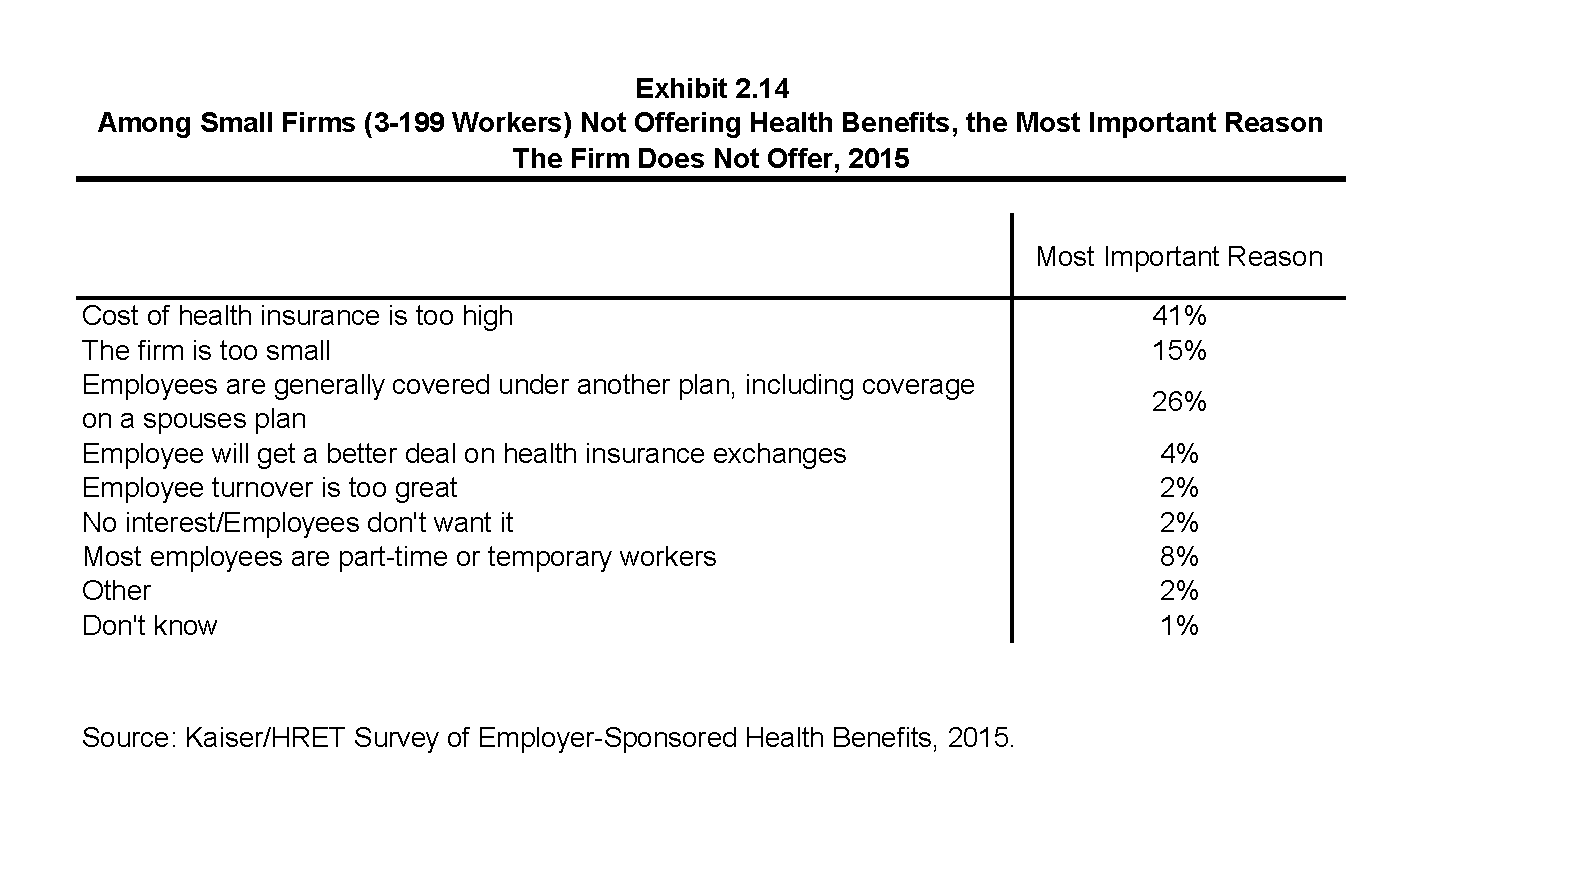
Among Small Firms (3-199 Workers) Not Offering Health Benefits, the Most Important Reason The Firm Does Not Offer, 2015
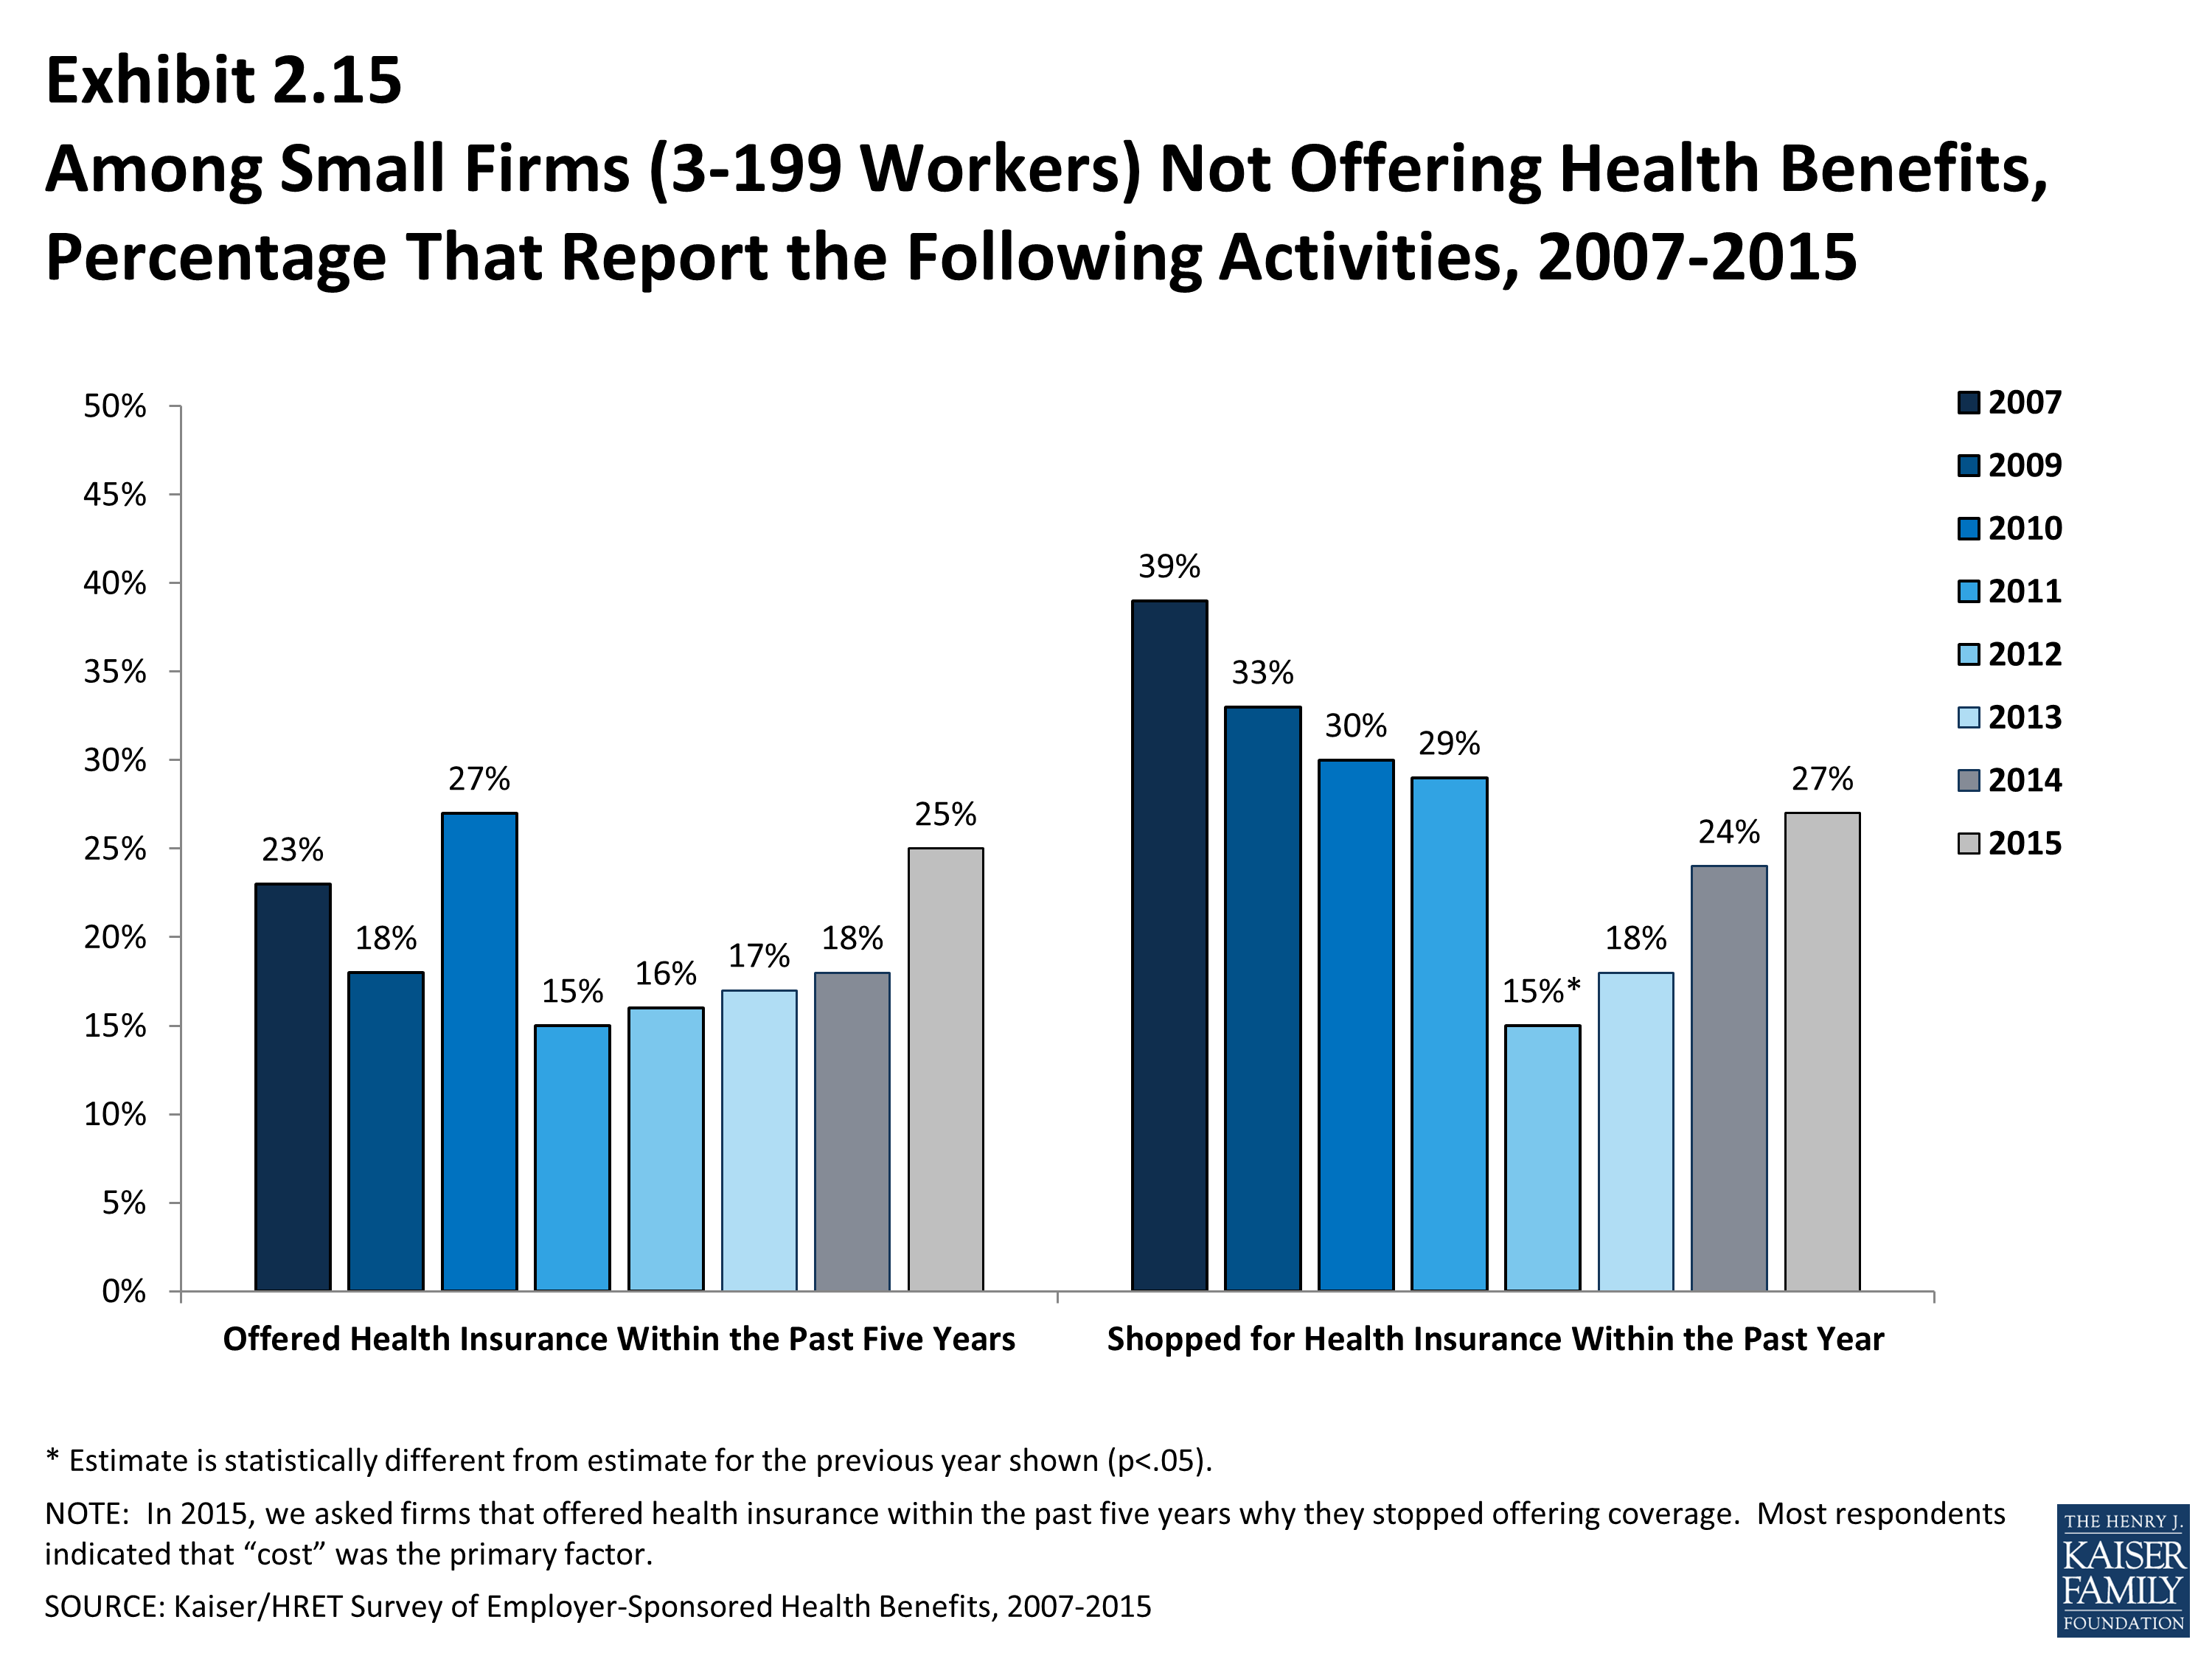
Among Small Firms (3-199 Workers) Not Offering Health Benefits, Percentage That Report the Following Activities, 2007-2015
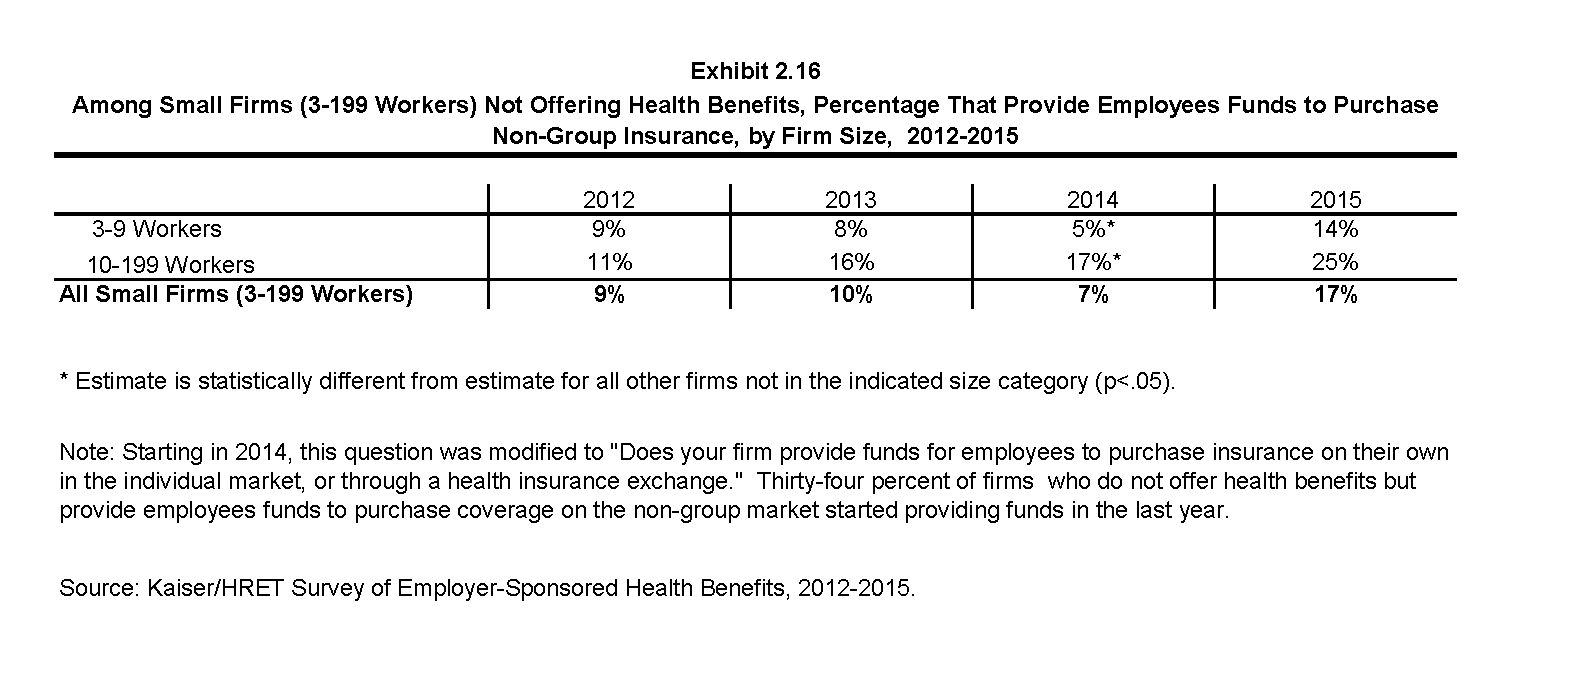
Among Small Firms (3-199 Workers) Not Offering Health Benefits, Percentage That Provide Employees Funds to Purchase Non-Group Insurance, by Firm Size, 2012-2015
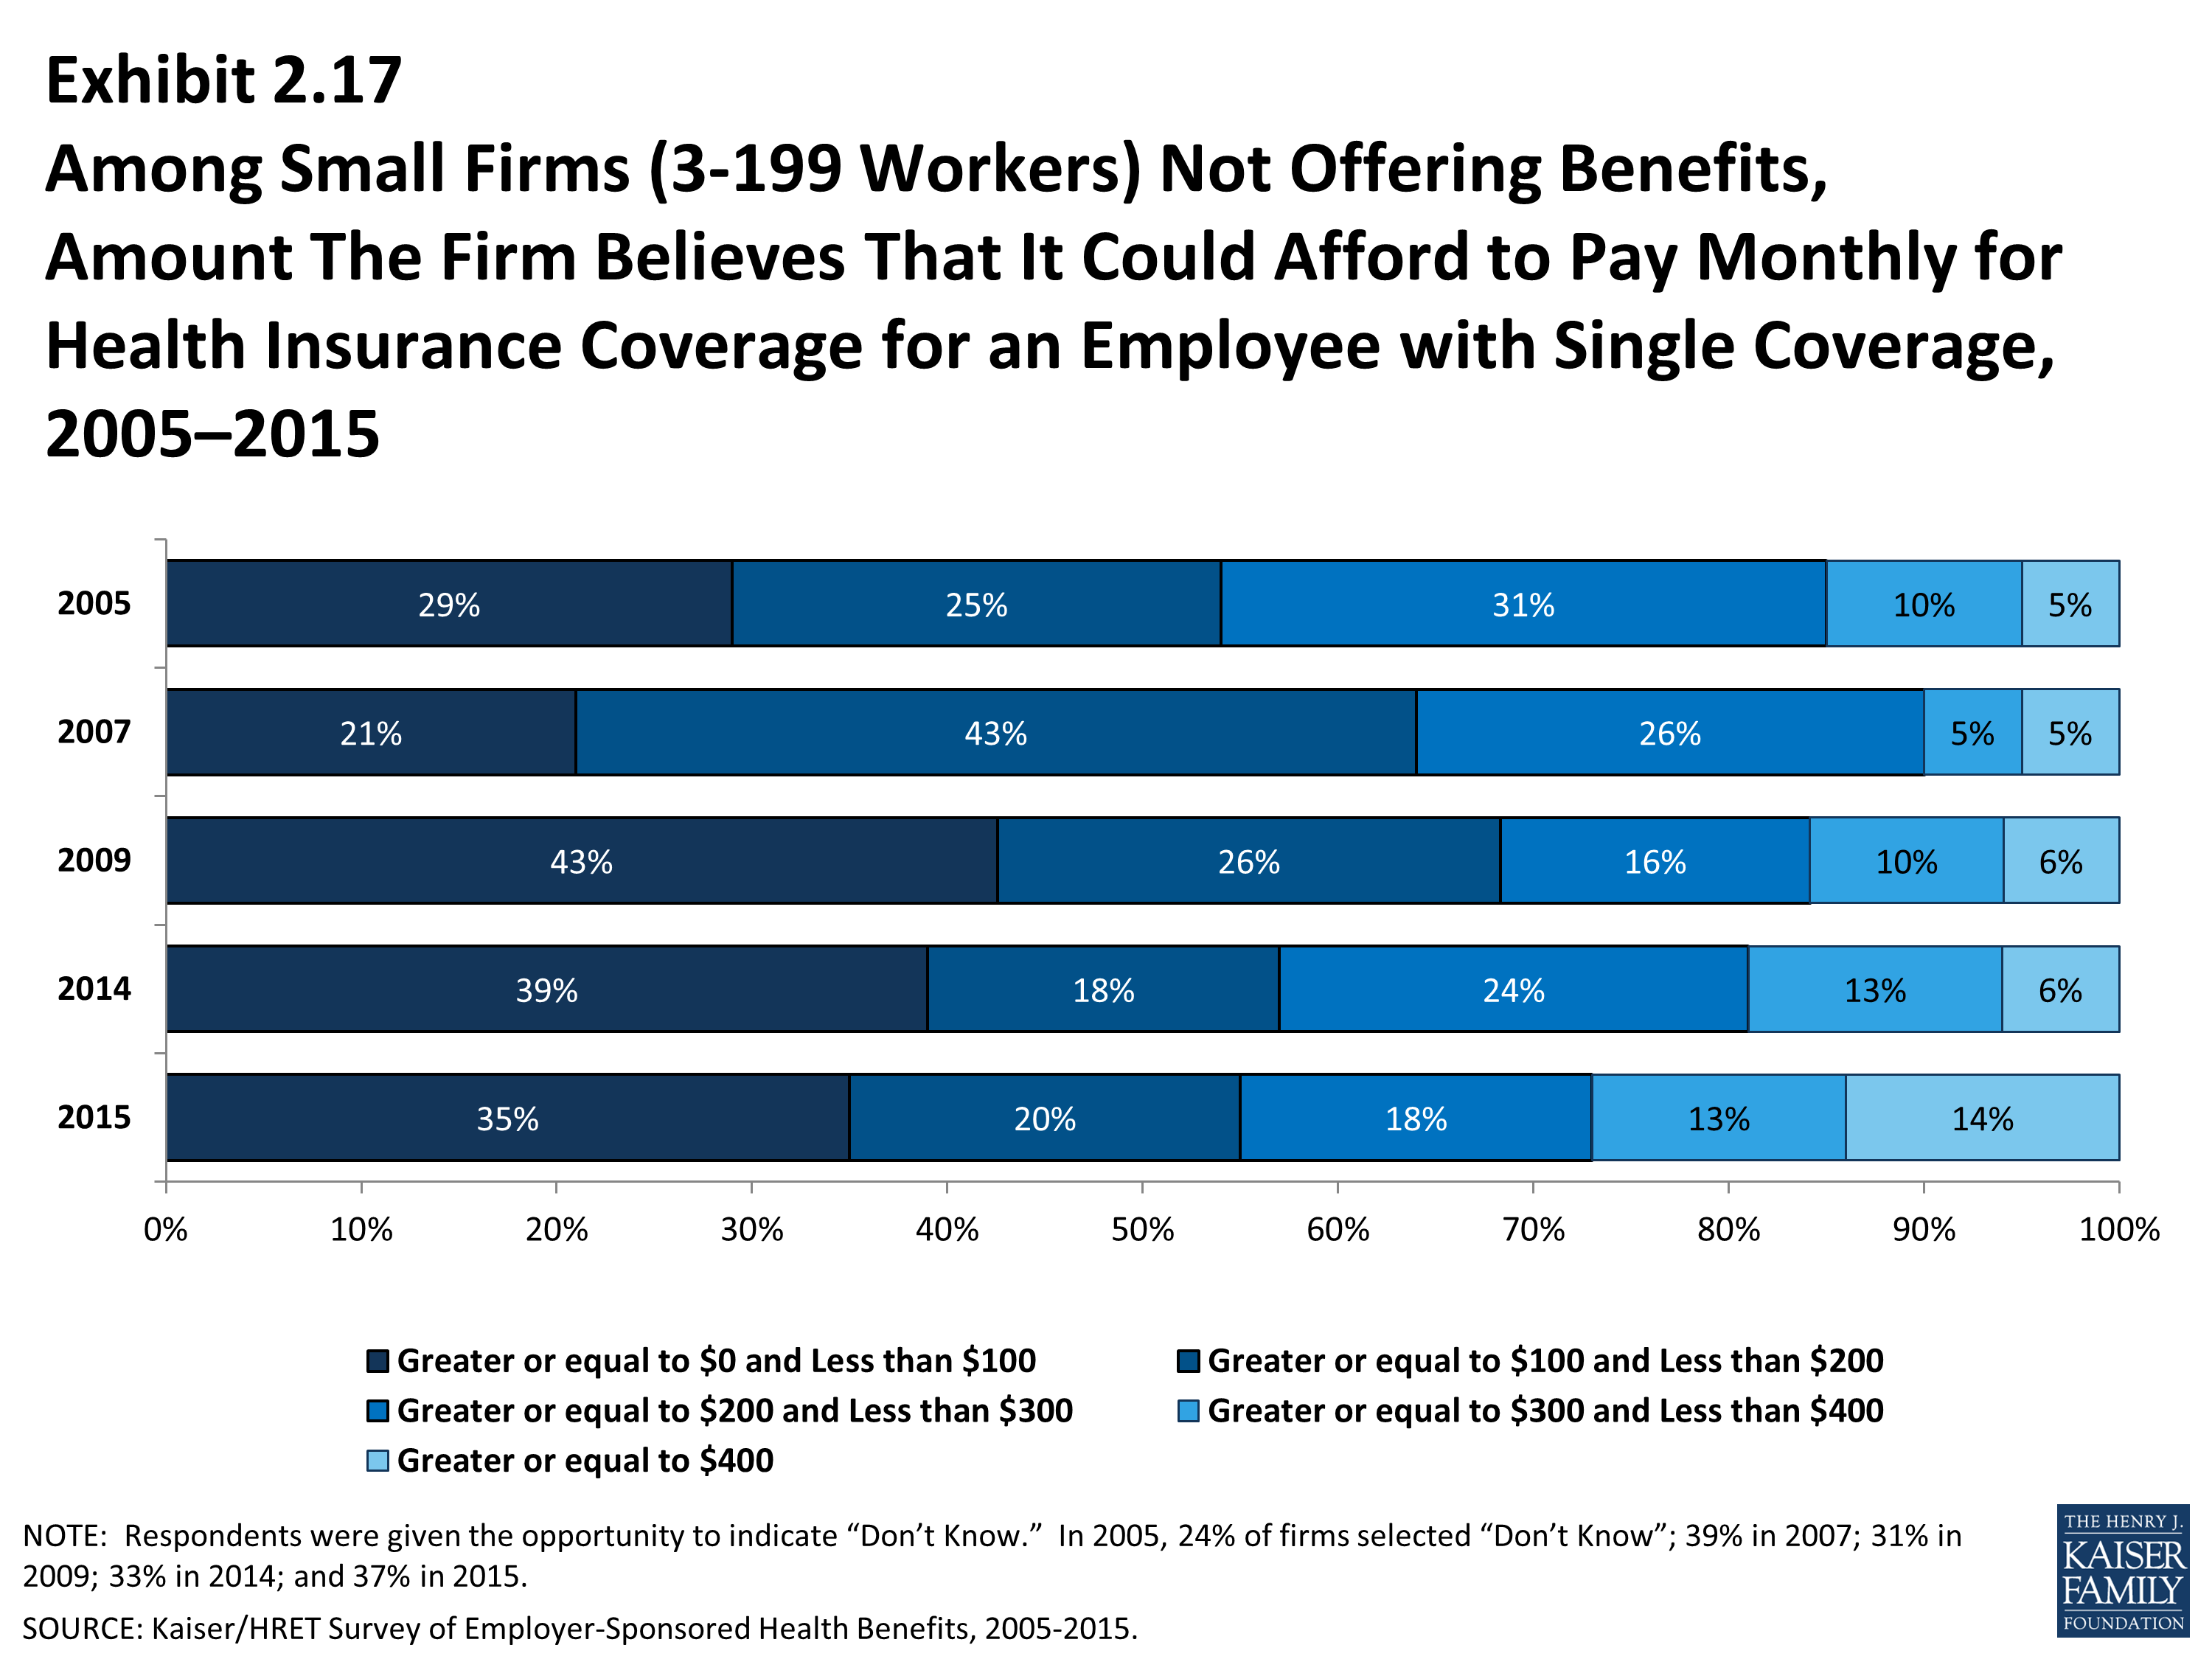
Among Small Firms (3-199 Workers) Not Offering Benefits, Amount The Firm Believes That It Could Afford to Pay Monthly for Health Insurance Coverage for an Employee with Single Coverage, 2005–2015
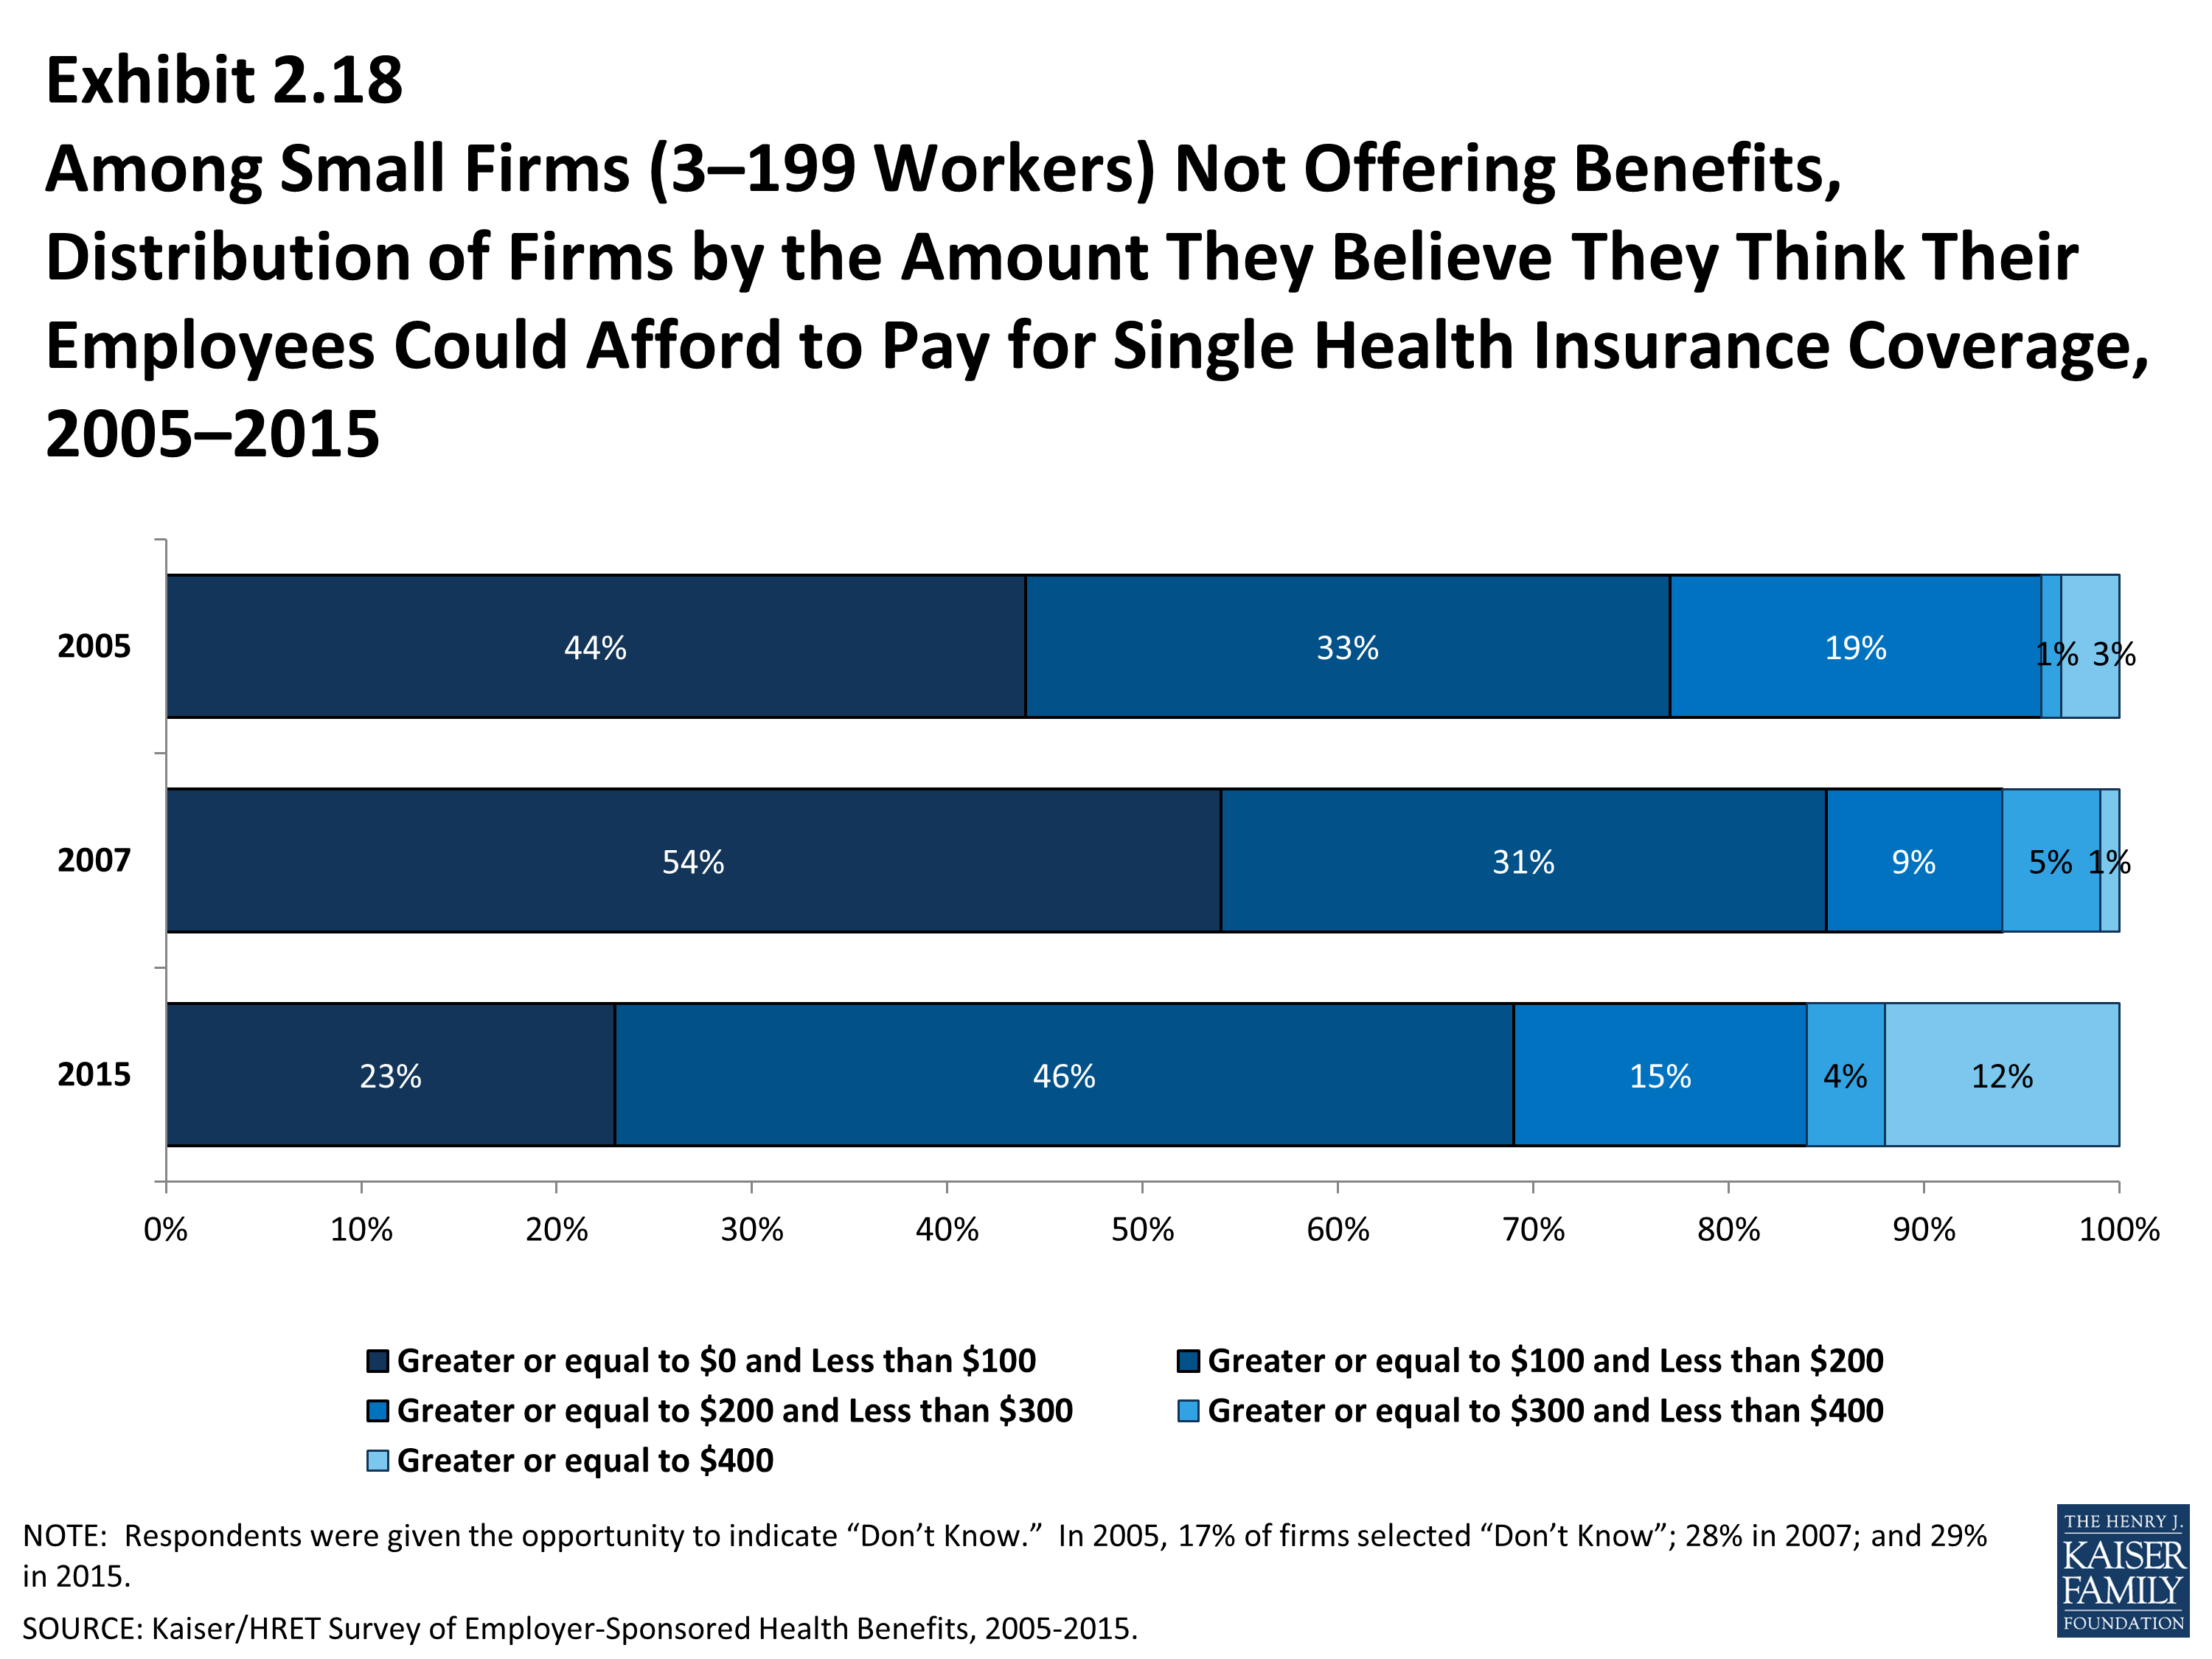
Among Small Firms (3–199 Workers) Not Offering Benefits, Distribution of Firms by the Amount They Believe They Think Their Employees Could Afford to Pay for Single Health Insurance Coverage, 2005–2015
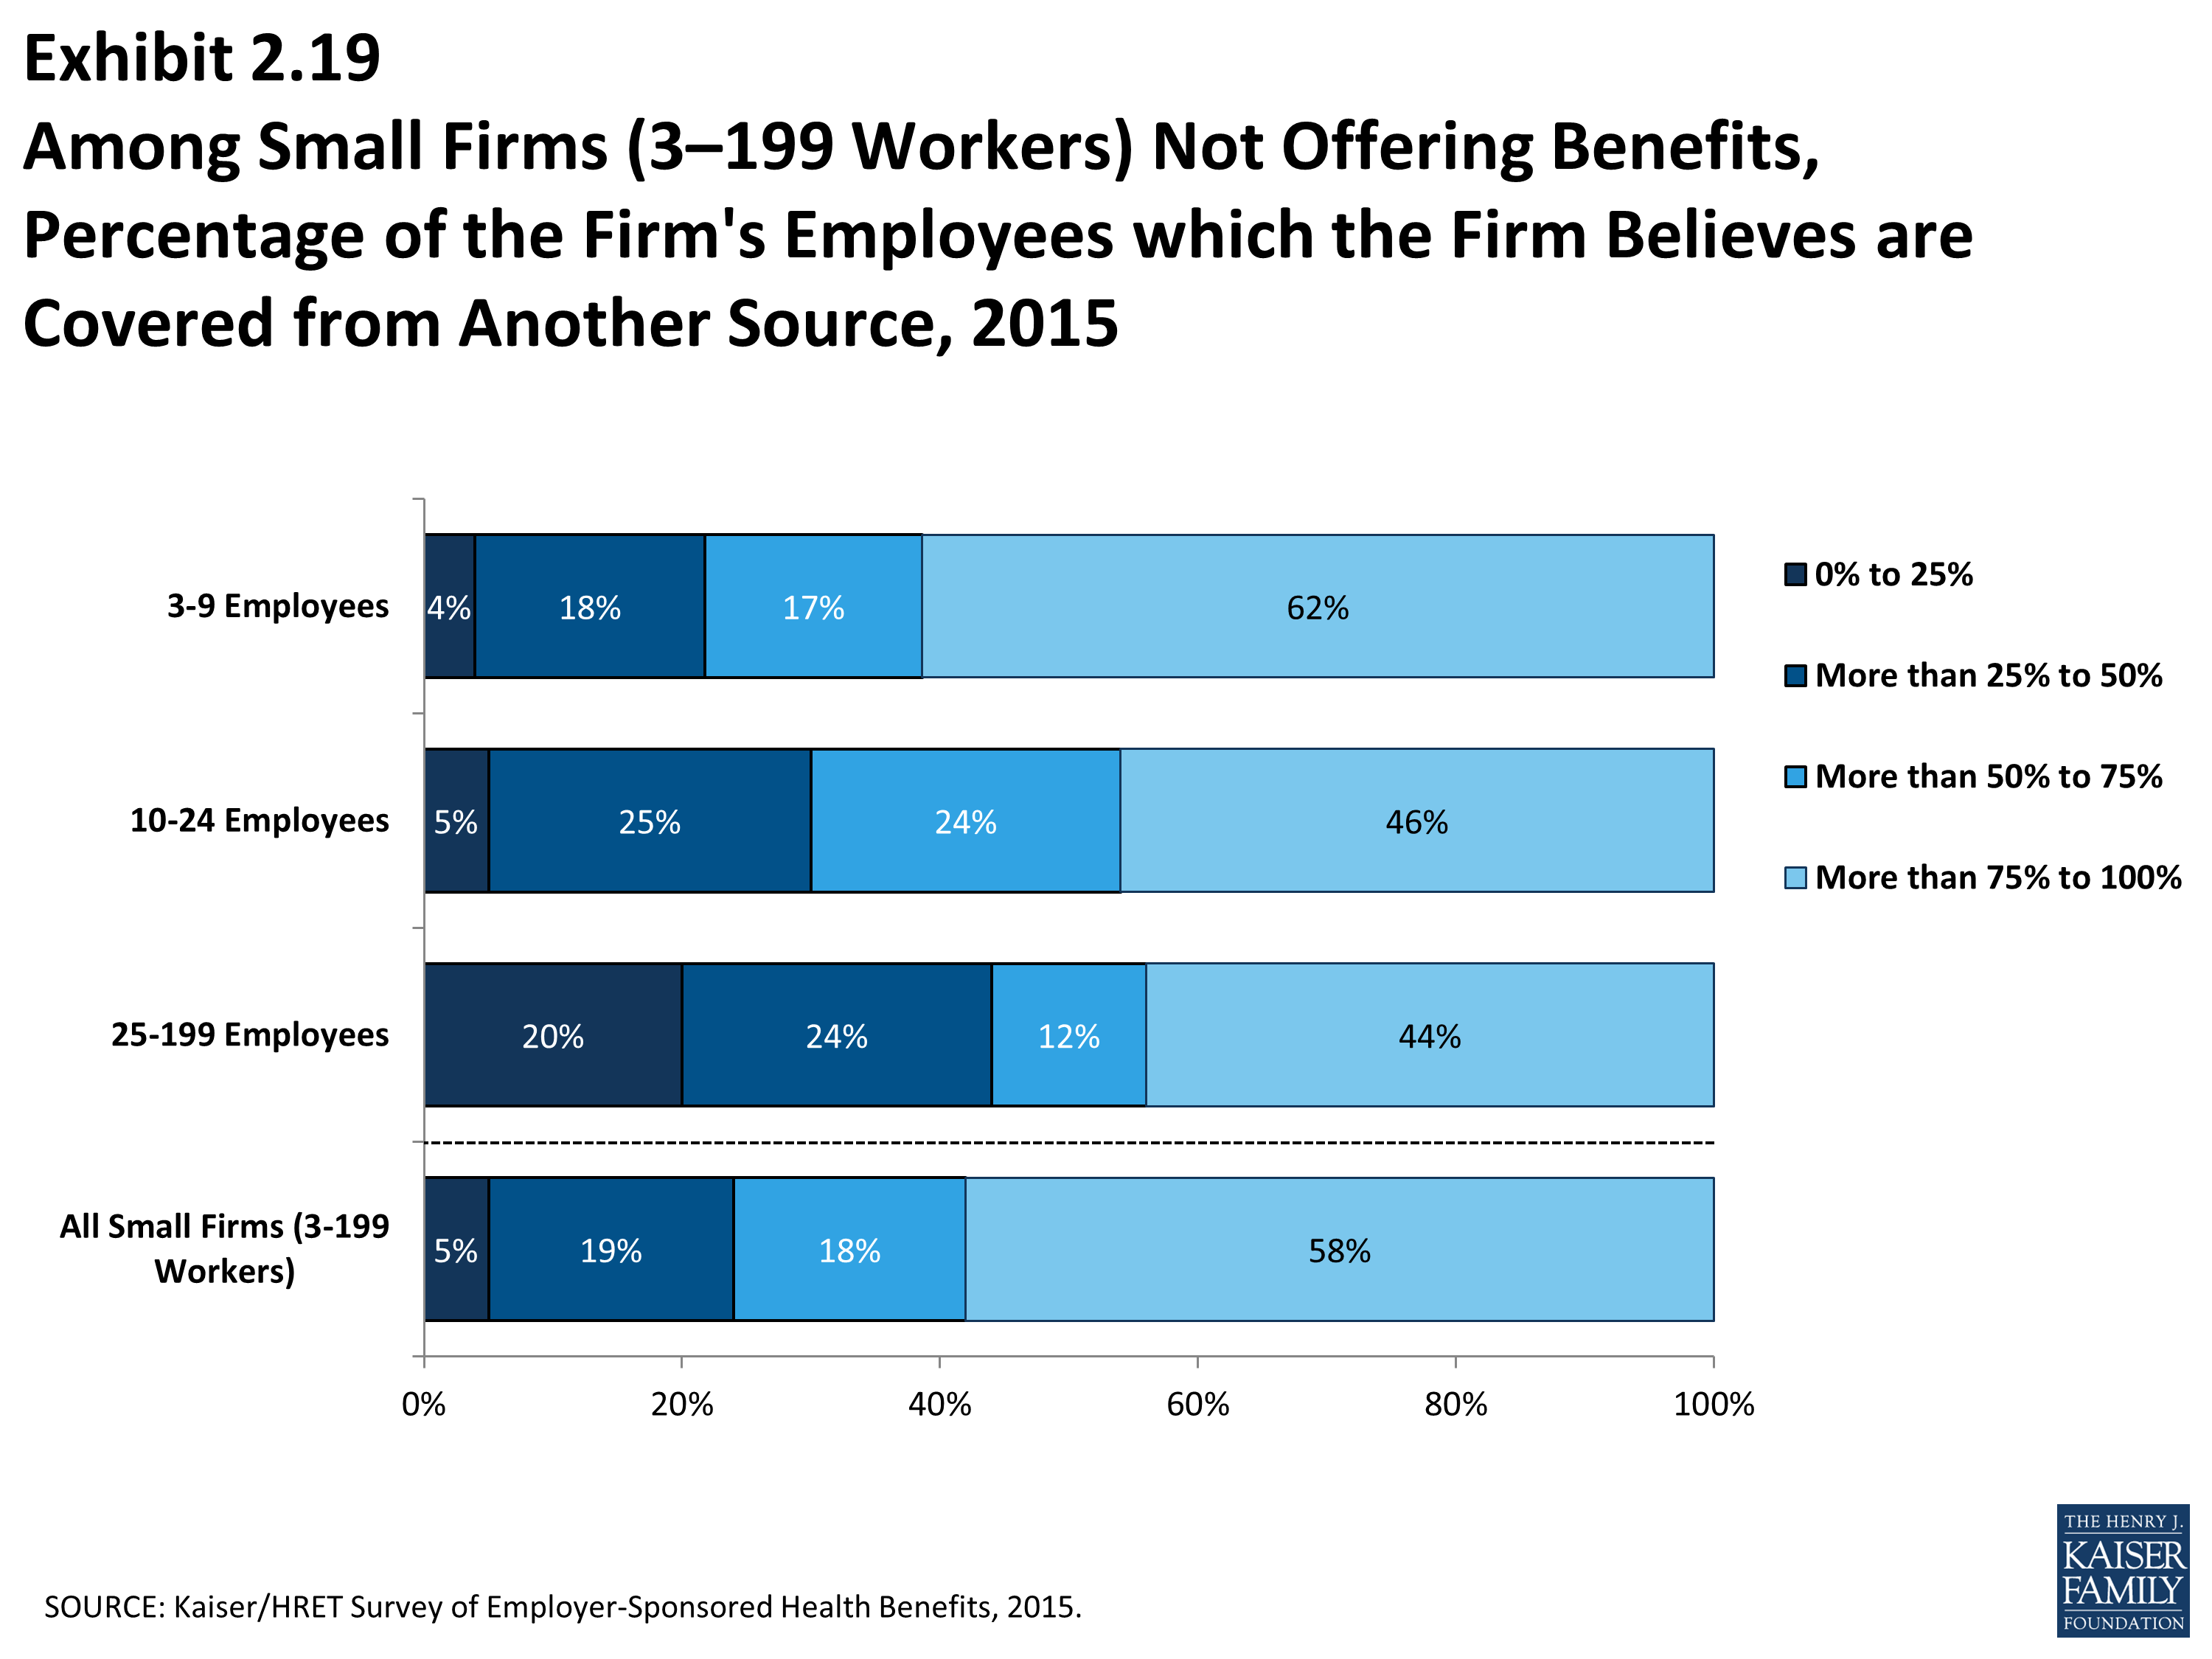
Among Small Firms (3–199 Workers) Not Offering Benefits, Percentage of the Firm's Employees which the Firm Believes are Covered from Another Source, 2015
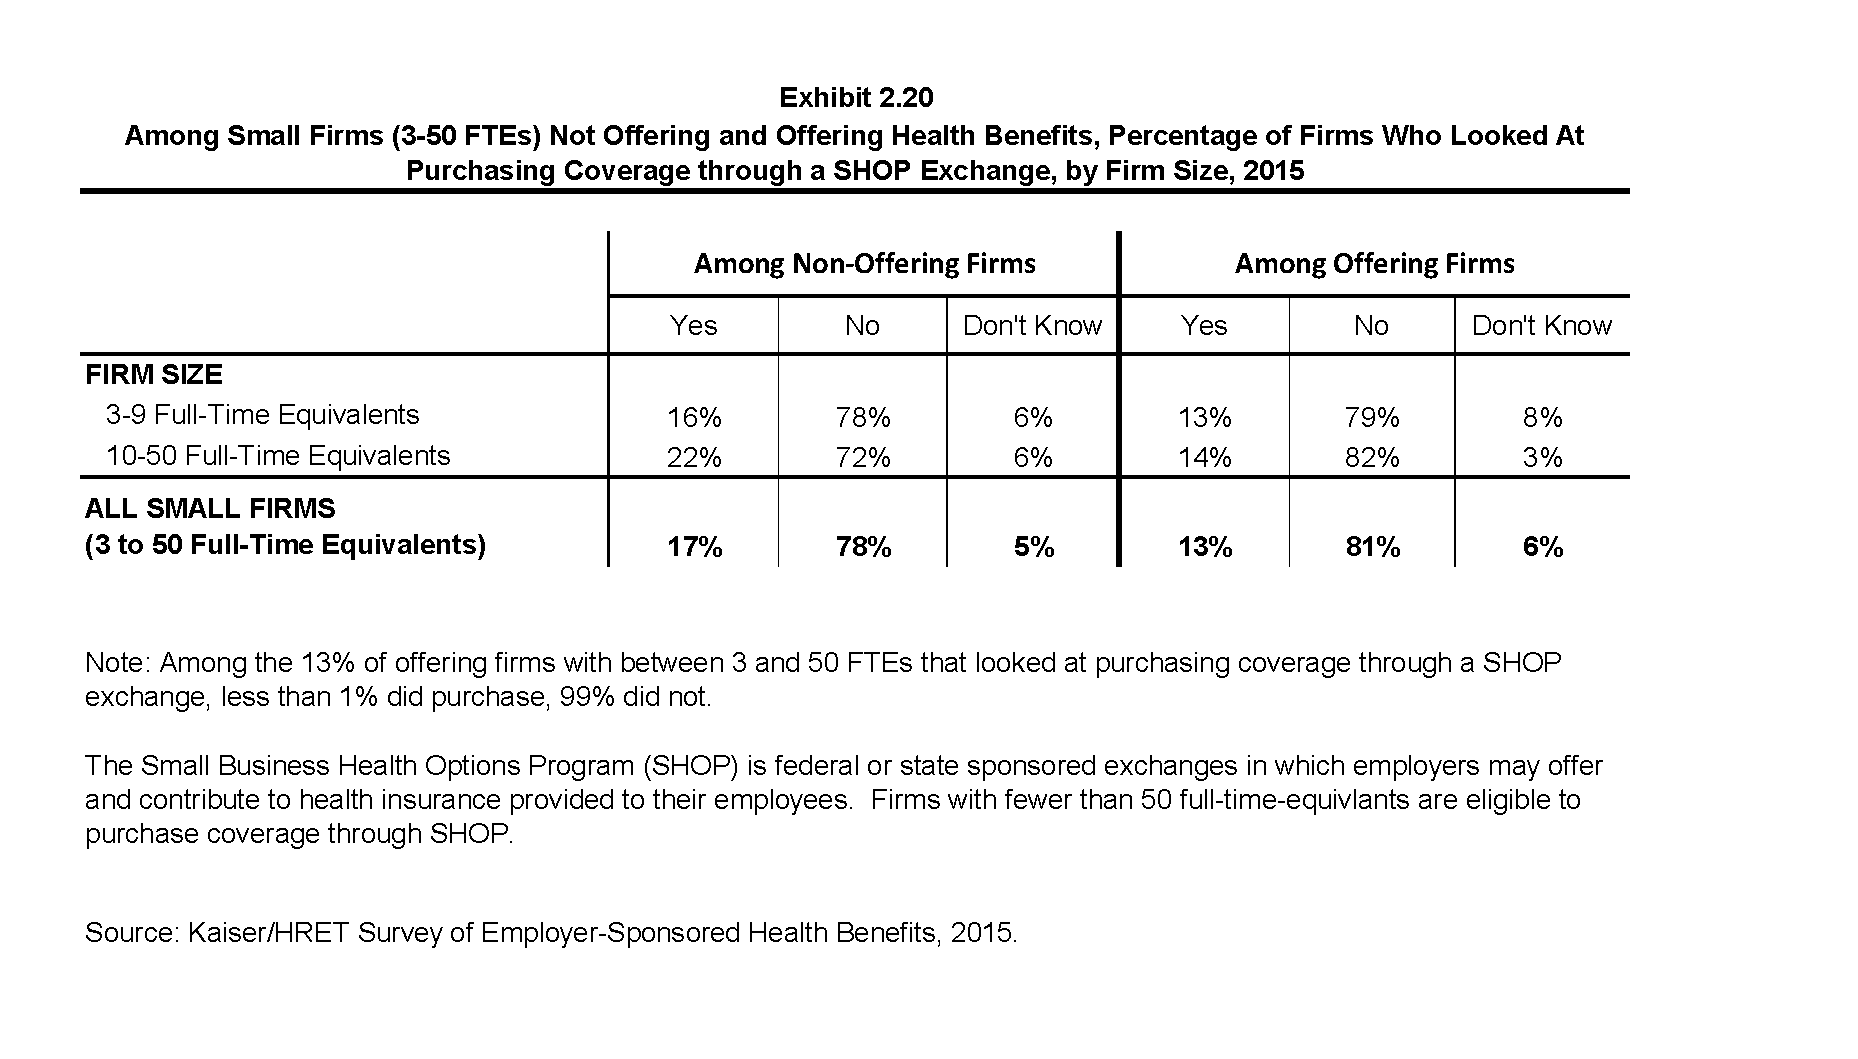
Among Small Firms (3-50 FTEs) Not Offering and Offering Health Benefits, Percentage of Firms Who Looked At Purchasing Coverage through a SHOP Exchange, by Firm Size, 2015