Data Note: How Many People Have Nongroup Health Insurance?
The implementation of the Affordable Care Act (ACA) has focused attention on the composition of the nongroup market: how it looked before the new regulatory provisions take effect and how it will change afterwards. One basic question has been how many people are covered in the nongroup market. There are several ways of answering this question, depending on the time period for measuring enrollment and the information source. There is substantial turnover among people with nongroup coverage, which means that the number of people covered at the beginning of a year (or at any other point in time) is quite different than the number of people who keep that coverage throughout the whole year.
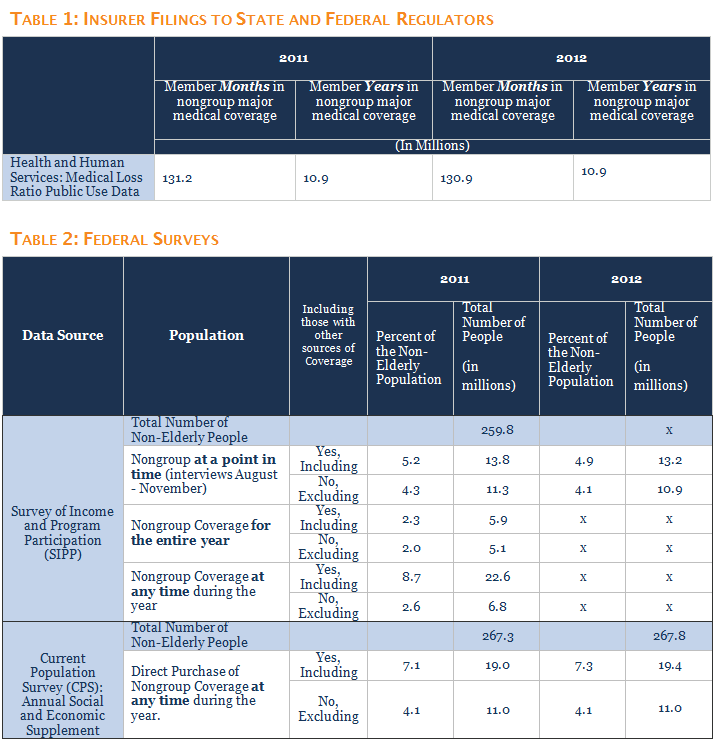
Administrative data from regulatory filings by insurers can be used to count the number of months of nongroup enrollment for a year.1 In 2011 and 2012, there were about 131 million covered months of enrollment in nongroup major medical coverage,2 which translates into about 10.9 million full years of nongroup coverage (Table 1).3 This “member year” number gives us a good estimate of the number of people who have nongroup coverage in an average month, but does not tell us about the types of people who had coverage or for how long they kept it. These questions can be better answered using survey data.
This brief discusses coverage estimates from two national surveys often used to analyze health coverage: the Survey of Income and Program Participation (SIPP) and the Annual Social and Economic Supplement of the Current Population Survey (ASEC). SIPP is a good source of information because it is a large survey, follows respondents over a period of time, and collects coverage information for each month of the year. The ASEC also is a large survey and has the advantage in that it can support coverage estimates at the state level. Our discussion uses data for 2011 because some estimates in SIPP are not available for 2012. All of the estimates discussed in the text are shown in Table 2, which also includes estimates for 2012 where available.
Survey of Income and Program Participation
The Survey of Income and Program Participation (SIPP) interviews a panel of respondents three times each year for several years (the panels vary in duration) and collects coverage information for each month of each year that a respondent participates in the survey. The 2008 panel started with more than 40,000 eligible households. Respondents with insurance coverage are asked about their insurance coverage for each month of the year. SIPP also collects detailed income, employment and demographic information (similar to the ASEC) that can be used to analyze the circumstances of people and families with different types of coverage. Unfortunately, although it has a large national sample, it does not support coverage or other estimates at the state level.
SIPP enables analysis of several different questions about the nongroup market for any year, such as: how many people have nongroup coverage at any particular point in time during a year (e.g., in January or some other month); how many people had nongroup coverage at any time during a year (i.e., the total number of people with at least one month of nongroup coverage), and how many people have nongroup coverage for each month during the year. Longer periods also can be analyzed, although response rates diminish over time and statistical techniques need to be used to correct for loss of participants.
Particularly important for the nongroup market, where there is considerable turnover and where people use the market for different purposes, is that SIPP allows analysis of coverage duration: how long do people stay with nongroup coverage once they have it? People who rely on the nongroup market for long periods of time, such as the self-employed, may have different needs and different resources than people who use nongroup coverage for short periods, such as those who purchase coverage when they are between jobs. The monthly approach in SIPP also allows analysis of people who report multiple types of coverage during a year: did they have more than one coverage type at the same time or did they have different types of coverage at different times of the year? 4
Beginning with a point-in-time estimate, we use SIPP to look at the coverage reported by respondents in the month prior to their Fall 2011 interview (the last year for which calendar-year weights are available for SIPP) and find that about 13.8 million people had nongroup coverage at that time.5 Of these, 11.3 million had nongroup coverage and no other type of coverage, which is likely the best answer to the question of how many people rely on the nongroup market at any given time. An additional 2.5 million people had nongroup coverage and some other type of coverage during the same month. In some cases those people may have been in the midst of a transition, or the nongroup coverage they are reporting may be supplemental insurance rather than comprehensive major medical coverage.
Looking at coverage over a whole the year, about 22.6 million nonelderly people had nongroup coverage in at least one month during 2011. Of these, 6.8 million people had nongroup coverage as their only type of coverage (other than being uninsured) during 2011, including about 5.1 million people who had nongroup coverage (and no other type of coverage) in all 12 months of 2011.

We also can use SIPP to look at how long people who have nongroup coverage keep it. One way of doing this is to look at people who had nongroup coverage at the beginning of a period and then see what percentage report having nongroup coverage at later points in time. As shown in the chart above, if we start with people who had only nongroup coverage in January, 2010, 62% still had only nongroup coverage in July, 2010, 56% still had only nongroup coverage in December, 2010, and 48% had nongroup coverage only in December, 2011. The percentages are almost identical if we look at people who had nongroup plus other coverage types and follow them over the same period. These percentages fall, however, if we look only at people who are continuously covered by nongroup coverage (e.g., they are covered by nongroup coverage for every month across the periods considered). Starting again with people reporting nongroup coverage only in January, 2010, 56% were continuously covered by nongroup coverage through July, 2010, 44% were continuously covered by nongroup coverage through December, 2010, and 31% were continuously covered through December, 2011.
One of the difficulties in using surveys to analyze coverage is that they do not always capture enough information to categorize the coverage reported. In SIPP for 2011, about 8.8 million nonelderly people had coverage identified as “other” at some point during the year, and, of this group, 1.1 million have no other source of coverage during the entire year. If we look at a point in time, about 3.9 million nonelderly people had “other” coverage in the Fall of 2011, with about 2.4 million of them having no other type of coverage. The majority of the 3.9 million people with “other” coverage is young (78 percent are under age 27) and about half (51 percent) say that they are covered by someone outside of the household. This pattern is similar to what we see in the ASEC, discussed below: there are a number of younger people covered as dependents where there is no information to determine the type of coverage that it is. It seems likely that most of these people are dependents under employer-based coverage, because that is the largest source of coverage for families, but some are likely dependents under TRICARE or nongroup policies.6 We do not know how many of these people with “other” coverage have nongroup policies, but to the extent that they do the estimates above are somewhat lower than they should be.
Current Population Survey
The ASEC is the survey that many analysts use for basic estimates of insurance coverage. The Foundation bases many of its estimates on the ASEC, including the basic coverage statistics published in State Health Facts and our primer on the uninsured. The ASEC provides socioeconomic and demographic information of the non-institutionalized American population. The Census Bureau and the Bureau of Labor Statistics administer ASEC as a supplement of the Current Population Survey.7 It is conducted every March and asked of over 60,000 households.
The ASEC is widely used because it is timely, supports both national and state-level estimates, and provides detailed information on insurance coverage, income, employment, and other personal characteristics. The health coverage questions on the ASEC ask about enrollment in public and private types of coverage, the source of coverage (e.g, through an employer or purchased directly), and whether individuals are covered in their own name or as a dependent on someone else’s policy. There is some disagreement among analysts about the time period over which coverage is being measured. The questions ask about having each type of coverage at any time during the year, but many analysts treat the estimates as reflecting the number of people enrolled in a coverage type on any given day during the year (i.e., a point-in-time estimate).8
Estimated from the ASEC, about 19 million nonelderly people were covered by a plan purchased directly from an insurer in 2011. This is the source of the higher range of estimates for the size of the nongroup market that is sometimes cited. However, about 8 million of these people also have other types of coverage as well during the year, primarily coverage from a current or former employer, from Medicaid, or from another government program. In some cases a person may have different types of coverage at different times in the year and in others a person may have more than one type of coverage at the same time. The number of nonelderly people who report having coverage purchased directly from an insurer as their only source of coverage is about 11 million in 2011. This is similar to the SIPP estimate of 11.3 million people with nongroup coverage only in the Fall of 2011.
In addition to those who report direct coverage from an insurer, a number of respondents in the ASEC report that they are covered through someone who lives outside of their household. As with SIPP, the ASEC does not ascertain whether this coverage is provided through an employer, a military program such as TRICARE, or a policy purchased directly from an insurer. About 8.4 million nonelderly people are covered by someone outside of their household in 2011, and for 5.8 million it is the only source of coverage reported in the survey. The vast majority of people with only coverage provided outside of the household are young (86 percent were below the age of 27 in 2011). While most of this coverage is likely dependent coverage under employer-based plans, some of it is nongroup coverage, and to the extent that it is, the estimates above of nongroup coverage are somewhat lower than they should be. The Foundation previously has treated a portion of this coverage as “other private” and included them in the nongroup category in some publications, which likely overstated the number of people with nongroup coverage alone.9
One of the limitations of the ASEC is that it does not address coverage dynamics. Respondents are asked if they had different types of coverage in the past year, but the survey does not collect information about how long people keep each type of coverage that they report or whether they had them at the same time or at different times during the year. Without this information, it is difficult to assess how much respondents depend on each type of coverage that they report. This is one reason why using SIPP may provide a fuller picture of the nongroup market for national estimates.
Discussion
The pre-reform nongroup market is complicated. It was fairly small, serving less than 5 percent of the nonelderly population, with a much smaller population relying on the nongroup market as their only source of coverage. In addition, the nongroup market experiences substantial turnover. There is a large group of purchasers with short stays and another group who rely on the market for longer periods of time. This makes sense because the nongroup market really serves several purposes. Most people with coverage get it through the employer-based system or through public coverage because both receive large federal and state subsidies and are stable sources of coverage. The nongroup market has to fit in around the edges of these other sources of coverage and largely has served the various groups of people who do not qualify for them for one reason or another (e.g., the self-employed, workers or unemployed people without an offer of employer-sponsored coverage, and early retirees not yet eligible for Medicare).
The turnover in, and varied populations served by, the pre-reform nongroup market have posed challenges for analysts and others trying to understand the changes occurring under the ACA. The number of people who have and keep nongroup coverage as their primary source of protection is considerably smaller than the number of people in the market at any given point in time. A considerably larger number of people have nongroup coverage sometime during a year, but many have short tenures and may or may not experience any of the changes underway.
Looking forward, the size of the market is predicted to grow dramatically as millions of uninsured people, many assisted by new premium tax credits, obtain and retain nongroup coverage. By 2016, CBO estimates that about 18 million additional people will have nongroup coverage.10 The financial assistance, plus the new requirement that people have coverage or pay a penalty, will likely lengthen the average time that people stay in this market. However, the market will also continue to serve people between jobs or in transitions, so some turnover will continue as people move into and out of employer-based or public coverage.