Diminishing Offer and Coverage Rates Among Private Sector Employees
The recent release of 2015 information from the Insurance Component of the Medical Expenditure Panel Survey (MEPS-IC) shows continuation of the fairly long-term decline in the share of private-sector workers in small firms that are offered coverage and that receive coverage at their job. This is part of a larger, long-term trend that shows a decline among all private-sector workers in the percentage who are covered by their own employer. While many of these workers are able to find coverage from other sources, such as coverage as a dependent through a spouse or through a public program, the decline is a concern because employer-based coverage is by far the largest source of coverage in the U.S., and its diminishing reliability puts more workers at risk of being left without a source of coverage. Workers who are not offered coverage at their job in general are more likely to be uninsured than workers who are. Among workers aged 18 to 64 at private industries, 28 percent of workers without an offer of employer sponsored insurance (ESI) were uninsured compared to only 4 percent of workers with an offer of ESI1. Workers without an offer of ESI are natural beneficiaries of the new coverage options under the Affordable Care Act (ACA), and we find that the rate of uninsurance fell after 2013 among workers in smaller establishments not offered coverage at their job.
We use information from multiple years of the MEPS-IC to look at long-term trends in health insurance offer and enrollment rates in private sector establishments, broken out by size of firm. Although MEPS-IC surveys state and local government employers, we have limited this analysis to the private sector since a very large share of governments offer health benefits to their workers. It also is not possible to classify state and local government workers by “firm or establishment size” in the MEPS-IC with available public information. We also use the National Health Interview Survey (NHIS) to look at health insurance status over time. NHIS provides the most current coverage information and it permits us to differentiate workers based on whether or not they were offered coverage at their job. Beginning in 2001, NHIS contains information about the size of the establishment for workers (Generally, “establishment” refers to a business location, while “firm” refers to the whole enterprise and may include multiple locations. See Methods Box for difference between “firm” and “establishment”).
Overall, we find from the MEPS-IC that the percentage of workers in private-sector businesses who work in firms that offer health benefits and who are eligible for those benefits (“Share Offered”) has been falling for many years, as has the percentage of workers covered by health insurance in their own firm (“Share Covered”). These declines were particularly large for workers in firms with fewer than 50 employees. The NHIS shows that the uninsurance rate for workers in small establishments who are not offered health insurance at work has been consistent and high over many years, but fell when the new ACA coverage options were implemented in 2014. While an improvement in the insurance status for these workers, their rates of uninsurance remains considerably higher than those of workers in small establishments who are offered coverage at their job.
Offer and Coverage Rates and Trends
Of the almost 120 million private-sector employees in the U.S., not quite one-half (48%) are covered by health insurance offered by their employer in 2015, and this rate has been falling since MEPS-IC began collecting offer and coverage rates in 1996 (Table 1, Appendix). The share covered has two components: the share of workers in businesses that offer health insurance who enroll in that insurance, and the share of workers in businesses that do not offer health insurance to any of their workers. In 2015, about 84% of private-sector workers worked in a business that offered health insurance to at least some of the employees working at the firm, about three-quarters (76%) of those workers were eligible to enroll in the coverage, and of those eligible, three-quarters (75%) enrolled in the coverage. This means about 57% of private-sector workers in businesses offering coverage were covered at their job, and when combined with the 16% of workers in businesses not offering coverage to any workers, the overall coverage rate was about 48%. Most of these percentages have declined over time: between 2000 and 2015, the Share Offered fell from 71% to 64%, while the Share Covered fell from 57% to 48%. The Appendix table displays the complete annual trend in eligibility and enrollment for both all firms and small firms over the period from 1996 to 2015.
| Table 1: Offer and Coverage Rates at All Private Employers | ||
| Year | Share of All Employees Who Work in Firms That Offer Health Insurance and Who are Eligible to Enroll | Share of All Employees Covered At Their Employer |
| 2000 | 71% | 57% |
| 2005 | 68% | 54% |
| 2010 | 68% | 52% |
| 2015 | 64% | 48% |
| SOURCE: Agency for Healthcare Research and Quality. Medical Expenditure Panel Survey Insurance Component Tables. | ||
The declines have been more significant for workers in smaller firms (fewer than 50 employees at all locations). Between 2000 and 2015, the share of workers offered coverage fell from 53% to 38%, while the share covered by their own employer fell from 42% to 27% (Table 2, Appendix).
| Table 2: Offer and Coverage Rates at Small Firms (Fewer than 50 Employees At All Locations) | ||
| Year | Share of All Employees Who Work in Firms That Offer Health Insurance and Who are Eligible to Enroll | Share of All Employees Covered At Their Employer |
| 2000 | 53% | 42% |
| 2005 | 49% | 37% |
| 2010 | 45% | 34% |
| 2015 | 38% | 27% |
| SOURCE: Agency for Healthcare Research and Quality. Medical Expenditure Panel Survey Insurance Component Tables. | ||
As noted above, many workers who are not offered coverage at work are able to find alternate sources of coverage. We use the NHIS to look at the insurance status of these workers.
Effect of New Coverage Options
Employees not offered coverage at work have high rates of uninsurance; this is true for all workers and for workers in small establishments (Figure 1). Unfortunately, the NHIS statistics are reported for “establishments” of fewer than 50 workers, which is a more inclusive grouping than “firms of fewer than 50 workers” reported in MEPS-IC: a firm may have several smaller establishments (for example, a franchise with several small fast food restaurant locations). This means that the NHIS statistics include information for some workers in smaller establishments owned by larger firms as well as information about smaller firms. There are no alternative sources of data that would allow us to identify workers in smaller firms over the same period, so the establishment-size information in NHIS is the best approximation that we have. We excluded government workers from the analysis to more closely match the private-sector workers in the MEPS-IC statistics.
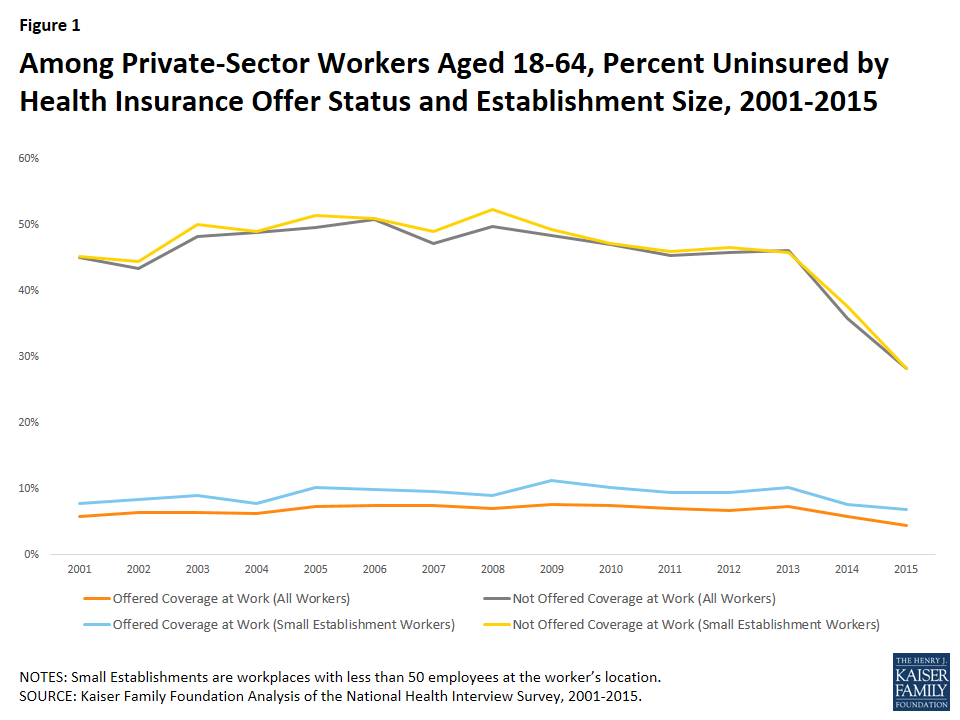
Figure 1: Among Private-Sector Workers Aged 18-64, Percent Uninsured by Health Insurance Offer Status and Establishment Size, 2001-2015
Figure 1 shows the rate of uninsurance among nongovernment workers age 18 to 64. For those not offered coverage at work, the uninsurance rate ranged between 43% and 51% between 2001 and 2013, before falling to 36% in 2014 and 28% in 2015. The uninsurance rate was much lower for those offered coverage at work, ranging between 6% and 8% between 2001 and 2013, before falling to 4% in 2015. The pattern is quite similar for workers in smaller establishments.
Not surprisingly, offers of health insurance are strongly tied to earnings: in 2015 workers offered coverage at work had average earnings of $53,960 while those without an offer had average earnings of just $23,245. The difference in 2010 (Pre-ACA) was $47,297 for workers offered coverage and $19,684 for those who were not. Looked at another way, only 42% of worker in the lowest earnings quartile (earnings below $23,400) in 2015 were offered coverage age work, compared with 92% of workers in the highest earnings quartile (earnings greater than $58,900).
We looked at the trends by type of coverage for workers not offered coverage at work to see how the new ACA coverage options were affecting this population (Figure 2). The ACA particularly benefits low and moderate income workers who are not offered employer-based coverage by providing income-related premium subsidies; it also expanded Medicaid coverage for low-income workers. After 2013, the uninsurance rate fell sharply for this group of workers, while coverage in both Medicaid and nongroup insurance increased. The same pattern holds for workers in smaller establishments not offered coverage at work (Figure 3). Even with these coverage improvements, however, workers not offered coverage at their job remain much more likely to be uninsured than those offered coverage at work.
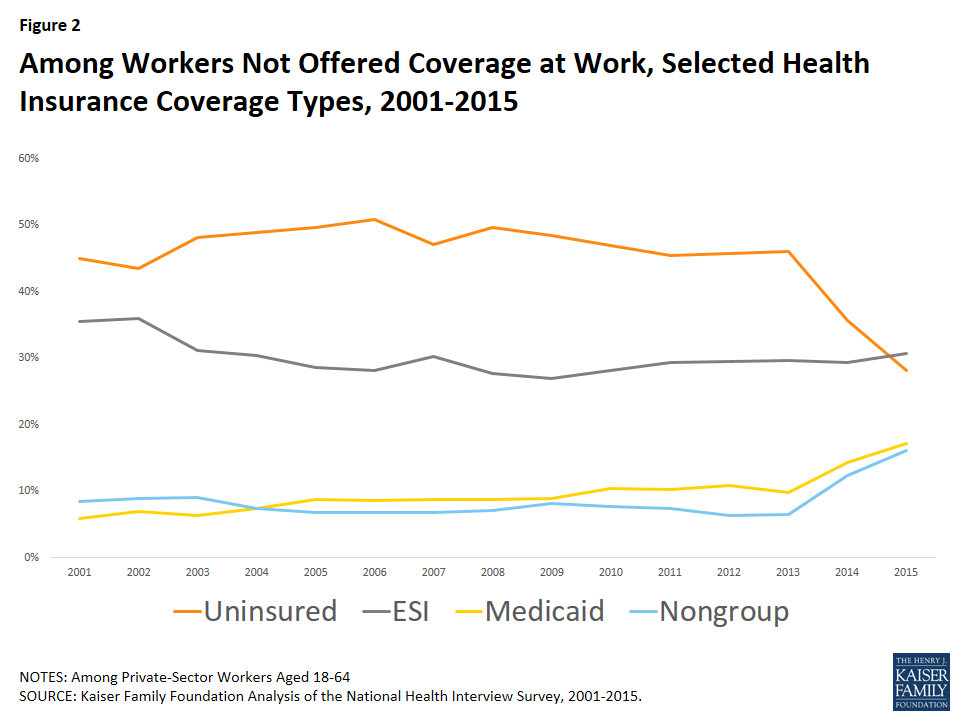
Figure 2: Among Workers Not Offered Coverage at Work, Selected Health Insurance Coverage Types, 2001-2015
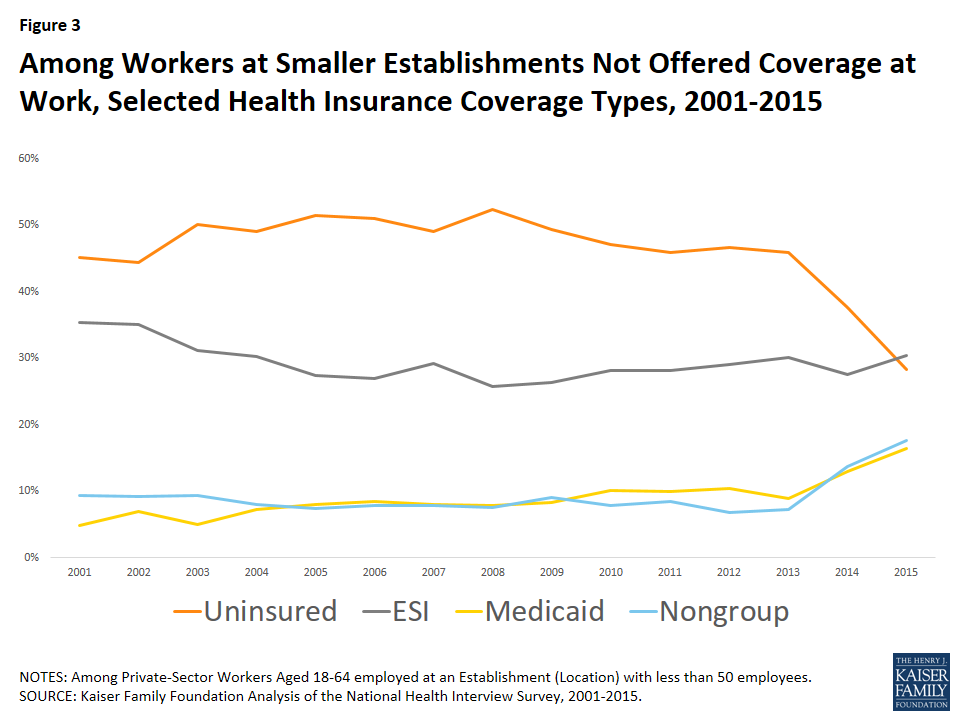
Figure 3: Among Workers at Smaller Establishments Not Offered Coverage at Work, Selected Health Insurance Coverage Types, 2001-2015
Discussion
Private sector firms, particularly smaller firms, have been a diminishing source of coverage for their workers, with long-term decline in both the Share Offered and Shared Covered. Workers with lower earnings are particularly unlikely to be offered coverage at their job. While many workers who are not offered or covered at their job have other sources of coverage, such as dependent coverage through a spouse, the uninsurance rate for these workers has been high for many years. The new ACA coverage options have significantly improved coverage for this group, many of whom can benefit from the subsidized coverage made available in Marketplaces or Medicaid in states that have adopted the ACA coverage expansion. Despite these advances, however, the uninsurance rate for this group remains higher than the rate for workers offered coverage at work, suggesting that additional steps may need to be considered to improve the affordability of coverage for this population.
METHODS
This Insight relies on the Agency for Healthcare Research and Quality’s Medical Expenditure Panel Survey – Insurance Component (MEPS-IC) dataset for firm-level estimates of offers and take-up (enrollment) of ESI from the start of the survey in 1996 up until the most recent available estimates in 2015. Although MEPS-IC can be disaggregated by firm-level characteristics such as number of employees and private ownership, its publicly-available data do not include employee-level characteristics (such as worker age or non-ESI sources of health insurance coverage). In order to investigate the relationship between offers of ESI and workers’ uninsured rate, we used the Centers for Disease Control and Prevention (CDC)’s National Health Interview Survey (NHIS) microdata to examine coverage trends at the worker-level. Since nearly all Americans aged 65 or older are eligible for Medicare, we restricted our NHIS analyses of the uninsured rate to non-elderly workers at privately-held firms.
Between 2000 and 2001, NHIS altered the text of their workers’ place of employment size question from asking, ‘Thinking about this MAIN job or business, how many people are employed there full and part time, including employees at all locations?’ to instead asking the question ‘Thinking about {this MAIN job or business}, how many people work(ed) at this location? Note to FR: “People” includes both full- and part-time employees; “location” refers to the street address of the workplace.’ Starting in 2001, NHIS began collecting establishment size rather than firm size. For more detail about the difference between establishments and firms, see the US Census Bureau’s definition. Due to this change, we limited the NHIS component of our analysis to the period from 2001 to 2015.
Although this paper only presents NHIS statistics from establishments with fewer than fifty workers, we also examined the offer and take-up patterns of workers at establishments with fewer than twenty-five workers and found the trends to move in the same direction as workplaces with less than fifty employees.
NHIS has information about which member of a household is the policyholder for employer-sponsored coverage, and also asks workers that do not report employer-sponsored coverage whether or not they were offered coverage at work. We considered individuals who were working to have been offered coverage at their job if they were a policyholder of employer-sponsored coverage or if they said they were offered coverage at work but did not accept it.
The MEPS-IC tables provide information about the number of private sector employees, the percent of private sector employees in firms that offer health insurance, and the share of private sector employees in firms that offer health insurance who are eligible to enroll and who enroll. To derive the share of all private sector employees offered coverage, we multiply the number of employees in firms that offer health insurance by the share of employees at offering firms who are eligible to enroll themselves, and divide that number by the total number of employees. To derive the share of all private sector employees enrolled with their employer, we multiply the number of employees enrolled in firms that offer health insurance by the share of employees at offering firms who are eligible to enroll themselves and then divide that number by the total number of employees. We do this for all private sector employees and for employees in firms with fewer than 50 workers. By doing this, we do not have standard errors for the final statistics and cannot do statistical testing for the change over time.
We did test year-to-year changes in both the share of employees covered by firms that offer health benefits and also the share of employees that are eligible to enroll at firms that offer health benefits across the period from 1996-2015 for both all private firms and also firms with fewer than 50 employees. For all private sector workers and for private sector workers in firms with fewer than 50 workers, there were statistically significant declines for the 2000 to 2010 period and for the 2005 to 2015 period in (1) the percent of employees in establishments offering health insurance, (2) the percent of employees that are enrolled in health insurance among employees eligible for health insurance , and (3) the percent of employees that are enrolled in health insurance among employees of establishments offering health insurance.