Consumer Assets and Patient Cost Sharing
Higher cost sharing in private insurance has been credited with helping to slow the growth of health care costs in recent years. Plans with higher deductibles and other point of service costs provide health plan enrollees with incentives to make more cost conscious health care choices. For families with limited resources, however, high cost sharing can be a potential barrier to care and may lead these families to significant financial difficulties. Many current policies expose individual enrollees to thousands of dollars in cost sharing expenses and family expenses can easily top ten thousand dollars when someone becomes seriously ill.
While concerns about cost sharing are not new, the recent coverage expansions under the ACA put a new focus on what it means for coverage to be affordable. The goal of the law was to cover more of the uninsured, many of whom have limited means. The law requires most people to have health insurance, if they can afford to pay the premium, or to pay a penalty. The issue for some families, however, is that the policies with affordable premiums may have cost sharing requirements that would be difficult for them to meet when they access services. Many of the policies in the state and federal marketplaces have significant cost sharing, as do many policies provided to people at work [here]. The ACA provides cost-sharing assistance to some, primarily to those with incomes below 200 percent of poverty purchasing through a state or the federal marketplace (see sidebar). Others potentially face much higher out-of-pocket expenses.
We use information from the 2013 Survey of Consumer Finances to look at how household resources match up against potential cost-sharing requirements. We assume that households pay premiums out of current income, but that they may need to use savings or other assets if they become seriously ill in order to meet the deductible or the out-of-pocket limit under their health insurance policies. We show that many households, in particular those with lower incomes or where someone lacks insurance, have low levels of resources that would make it difficult for them to meet health insurance cost sharing demands.
Survey of Consumer Finances
The Survey of Consumer Finances (SCF) is a triennial, nationally representative household survey conducted by the Federal Reserve Board. The 2013 SCF provides a snapshot of household finances, including detailed information on households’ debts, assets, income and other characteristics, including the types of health insurance present in the household.1
The SCF collects information for households, which in some cases will be different than the group of people considered to be a family in other surveys. Most of the information from the SCF, including the financial information, is designed to describe the “primary economic unit” (PEU), which is the economically dominant single person or couple (living together as spouses or partners) in a household and all of the other people living in the household who are financially dependent on that individual or couple. For this analysis, we limit the households to be more representative of those who are likely to rely on private health insurance by excluding (1) households where a dominant economic individual or his or her spouse/partner if either are over age 64 and (2) households with incomes under poverty.
The Affordable Care Act, Accessibility and Coverage Options
The ACA extended access to coverage to all citizens and legal residents and requires most people to either have health coverage or pay a penalty. People who are offered coverage at work are generally expected to get their coverage there, and the ACA has complementary policies that require employers with more than 50 workers to offer coverage meeting minimum standards in terms of cost and value to their full time workers or to pay a financial penalty. All citizens and legal residents not eligible for Medicare also may purchase coverage in a state or the federal marketplace, and those with incomes below 400% of poverty who are not offered coverage at work meeting minimum requirements and who are not eligible for Medicaid or CHIP also may qualify for tax credits to reduce their premiums.–The ACA addresses cost sharing in private policies in several ways:
- Most policies are required to have an out-of-pocket limit that limits the amount of cost sharing enrollees must pay in a year for covered services received from network providers. The maximum limits for 2015 are $6,600 for single coverage and $13,200 for family coverage. For policies offered in the non-group and small group markets, the limits apply to all cost sharing for the essential health benefits. In the larger group market, federal guidance provides employers with flexible to exclude otherwise covered services from the limit, permitting unlimited cost sharing [for more information].
- Most private policies are prohibited from requiring cost sharing for specified preventive services [listed here].Federal regulations define “minimum value” for coverage offered by employers. Large employers must offer coverage that meets the minimum value standard or they may face financial penalties if one of their full-time employees receives subsidized coverage in a state or the federal marketplace. In addition, workers and their family members who are coverage by an employer that meets the minimum value requirement (as well as a separate requirement related to affordability of premium contributions) are not eligible for premium tax credits or cost sharing assistance.–Minimum value is defined in relation to the cost of benefits for a standard population covered by typical self-funded group health plans. Basically, the cost sharing under an employer plan must pay for at least 60% of the anticipated costs for covering a standard population; taking into account the plan’s cost sharing. The federal government has provided a minimum value calculator to allow employers to test their plans, but alternative methods are also available. Generally, the minimum value requirement does not provide a meaningful check on cost sharing in employer plans. The large majority of plans have values that would exceed the 60% requirements [for more information], and the calculation does not reduce cost sharing much if at all beyond the maximum permitted out-of-pocket limits. This means that in many cases a plan with a deductible of $6,000 with the maximum out-of-pocket limit would meet the minimum value requirement.
- For those who are not eligible for job-based coverage or Medicaid, the ACA allows people to enroll in non-group plans. New market rules establish four tiers of cost sharing and limit out-of-pocket expenses for patient cost sharing to the same limits as described above. In addition, people with incomes below 250% of poverty who purchase coverage through the marketplace are eligible to enroll in silver plans with reduced cost sharing. Those with the lowest incomes are eligible for greater reductions; the impact of the reductions on cost-sharing requirements is shown [here]
Results are shown for all these households as well as for households where someone had private insurance and for households where someone was uninsured. Although we are looking at cost sharing for people with insurance, we included households with people who were uninsured in 2013 because they are prime targets for coverage expansion under the ACA, either through expanded coverage at work or through new coverage options. For each groups results are further broken out by household size (one person or households of more than one person) and by poverty categories.
Using the information from the survey on household assets and debts, we developed two measures of resources that households may have to meet health insurance cost sharing. The measures used here could be considered conservative because they assume that a household can bring a large share of its saved resources to bear to pay one-year’s cost sharing in a health insurance policy.2
- The first category is liquid financial assets, which are those most easily converted to cash. The category includes checking and saving accounts, money market accounts, certificates of deposit, savings bonds, non-retirement mutual funds, stocks and bonds, but excludes the value of dedicated retirement accounts (such as 401k accounts) and the cash value of life insurance.
- The second category is net financial assets, which is a broader measure of the household’s total resources. This category includes total all financial assets, including assets dedicated to retirement, reduced by the household’s unsecured debts. For this measure, the value of assets is reduced by credit-card debt and other unsecured loans, but debts secured by real property (such as mortgage debt) and loans for vehicles and education are not counted against assets. This category measures how much money a household has to pay medical expenses after meeting debt obligations.
We look at the median amount (one-half of households have more and one-half have less) for each measure to paint a basic picture of the financial resources available to households. Median asset levels, rather than averages, are used because assets, like income, are unevenly distributed and the high asset levels of wealthier households skew the distribution. We also calculate the percentages of households with the resources to meet specified deductibles and out-of-pocket cost sharing limits. We assume that a household meets medical cost sharing when they spend all of their net-financial assets or liquid financial assets; this assumption would leave households with no additional assets for savings or other emergencies and does not account for the complex financial picture many households face.
Health Insurance Cost Sharing
Private health insurance policies have several forms of cost sharing, including general deductibles that must be met before most services are covered, and specified dollar amounts (copayments) or percentage contributions (coinsurance) that plan enrollees must pay when they receive covered services. Most plans are required to have limits on annual enrollee cost sharing; the maximum allowed limits for 2015 are $6,600 for single coverage and $13,200 for family coverage.
Cost sharing requirements vary widely from policy to policy. Looking at plans offered by employers, about 80% of workers with employer plans have a general annual deductible and, among those, average deductibles for single coverage are almost $1,800 in smaller firms (3 to 199 workers) and about $970 in large firms3 . Among all workers enrolled in a plan with a deductible in 2014, the average is $1,217. There is considerable variation in deductibles that covered workers face. Around these averages, 25% of workers enrolled in a plan with a deductible at smaller firms have a single deductible of $894 or less while 25% have a single deductible of $2,500 or more. In larger firms, 25% of workers who are enrolled in a plan with a deductible have a single deductible of $500 or less while 25% have a single deductible of $1,265 or more. For all covered workers, 25% are in a plan with a deductible of 500 or less and 75% are in a plan with a deductible of $1,500 or more. Out-of-pocket limits for workers in single coverage in plans offered by employers average about $3,500 in small firms and about $3,000 in larger firms; 25% of workers in smaller firms have an out-of-pocket limit of $5,000 or more for single coverage; the comparable amount for larger firms is $4,000. Deductibles and out-of-pocket limits in family plans are usually about twice the single amounts, but some plans may have a different structure, such as a per enrollee limit which make them harder to characterize. A more complete picture of deductibles, out-of-pocket limits are other cost sharing in employer plans is available [here].
Cost sharing also varies significantly in nongroup plans both across and within metal tiers. For example, average single deductibles for plans with a combined deductible for medical and prescription drugs offered in the federal marketplace range from $69 for platinum plans to $5,328 in bronze plans4 . As with employer plans, there is significant variation around the averages, for example 13% of silver plans on the federal marketplaces have a combined deductible of less than $1,500 dollars and seven percent have a deductible of $4,000 or more. Out-of-pocket limits also have a large range: $1,975 for platinum plans and $6,359 for bronze plans5 . For more information on cost sharing in the federal exchanges see [here]. Many lower income purchasers in the federal and state marketplaces also are eligible for subsidies that reduce the cost sharing in their policies [here].
For this analysis, we compare household resources against two deductible levels: $1,200 single/$2,400 family (referred to as the lower deductible amounts) and $2,500 single/$5,000 family (referred to as the higher deductible amounts); and against two out-of-pocket limits: $3,000 single/$6,000 family (referred to as the lower out-of-pocket limits) and $6,000 single/$12,000 family (referred to as the higher out-of-pocket limits). We chose these levels to represent the mid to high range of cost sharing. While there are plans with less cost sharing and plans with more cost sharing, these levels should provide a reasonably good measure of the ability of families to meet of the typical cost sharing requirements available in the market. Households with one member are measure against the single amounts and households with more than one member are measured against the family amounts.
Median Financial Resources
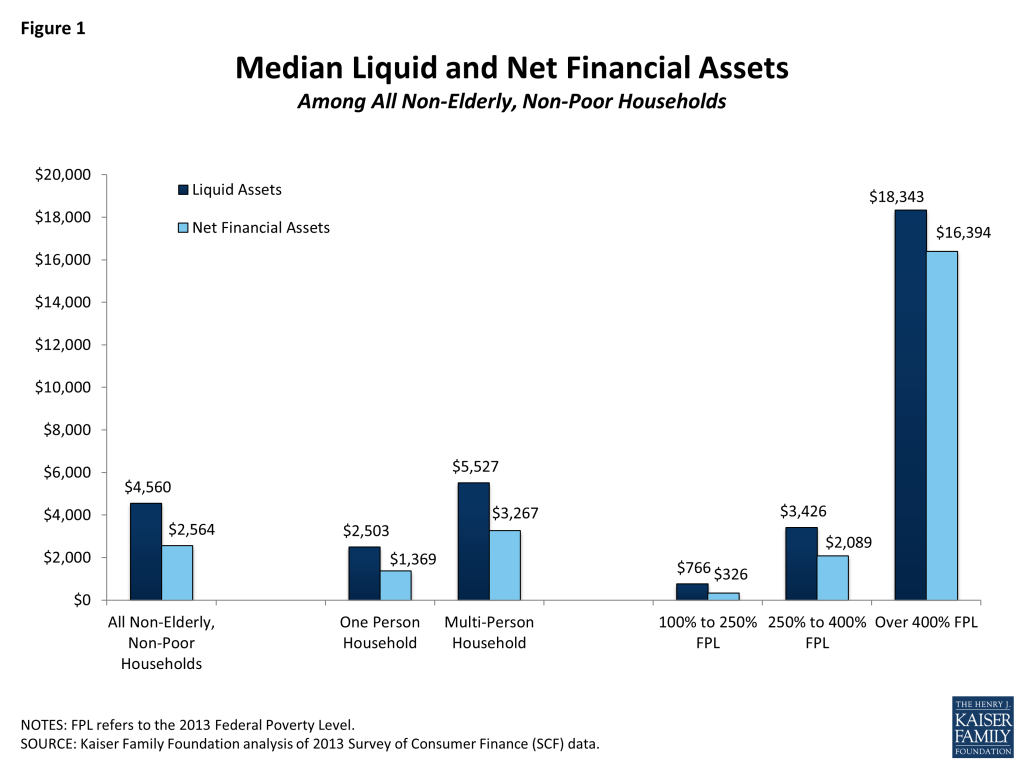
Among non-elderly, non-poor households, the median amount of liquid financial assets is $4,560 and the median amount of net financial assets is $2,564. Liquid financial and net financial assets are lower among single households than among households of two or more members, and are much lower in households with incomes below 400% of poverty than above (Figure 1). Households with incomes between 100% and 250% of poverty have quite low levels: the median for liquid financial assets is just over $700 and median for net financial assets is just over $300. The poverty categories are defined based upon the poverty level established by the Department of Health and Human Service for 2013. In 2015, a family of four earning $24,250 would be 100% of poverty and households at $60,625 and $97,000 would be 250% and 400% of poverty, respectively. For a single individual, the poverty level in 2015 is $11,770, individuals earning $29,425 and $47,080 would be at 250% and 400% of poverty respectively.6
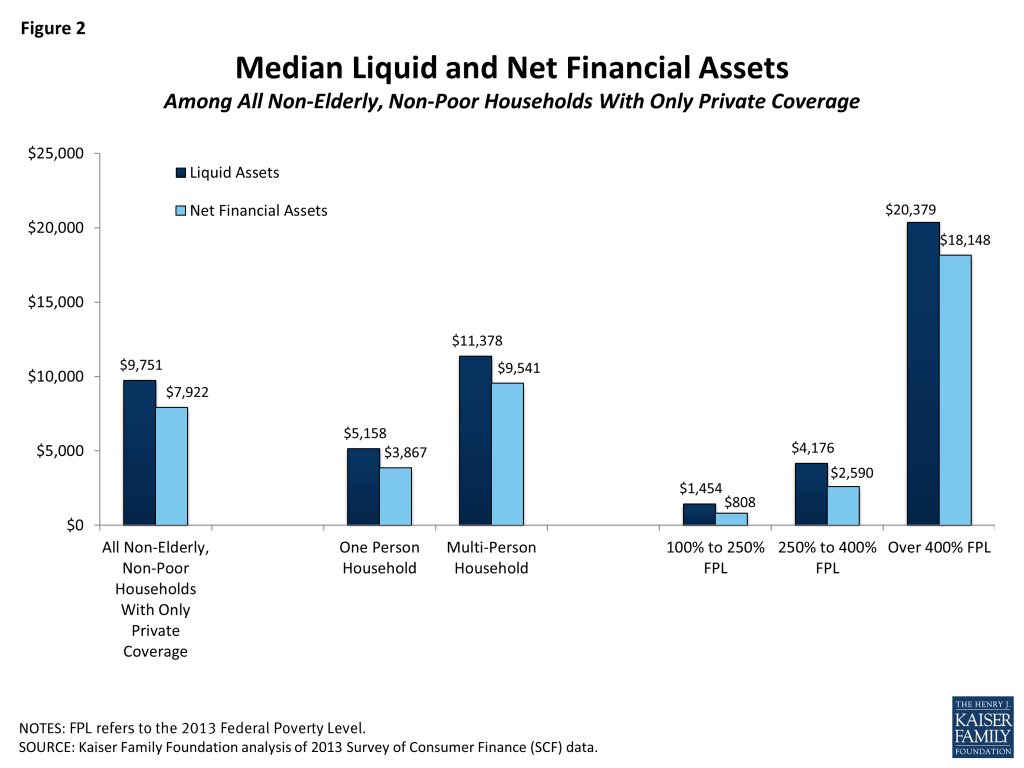
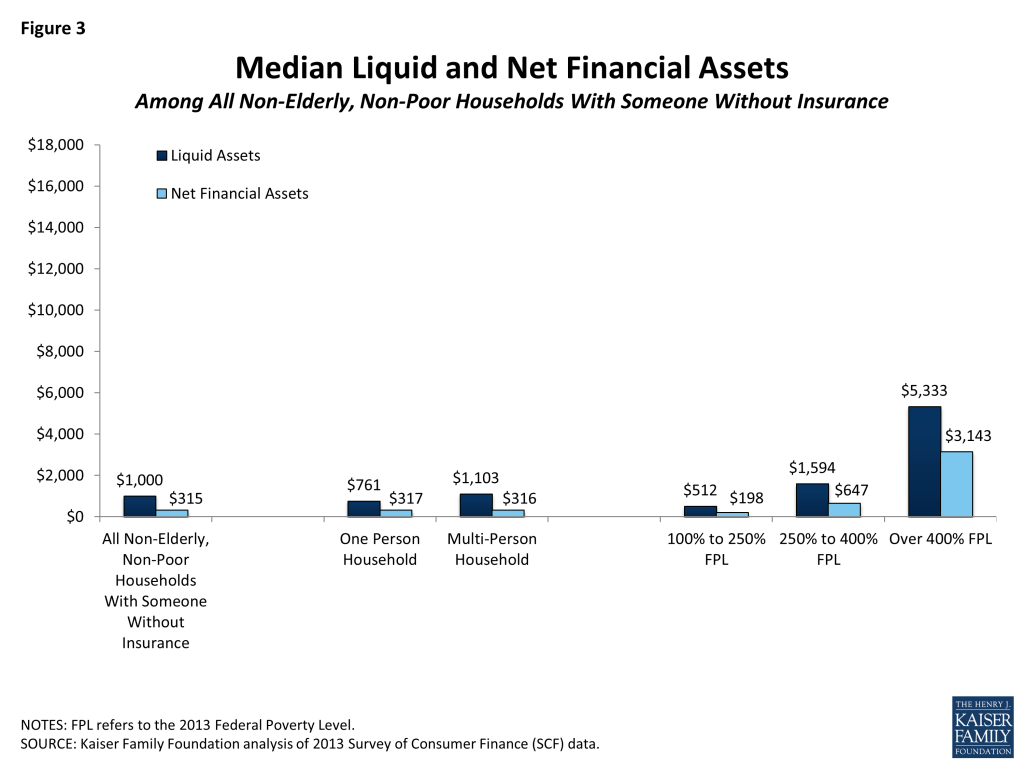
Asset levels vary when everyone in the household is covered by private insurance and when someone in the household is without insurance. In households where the only form of coverage was private health insurance, median liquid financial assets are $9,751 and median financial assets are $7,922 (Figure 2). The distribution is similar to that of all households: median asset levels are higher among households with one member than among those with one-member and households with incomes under 400% of poverty have much lower assets than those with higher incomes. In contrast, households where at least one member was uninsured have lower asset levels: the median level of liquid financial assets is $1,000 and the median level of net financial assets is $315. Households with lower incomes have particularly low asset levels (Figure 3).
The figures above show that many households may have difficulty meeting health insurance cost-sharing requirements with existing resources. Median assets levels for households with incomes below 400% of poverty, and particularly those between 100 and 250% of poverty, are low when compared to the higher deductible amounts and out-of-pocket limits in health insurance policies. Families where someone lacked health insurance, a primary target for coverage expansion under the ACA, have relatively low assets across the board.
Assets to Meet Cost-Sharing Requirements
In this section we look at the percent of households that have sufficient assets to meet the specified deductible amounts and out-of-pocket limits. The discussion here focuses on liquid financial assets because for most households they are the higher measure. Similar figures using the net financial asset measure are shown in the appendix. In general, many households, and particularly those with lower incomes or with someone who was uninsured, do not have sufficient liquid financial assets to cover the deductibles amounts. Looking at the out-of-pocket limits, most households do not have sufficient liquid financial assets to meet either the lower or the higher limit. The percentage of households who have both low incomes and enough assets to meet either of the out-of-pocket limits is very low.
Deductibles
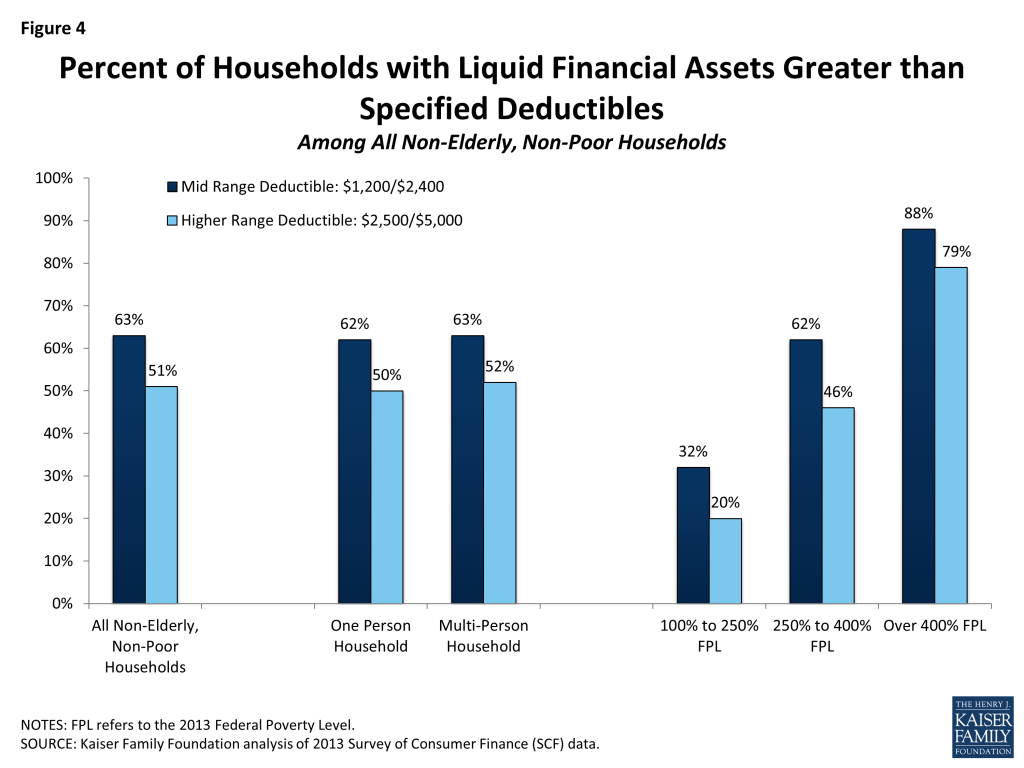
Overall, three in five (63%) households have enough liquid financial assets to meet the lower deductible amounts while one-half (51%) can meet the higher deductible amounts (Figure 4). These percentages are similar for single-member and multi-member households, but vary significantly by family income. Only 32% of households with incomes between 100% and 250% of poverty can meet the lower deductible amounts, while one-in-five can meet the higher deductible amounts. In contrast, 88% of households with incomes over 400% of poverty can meet the lower deductible amounts and three-in-four (79%) can meet the higher amounts.
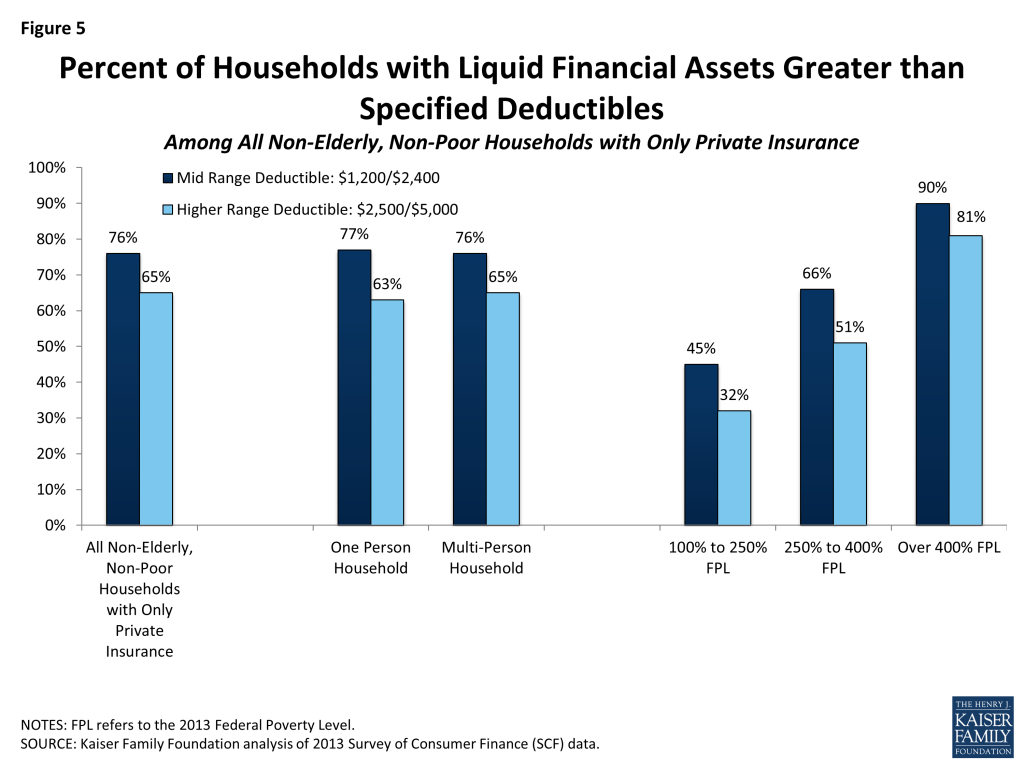
Deductibles are easier to meet for households with only private coverage, where 76% have sufficient liquid financial assets to meet the lower deductible amounts and 65% can meet the higher amounts (Figure 5). Again there is significant variation across income. Among households with only private coverage and incomes between 100% and 250% of poverty, two in five (45%) have enough liquid financial assets to meet the lower deductible amounts and 32% can meet the higher amounts; in contrast, for households with incomes above 400% of poverty, 90% have enough liquid financial assets to meet the lower deductible amounts and 81% can meet the higher amounts.
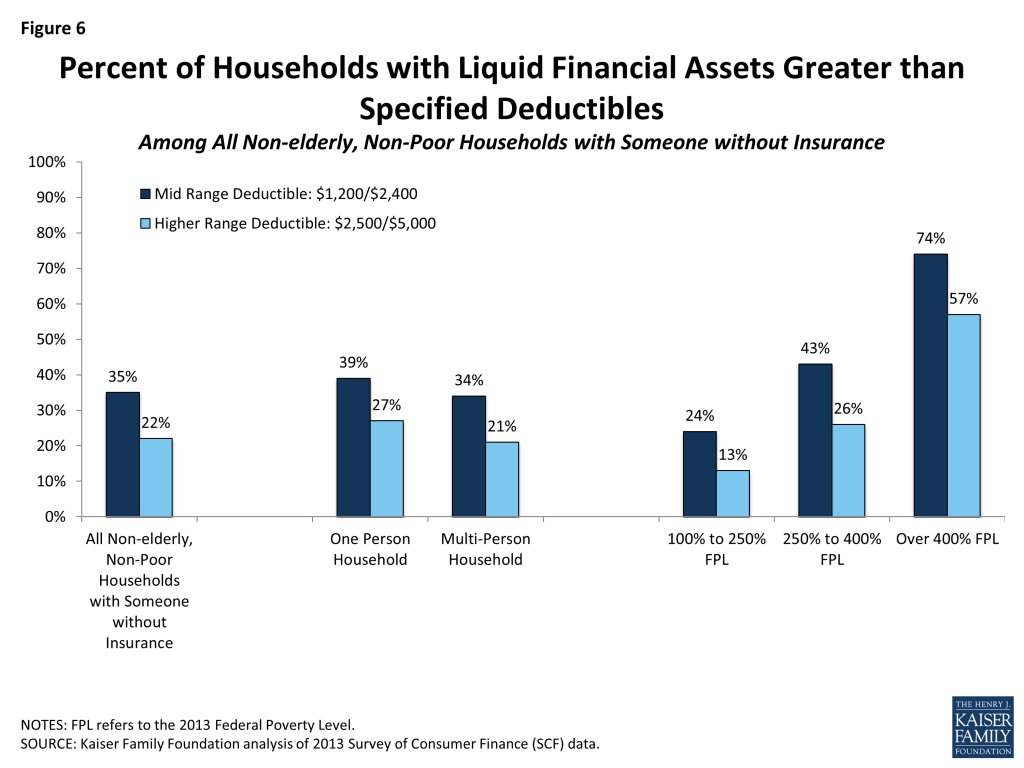
Households with at least one person who was uninsured have a particularly hard time meeting the deductible amounts. Only about one-in-three (35%) of these households have enough liquid financial assets to meet the lower deductible amounts and only 22% can meet the higher amounts. Among households with incomes between 100% and 250% of poverty, about a quarter (24%) have enough liquid financial assets to meet the lower deductible amounts and only 13% can meet the higher amounts. Among households with incomes over 400% of poverty, 74% have enough liquid financial assets to meet the lower deductible amounts while just about one-half (57%) can meet the higher deductible amounts.
Out-of-Pocket Limits
Out-of-pocket limits are higher than deductibles and meeting them is more difficult for many families. Forty-eight percent of households have enough liquid financial assets to meet the lower out-of-pocket limits and 37% can meet the higher limits (Figure 7). The percentages are quite low for households with incomes between 100% and 250% of poverty, with 18% having enough liquid financial assets to meet the lower out-of-pocket limits and 11% being able to meet the higher limits. Among households with incomes over 400% of poverty, 75% have enough liquid financial assets to meet the lower out-of-pocket limits while just 62% can meet the higher limits.

Things are somewhat better for households with only private health insurance, where 61% of households have enough liquid financial assets to meet the lower out-of-pocket limit and 49% can meet the higher limit (Figure 8). Still, only 29% of these households with incomes between 100% and 250% of poverty can meet the lower out-of-pocket limit and only 18% can meet the higher amount. The percentages for those over 400% of poverty are similar to those for households overall.

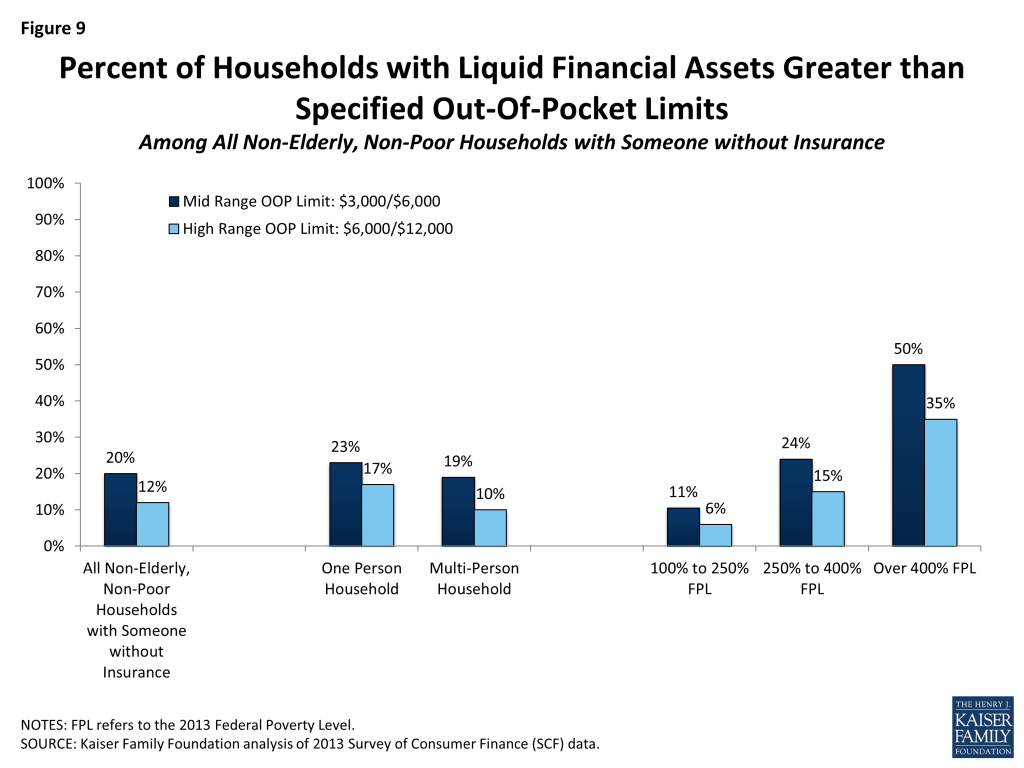
A large share of households in which someone was uninsured lacks enough resources to meet the out-of-pocket limits (Figure 9). Only 20% of these households have enough liquid financial assets to meet the lower out-of-pocket limit and only 12% can meet the higher limit. Even among households with incomes above 400% of poverty, only 50% have liquid financial assets that meet the lower out-of-pocket limit and 35% can meet the higher limit.
Additional Financial Support
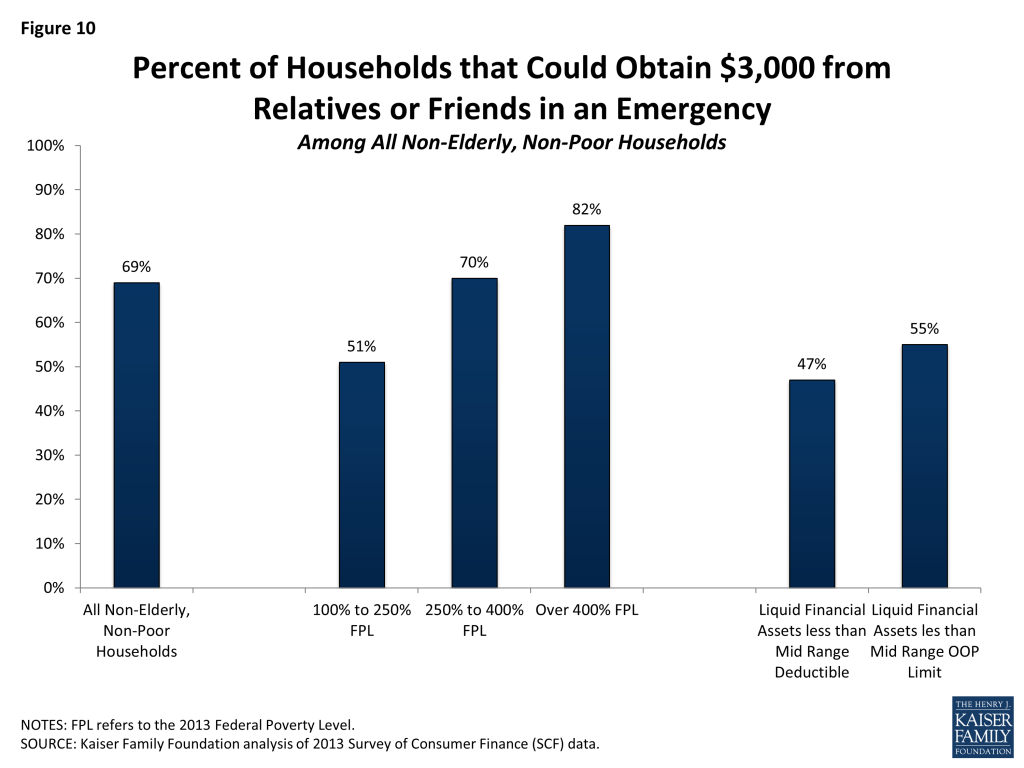
Faced with medical bills, people may turn to friends and relatives to help them meet expenses. The SCF asks respondents whether in an emergency they could obtain $3,000 of financial assistance from friends or relatives7 . Among non-elderly, non-poor households, 69% respond affirmatively to this question. Households with higher incomes are more likely to say that they can obtain $3,000 from family or friends in an emergency: 82% for households with incomes over 400% of poverty compared with 51% for households with incomes between 100% and 250% of poverty. Similarly, just over one-half (55%) of households that have liquid financial assets below the lower out-of-pocket limits ($3,000 single/$6,000 family) say that they could do so.
Discussion
Many non-elderly, non-poor households lack the resources to meet the deductibles and out-of-pocket limits that they may encounter in the private insurance market. Many households have insufficient liquid financial assets to meet the specified cost sharing measures, and the situation for net financial assets is no better (See Attachment 1). Not surprisingly, the difficulties are greater in households with lower incomes and with someone who lacked health insurance. These groups are targets for expanded coverage under the ACA and, as they transition into coverage, it will be important to assess whether the policies they can get protect them financially if they become seriously ill.
While the ACA provides for reduced cost sharing for some people with incomes below 250% of poverty that purchase coverage in a state or the federal marketplace, there is no assistance with cost sharing for those with higher incomes or for those obtaining coverage through a job. As is evident from the Figures and the appendix, substantial shares of households with incomes between 250% and 400% of poverty would be unable to meet even the lower out-of-pocket limits with their current resources, and meaningful shares of households with incomes over 400% of poverty would have problems as well. For these people, serious illness may require that they borrow funds or become indebted to their health care providers. Roughly half of those with liquid financial assets below the cost sharing measures say they could obtain $3,000 in an emergency from friends or relatives.
The higher cost sharing in private insurance has been credited with helping to slow the rate of health care cost growth. Asking enrollees to pay a portion of costs at the point of service may encourage them to make consumer health care more wisely and to weigh the costs and benefits of alternative treatment options and providers. At the same time, cost sharing that seriously stresses family budgets may act as an impediment to seeking needed care, frustrating a primary reason people seek to be insured in the first place. For these families, having coverage would certainly reduce the ultimate financial consequences of serious illness, which is important both for the family and for providers delivering care, but this is a bargain that may look better in hindsight, after an illness has occurred, than it does when the family is trying to decide whether or not to pay for such a plan in the first place. Particularly as we extend private coverage to more families with lower incomes and limited resources, we need to be cognizant of their financial capacity to use the coverage that they are being asked to buy.
Methods:
The 2013 Survey of Consumer Finances (SCF) is a triennial, nationally representative household survey conducted by the Federal Reserve Board. The survey has a dual frame, with respondents selected both from a national area probability design and a sample of households with high income tax returns.8 The 2013 SCF is the most current survey available and is based on 6,015 households.9 For this analysis, we excluded households in which (1) a financially dominant individual or his or her spouse was over age 64 or (household income was less than 100% of poverty). These limitations reduce the number of households to 4,080.
The SCF defines a family as a “primary economic unit (PEU),” or all of the individuals living in a household who are financially interdependent with the dominant individual or couple.10 Income and assets are measured for the PEU in the household. The definitions of the different types of assets and debts are available [here] and [here]. The analysis uses median rather than mean measures of assets to account for the skewed distribution of household financial characteristics. Weights were applied to ensure medians were representative of the population.
The SCF provides information about the types of insurance present in each household, and also about whether each member had coverage or not. Unlike financial characteristics, insurance questions are asked of all members of a household, including members that are not part of the PEU, which could be a relative who is financially independent or a financially independent nonrelative living in the household. This creates some potential ambiguity when we look at households in which someone has private coverage because it is possible that the only people with private coverage are not part of the PEU. To check if this was biasing results, we also looked at households where everyone had private coverage and no other type of coverage and found that the quartiles for liquid and net financial assets were similar. Because we have information about whether or not each person in the household has some coverage or not, we were better able to target the members of the PEU in identifying households where someone was uninsured. We selected only households where the financially dominant individual, his or her spouse or partner, or his or her financially dependent children (regardless of the child’s age) were uninsured. Households with only private insurance are covered those in which all the members are covered by employer coverage, private non-group coverage, Tri-care and/or a union sponsored plan.
| Percent of Households with Net Financial Assets Greater than Specified Deductibles and Out of Pocket Maximums | ||||
| Threshold: | Mid Range Deductible: | High Range Deductible: | Mid RangeOut-of-Pocket Maximum: | High RangeOut-of-Pocket Maximum: |
| Single/Family Coverage | ($1,200-Single and $2,400-Family) | ($2,500-Single and $5,000-Family) | ($3,000-Single and $6,000-Family) | ($6,000-Single and $12,000-Family) |
| Among All Non-elderly, Non-Poor Households | ||||
| All Households | 53% | 45% | 43% | 35% |
| Size of Household | ||||
| One Person Households | 51% | 43% | 41% | 34% |
| Multi-Person Households | 53% | 45% | 43% | 35% |
| Poverty Level | ||||
| 100% to 250% FPL | 26% | 18% | 17% | 10% |
| 250% to 400% FPL | 51% | 39% | 37% | 28% |
| Over 400% FPL | 76% | 70% | 67% | 59% |
| Among All Non-Elderly, Non-Poor Households with Only Private Insurance | ||||
| All Households | 65% | 57% | 54% | 46% |
| Size of Household | ||||
| One Person Households | 64% | 55% | 52% | 44% |
| Multi-Person Households | 66% | 57% | 55% | 47% |
| Poverty Level | ||||
| 100% to 250% FPL | 38% | 28% | 27% | 18% |
| 250% to 400% FPL | 54% | 42% | 39% | 32% |
| Over 400% FPL | 78% | 72% | 69% | 61% |
| Among All Non-Elderly, Non-Poor Households with Someone without Insurance | ||||
| All Households | 27% | 19% | 17% | 11% |
| Size of Household | ||||
| One Person Households | 30% | 24% | 21% | 16% |
| Multi-Person Households | 27% | 17% | 16% | 9% |
| Poverty Level | ||||
| 100% to 250% FPL | 18% | 12% | 11% | 5% |
| 250% to 400% FPL | 34% | 22% | 21% | 14% |
| Over 400% FPL | 59% | 45% | 40% | 30% |
| NOTES: FPL (federal poverty level). Households with only private insurance are covered by employer coverage, non-group coverage, Tri-care and/or a union sponsored plan. Figures reported are percent of households meeting family thresholds for households with more than one member and single-coverage threshold for individual households.SOURCE: Kaiser Family Foundation analysis of 2013 Survey of Consumer Finance (SCF) data. | ||||
Endnotes
- The survey asks whether anyone in the household has health insurance and if so, what types of insurance people have. The survey also ascertains whether everyone in the household is covered by the same type of health insurance, whether everyone is uninsured, and who in the household is uninsured. ↩︎
- Jacobs, Paul, and Gary Claxton. “Comparing the Assets of Uninsured Households to Cost Sharing Under High-Deductible Health Plans.” Health Affairs 27.3 (2008): W214-221. Web. 14 Jan. 2013. http://content.healthaffairs.org/content/27/3/w214.full.pdf html. ↩︎
- Kaiser Family Foundation. “Employer Health Benefits Survey”. Sept 2015. https://modern.kff.org/report-section/ehbs-2014-section-seven-employee-cost-sharing/ ↩︎
- Averages and distributions are not weighted by enrollment. For more information see: Claxton, Gary; Cox, Cynthia and Rae, Matthew. “The Cost of Care with Marketplace coverage”. Kaiser Family Foundation. February 11, 2015. https://modern.kff.org/health-reform/issue-brief/the-cost-of-care-with-marketplace-coverage/ ↩︎
- Averages and distributions are not weighted by enrollment. For more information see: Claxton, Gary; Cox, Cynthia and Rae, Matthew. “The Cost of Care with Marketplace coverage”. Kaiser Family Foundation. February 11, 2015. https://modern.kff.org/health-reform/issue-brief/the-cost-of-care-with-marketplace-coverage/ ↩︎
- U.S. Department of Health & Human Services. “2015 Poverty Guidelines.” http://aspe.hhs.gov/poverty/15poverty.cfm ↩︎
- The exact question wording is: “In an emergency could you (or your {husband/wife/partner}) get financial assistance of $3,000 or more from any friends or relatives who do not live with you?”. “Codebook for the 2013 Survey of Consumer Finances.” Federal Reserve. http://www.federalreserve.gov/econresdata/scf/scfindex.htm ↩︎
- Kennickell, Arthur B. “Wealth Measurement in the Survey of Consumer Finances: Methodology and Directions for Future Research”. May 2000. Web. 23 Jan. 2013. http://www.federalreserve.gov/econresdata/scf/files/measurement.pdf ↩︎
- Kennickell, Arthur. “Codebook for the 2013 Survey of Consumer Finances.” Division of Research and Statistics Board of Governors of the Federal Reserve System. Web. 23 Jan. 2013. http://www.federalreserve.gov/econresdata/scf/files/codebk2013.txt ↩︎
- Brian K. Bucks, Arthur B. Kennickell, Traci L. Mach and Kevin B. Moore. “Changes in U.S. Family Finances from 2004 to 2007: Evidence from the Survey of Consumer Finances.” Federal Reserve Bulletin, vol. 95 (February 2009), pp. A53. ↩︎