What’s In and What’s Out? Medicare Advantage Market Entries and Exits for 2015
Medicare Advantage Plan Availability
Nationwide. The total number of Medicare Advantage plans will be similar to the number in 2014, declining by 3 percent from 2,014 plans in 2014 to 1,945 plans in 2015 (Exhibit 1). The number of plans reflects both plan exits and entries. Between 2014 and 2015, more Medicare Advantage plans will exit than enter: 378 plans will exit markets across the country at the end of 2014 while 309 new plans will enter markets in 2015. The majority of plans in 2015 (84%) are plans that were also available in 2014.
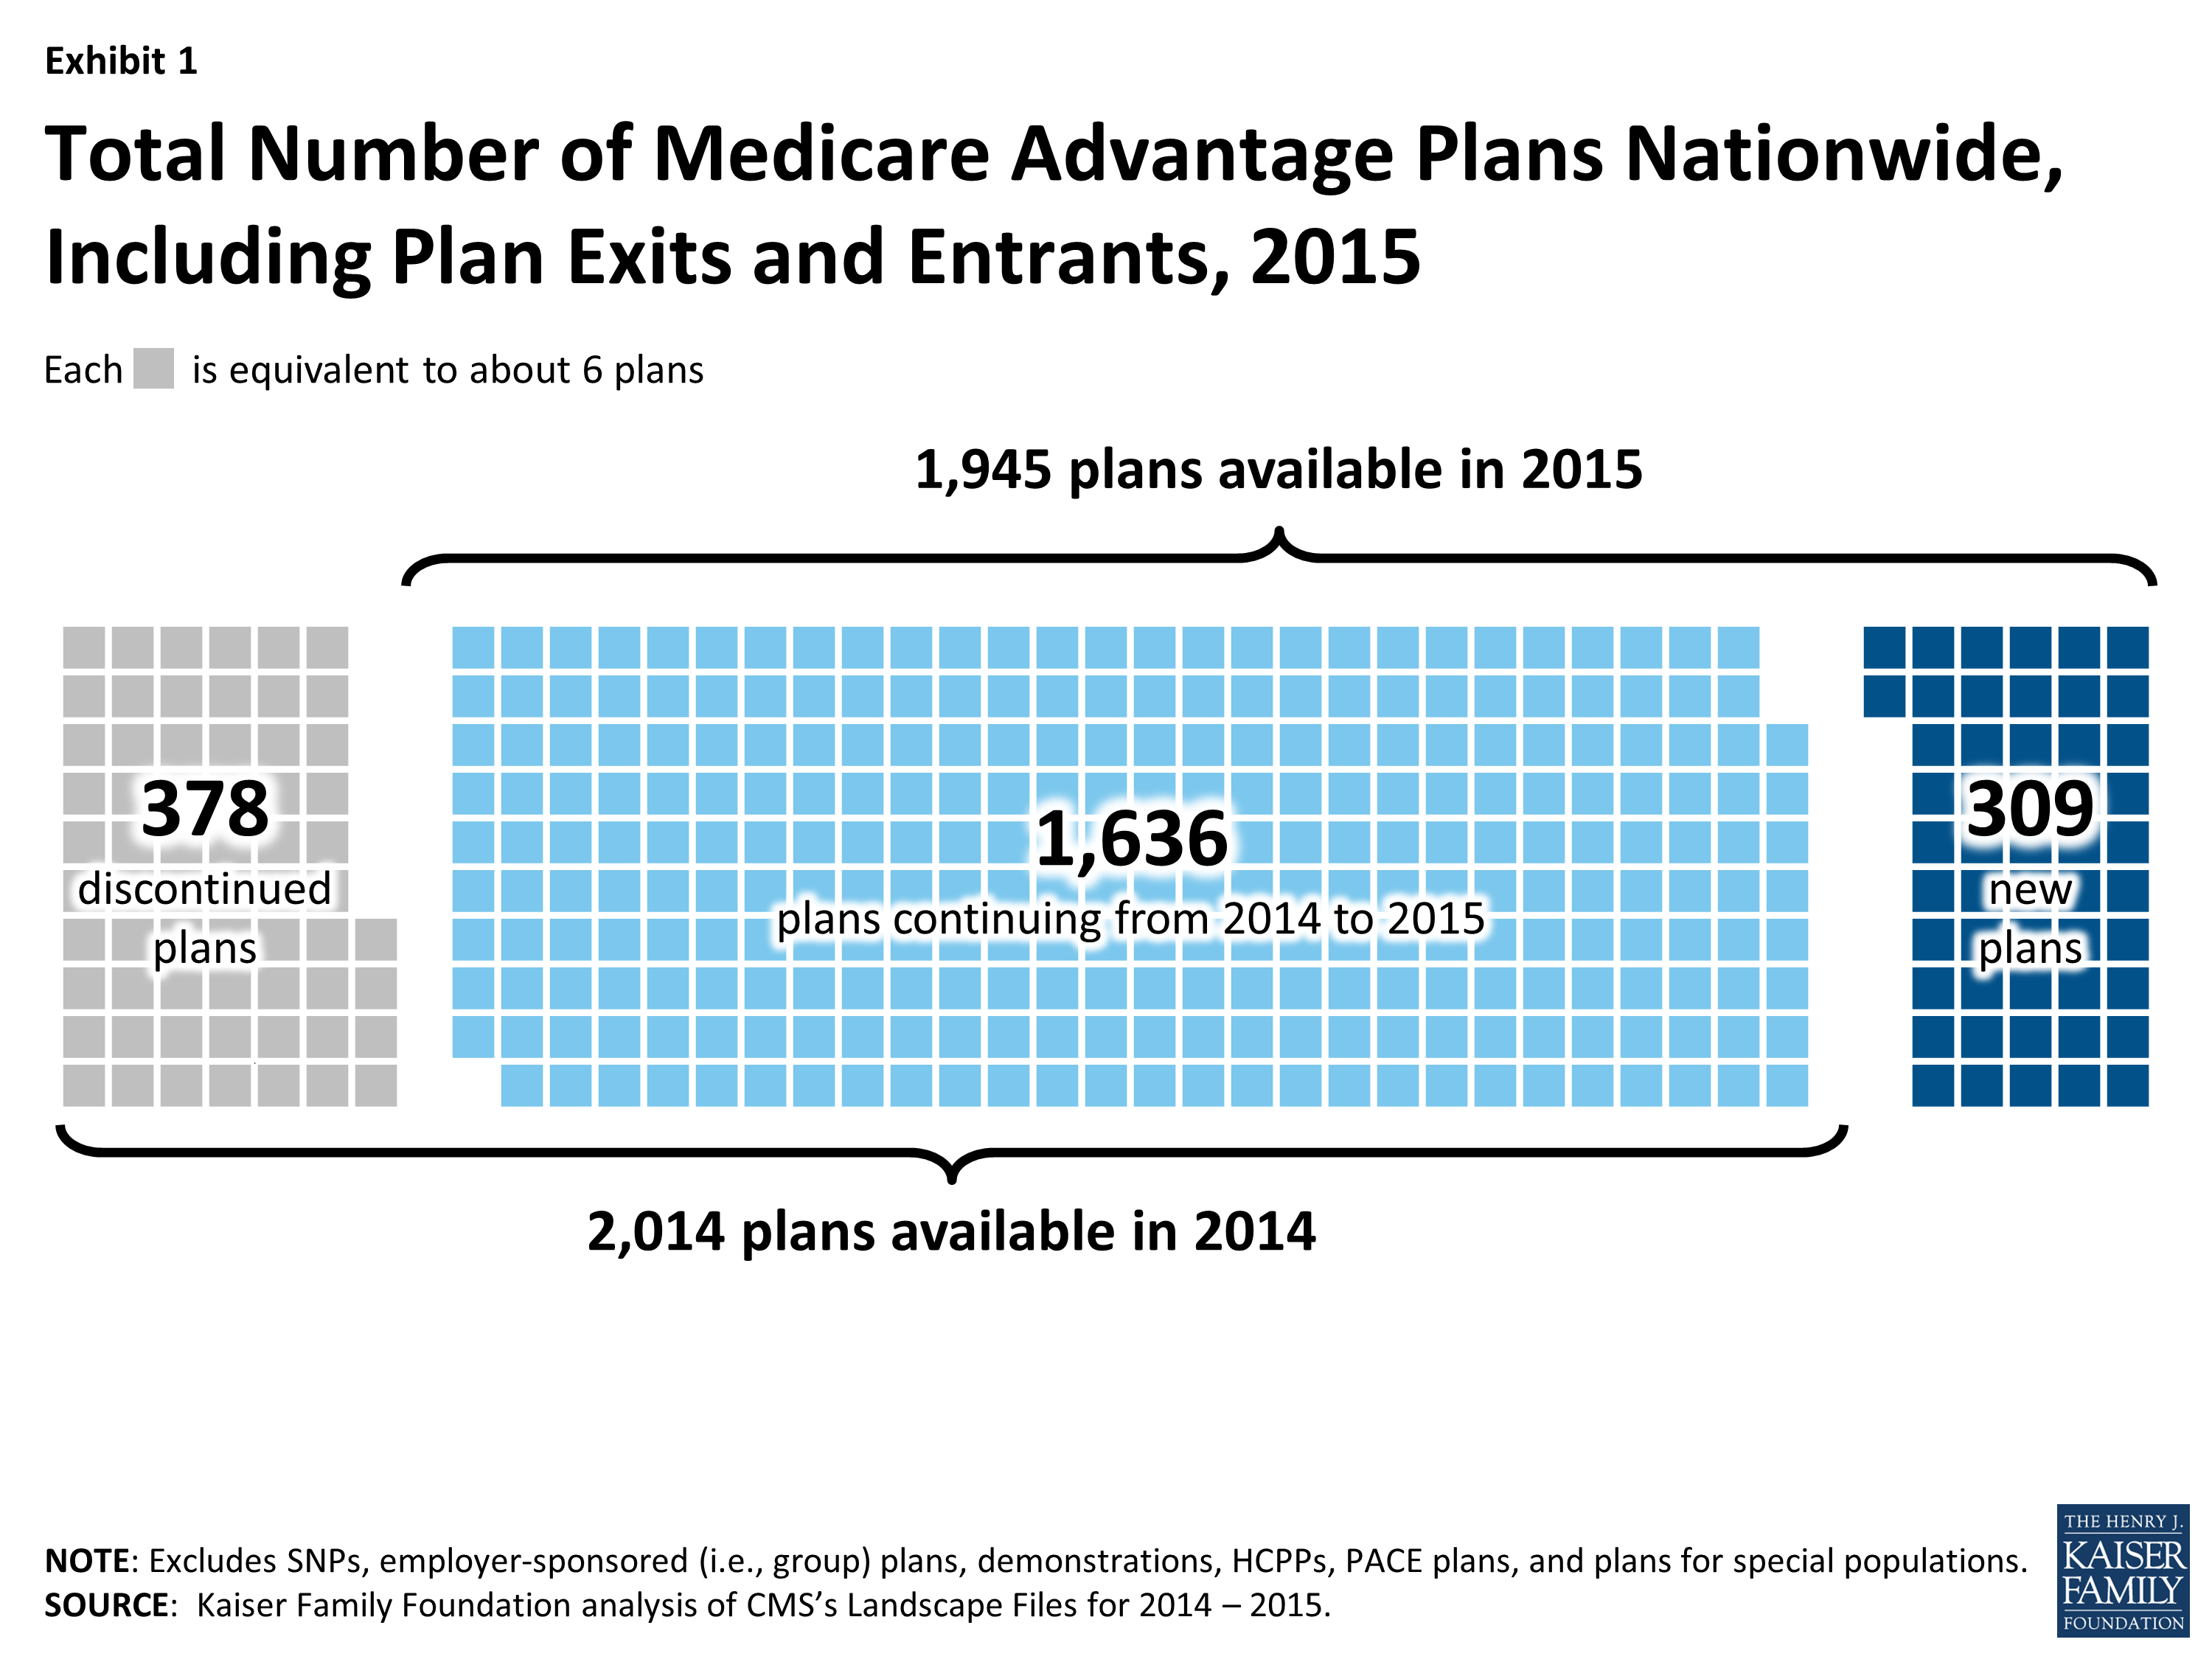
Exhibit 1: Total Number of Medicare Advantage Plans Nationwide, Including Plan Exits and Entrants, 2015
A larger number of plans will exit the market in 2015 than any other year since 2012 (Exhibit 2). At the same time, more Medicare Advantage plans will enter the market in 2015 (309 plans) than in 2014 (289 plans).
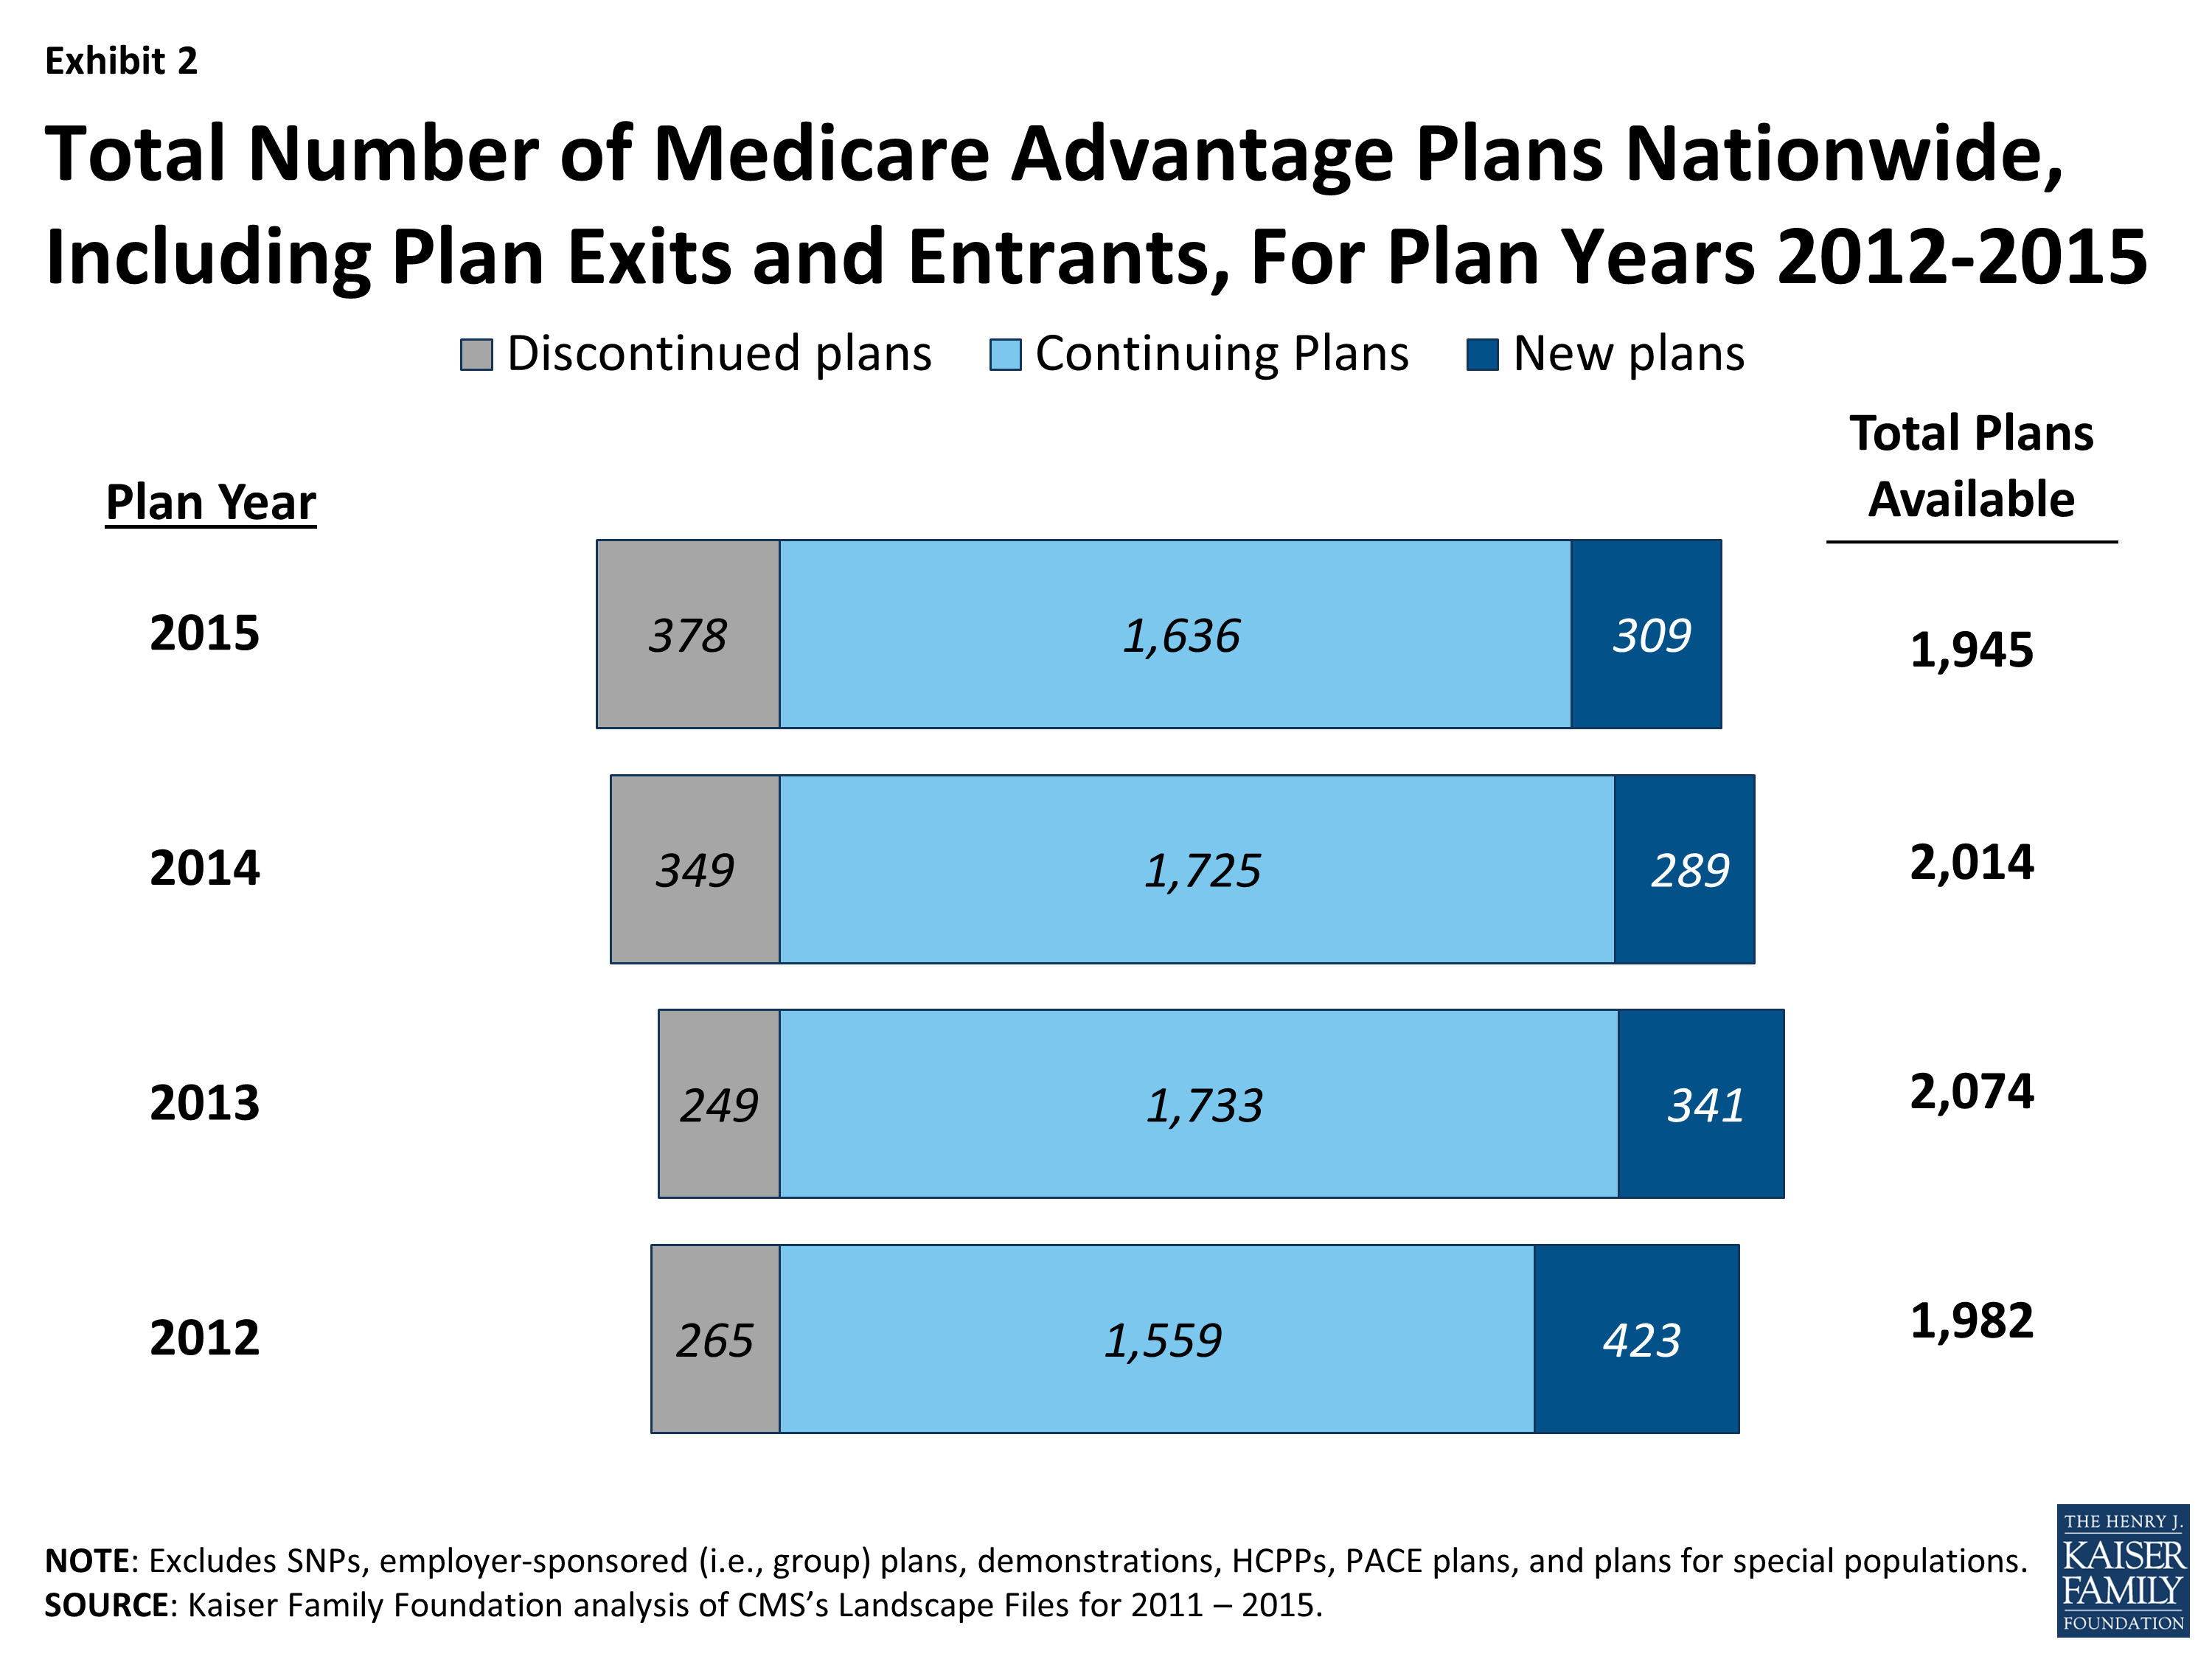
Exhibit 2: Total Number of Medicare Advantage Plans Nationwide, Including Plan Exits and Entrants, For Plan Years 2012-2015
By state. Virtually every state (except for AK and WY) will have some change in plan offerings in 2015. Some states will see more departing plans than new plans, while other states will see more new than departing plans. In most states, the total number of plans offered in 2015 will be similar to the number in 2014. In nine states (AR, FL, GA, NC, PA, SC, VA, VT, and WI), the number of departing plans will exceed the number of new plans by at least 10 plans, while in two states (KY and TN) the number of new plans will exceed the number of departing plans by at least 10 plans in 2015. Beneficiaries in four states (CA, FL, NY, and PA) will see large numbers of both new plans and departing plans (20 or more) for 2015. Overall, relatively few states will see sizeable differences in the number of plans available between 2014 and 2015.
Affected Enrollees
Four percent of Medicare Advantage enrollees (479,832 enrollees) are in plans that are exiting the market at the end of 2014 and will need to find an alternative source of Medicare coverage, either another Medicare Advantage plan or traditional Medicare (Appendix Table 1). Last year, at the end of 2013, a larger number (roughly 526,000 enrollees) and a slightly larger share (about 5%) of the Medicare Advantage population were affected by plan departures.5
The share of Medicare Advantage enrollees affected by plan departures ranges from less than 1 percent in 20 states and the District of Columbia to more than 10 percent in 8 states (CT, HI, ID, MD, MT, NC, NH, VT). In Hawaii, 64 percent of enrollees are in exiting plans, the largest of which is a regional PPO offered by Hawaii Medical Services Association (HMSA), a BlueCross BlueShield affiliate; HMSA will continue to offer local PPOs in all counties of Hawaii.6 In most states, less than 5 percent of Medicare Advantage enrollees will be affected by plan departures. In four states (CA, NC, NY, and PA), a larger number (more than 20,000 enrollees), but a relatively small share of enrollees (less than or equal to 7% in CA, NY, and PA; 17% in NC) are enrolled in plans that will not be offered in 2015. In contrast, in 13 states and the District of Columbia, fewer than 1,000 people are enrolled in plans in 2014 that will not be offered in 2015.
Characteristics of Medicare Advantage Market Exits and Entries
Plan Type. Among departing plans, local PPOs and PFFS (private fee-for-service) plans are disproportionately represented (Exhibit 3). Local PPOs comprise one-quarter (25%) of plans offered in 2014, but one-third (33%) of departing plans in 2015. Similarly, PFFS plans comprise only 6 percent of plans offered in 2014, but 14 percent of departing plans in 2015. In fact, more than four in ten PFFS plans (43%) and more than two in ten local PPOs (24%) are exiting the market in 2015 (Appendix Table 2). The reduction in PFFS plans available between 2014 and 2015 continues the trend in PFFS plan exits that has been observed since the Medicare Improvements for Patients and Providers Act (MIPPA) of 2008 required most PFFS plans to adopt provider networks. PFFS plans have attracted fewer enrollees over the years, dropping from a high of more than 2 million in 2009 to about 300,000 in 2014 – confirming the waning role of PFFS plans in the Medicare Advantage market.
As in prior years, PFFS plans departing the market are expected to be replaced by other plan types. HMOs are disproportionately represented, and comprise 73 percent of the new plans that will be offered in 2015, and comprise 66 percent of all Medicare Advantage plans offered in 2015 (Exhibit 3). In contrast, both regional PPOs and PFFS plans are underrepresented among new plans. These proportions may be reflective of plan choices made by new enrollees in recent years, and business decisions of insurers about the viability and profitability of these products.
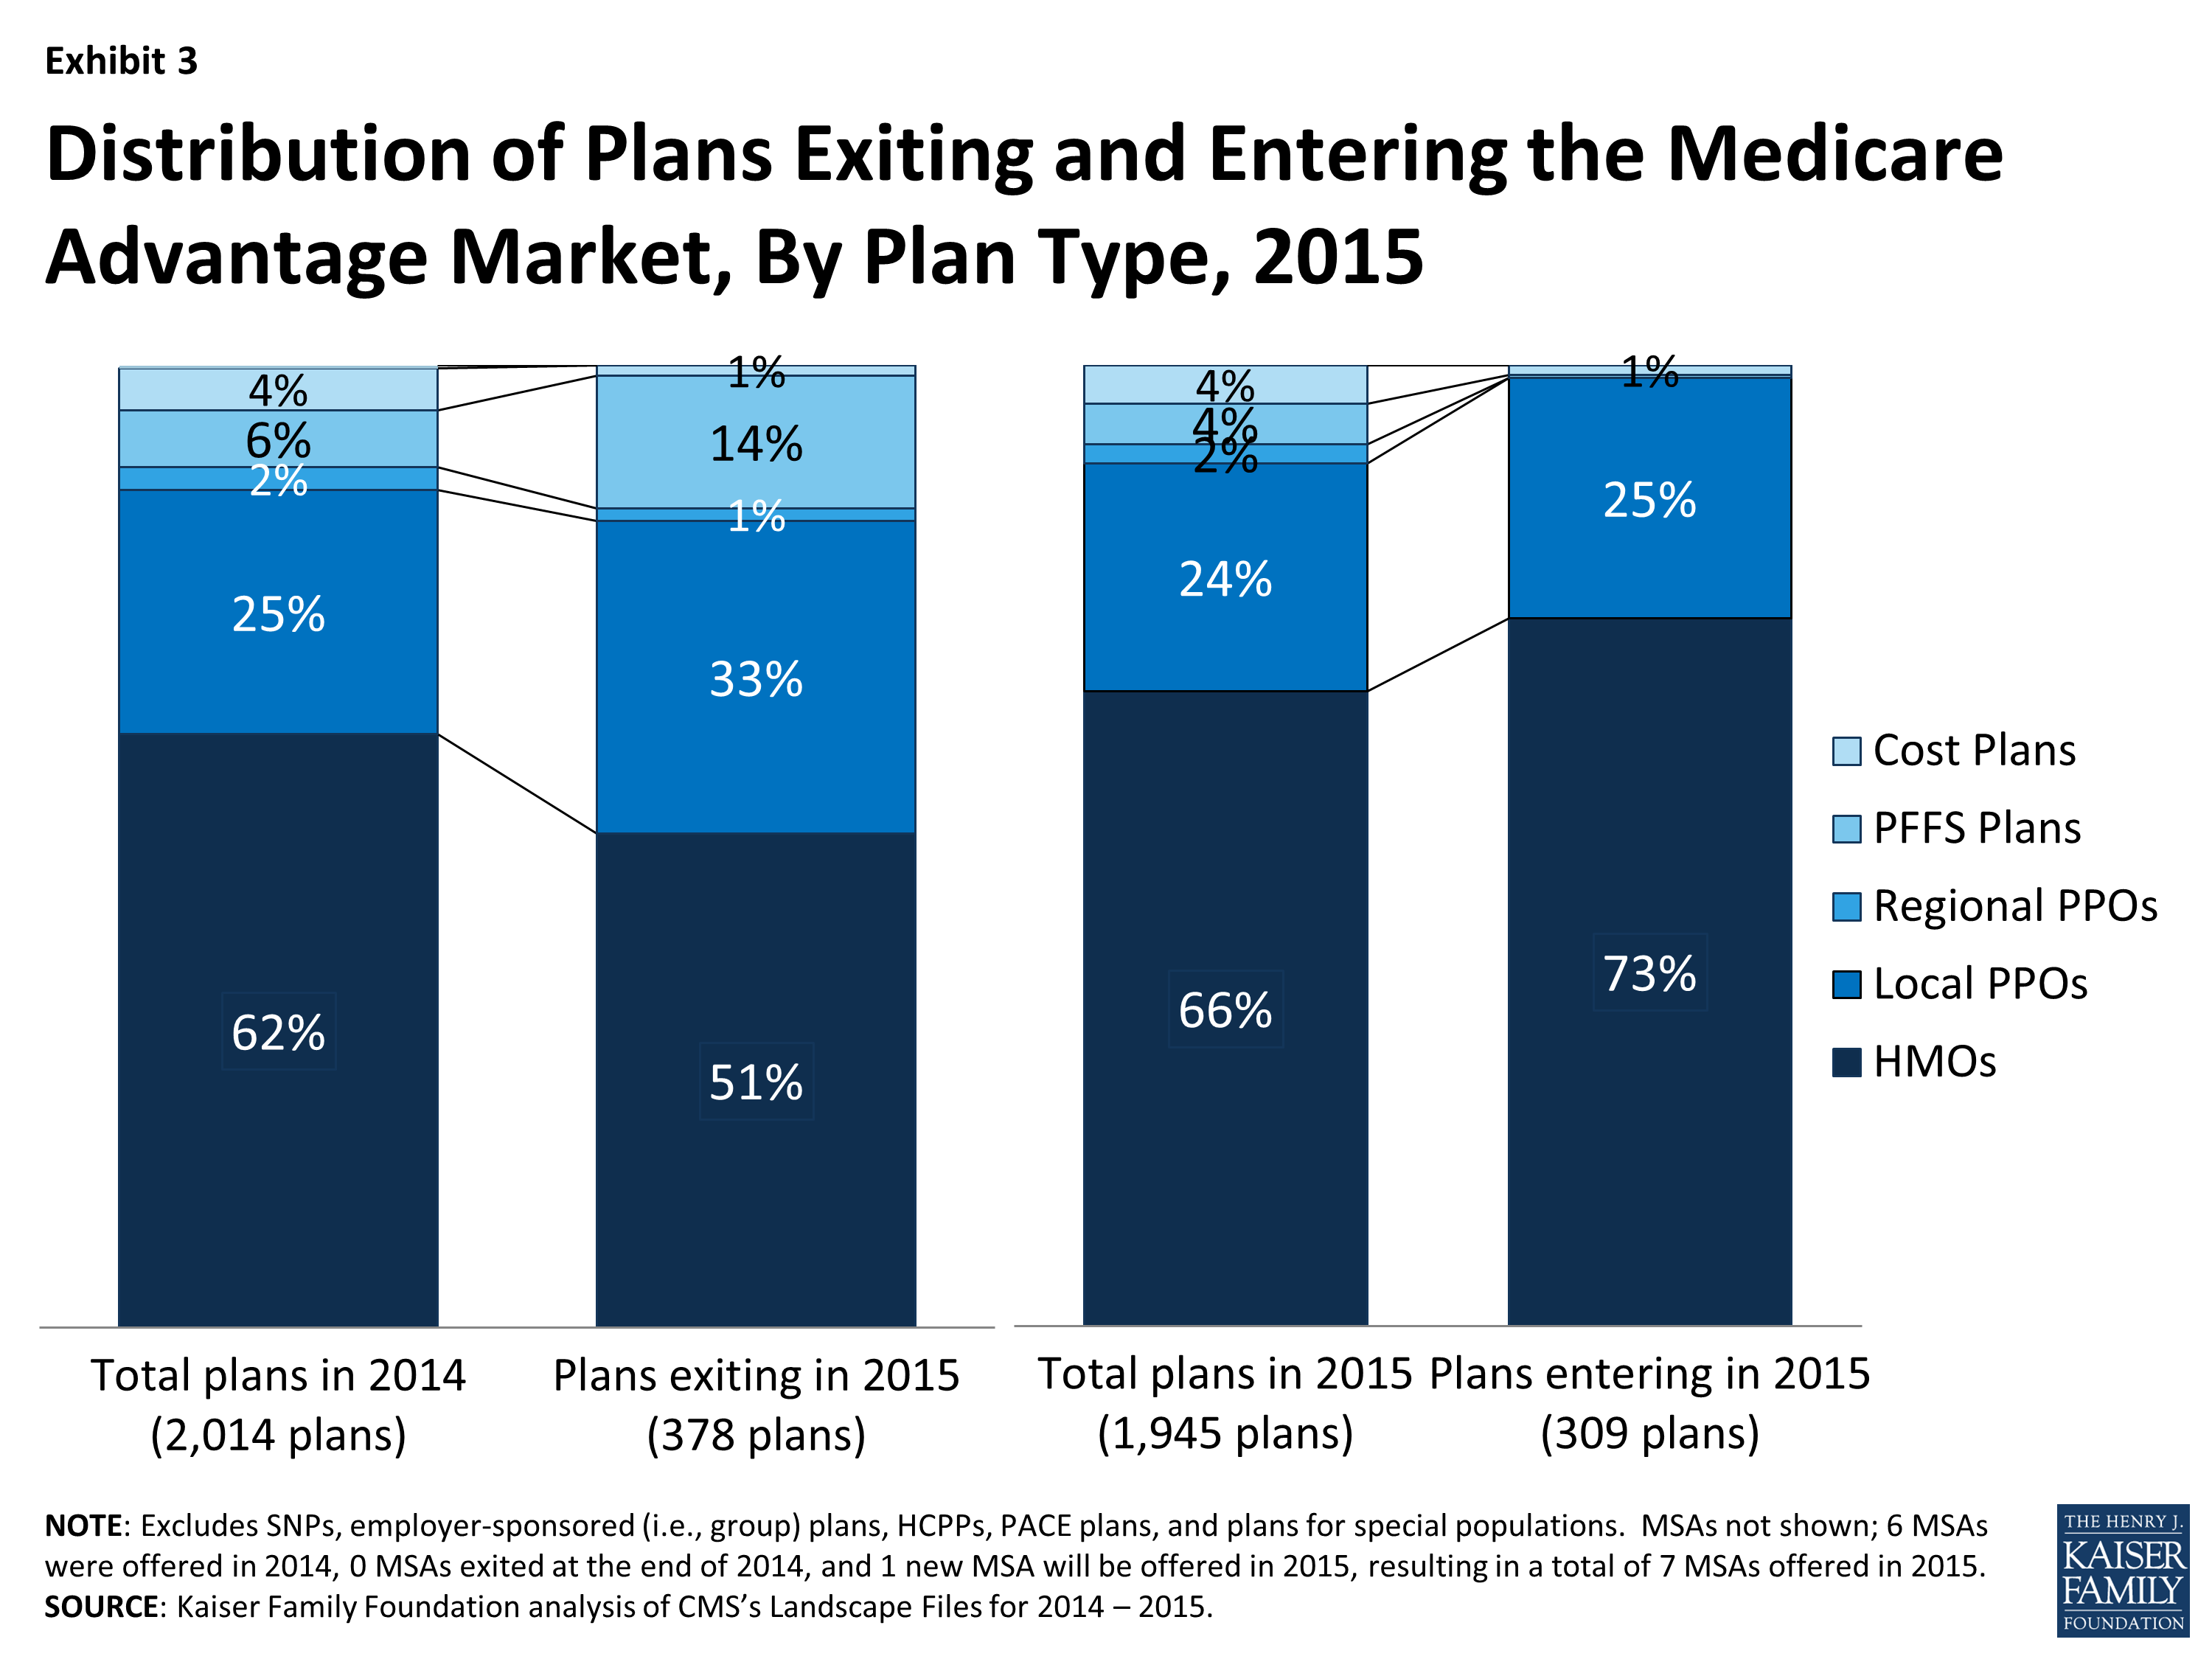
Exhibit 3: Distribution of Plans Exiting and Entering the Medicare Advantage Market, By Plan Type, 2015
Tax Status. The majority of plans departing the market at the end of 2014 are for-profit plans (79%), a share which is similar to the proportion of plans that were for-profit in 2014. Similarly, most new plans are for-profit plans (70%) in 2015. Overall, there were no meaningful differences in the tax status of plans exiting or entering the market.
In addition to plan type and tax status, the analysis looked at whether plans that are exiting the market are disproportionately low enrollment and have lower quality ratings. This part of the analysis includes the 215 plans that are terminating their contract with CMS at the end of 2014, but excludes the plans that will consolidate into new plans, because the plans that are consolidating often have different enrollment levels and star ratings in the various areas in which they serve, which cannot be separately analyzed.
Enrollment. Most of the plans that are departing from the market (excluding those that consolidated into new plans) at the end of 2014, have relatively low enrollment: nearly two-thirds (64 percent) have less than 1,000 enrollees, and about half (51%) have fewer than 500 enrollees in 2014 (Exhibit 4). Plans with fewer than 100 enrollees are disproportionately represented among plans exiting the market; almost three in ten plans with fewer than 100 enrollees (29%) are exiting the market in 2014 (Appendix Table 3). The average number of enrollees in a plan was 5,268 in 2014. Overall, most plans that are exiting the market at the end of 2014 have relatively few enrollees, and few beneficiaries will be affected by the market exits.
Quality Ratings. The majority of plans exiting the market at the end of 2014 have average or below average ratings (Exhibit 4). Most (59%) of the plans terminating their contracts with CMS at the end of 2014 received 3 or 3. 5 stars – ratings for which plans received bonuses in 2014 but will not receive bonuses in 2015 or future years. Among plans with 3 or 3.5 stars, 15 percent are exiting the market at the end of this year. Plans with below average ratings (2 or 2.5 stars) represent a small share of all departing plans, but a disproportionate share (25 percent) of these plans are exiting (Appendix Table 3). In 2015, Medicare beneficiaries will see fewer plans with average or below average ratings.7
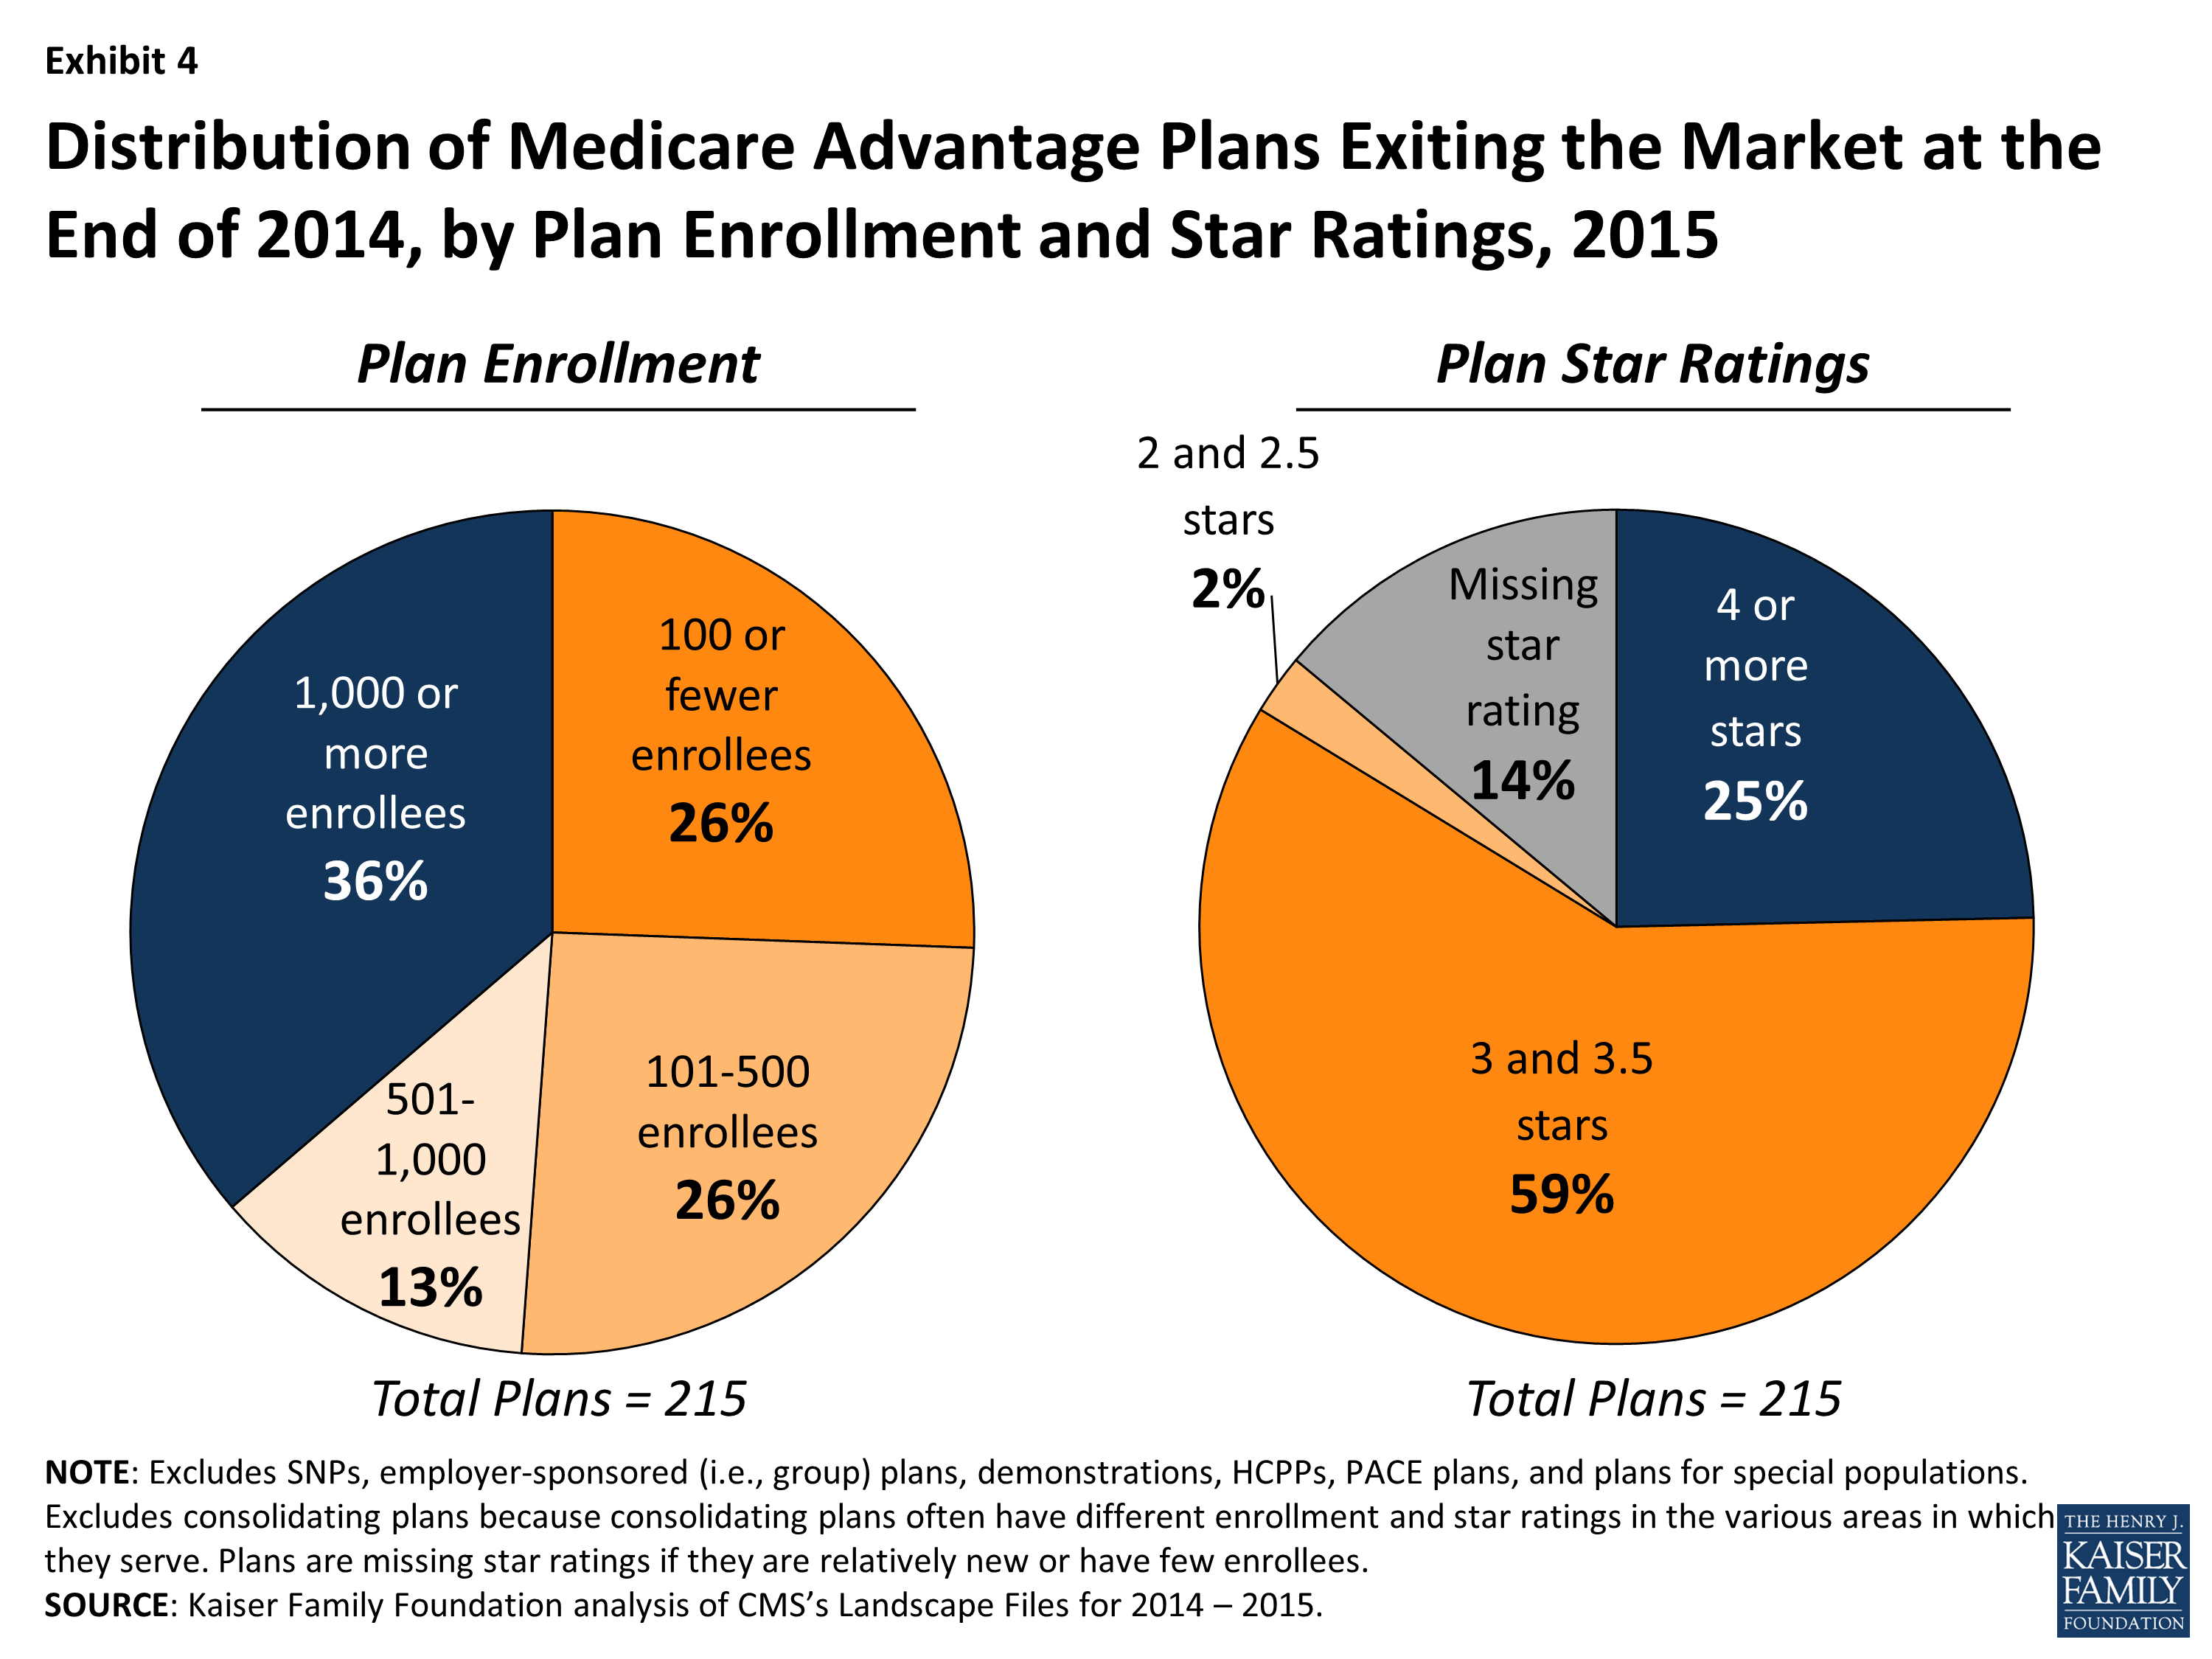
Exhibit 4: Distribution of Medicare Advantage Plans Exiting the Market at the End of 2014, by Plan Enrollment and Star Ratings, 2015
Discussion
While the total number of Medicare Advantage plans offered in counties across the country will be slightly lower in 2015 than in 2014, the vast majority of plans offered in 2015 (84%) were also offered in 2014. As in previous years, some plans will terminate their contracts with Medicare before the end of the year, while others will enter new markets, creating new options for Medicare beneficiaries in those areas.
Plans with relatively low enrollment and plans with average star quality ratings or below comprise the majority of plans exiting the markets. These changes are primarily weeding out plans that did not attract many enrollees and plans that received relatively low quality ratings. The CMS quality-based bonus demonstration will draw to a close at the end of 2014, and only plans with above average ratings (4 or more stars) will receive bonuses in 2015 and future years. This could make it more challenging for plans with fewer stars to compete with higher-rated plans, unless they improve their ratings.
Despite concerns that the ACA would result in a major contraction of Medicare Advantage plans, the 2015 market continues to look robust. While some plans have terminated their contracts with Medicare, most have decided to continue to operate, and others are launching new plans across the country in 2015. Companies may have adjusted their business strategies and tightened their belts in response to the changes in the ACA and the sequestration of Medicare spending put in place under the Budget Control Act of 2011. Virtually all Medicare Advantage enrollees will have the option to stay in the same plan in 2015; just 3 percent of enrollees are in plans that are exiting the market at the end of this year, though this rate will vary somewhat by county. In all likelihood, beneficiaries affected by plan exits will have other Medicare Advantage options available, including new plans vying for beneficiaries, in addition to traditional Medicare.
|
This brief was updated (October 2014) to adjust for the departure of plans from counties and to use September 2014 enrollment; the prior version focused on the departure of plans from states and used enrollment from March 2014. Due to these adjustments, the total number of enrollees affected by plan departures increased from 318,717 to 479,832 Medicare Advantage enrollees nationally, with corresponding changes by state, reflected in Appendix Table 1. |