Medicare Part D: A First Look at Plan Offerings in 2014
The Centers for Medicare & Medicaid Services (CMS) recently released information about the Medicare Part D stand-alone prescription drug plans (PDPs) that will be available in 2014.1 Of the 36 million beneficiaries enrolled in Part D plans, about 63 percent (22.7 million) are in PDPs; the others are enrolled in Medicare Advantage drug plans.2 This Medicare Part D Spotlight provides an overview of the 2014 stand-alone PDP options and key changes from prior years.3
Summary of Key Findings
Medicare Part D continues to be a marketplace with an array of competing plans offered at a wide range of premiums and benefit designs.
- In 2014, Medicare beneficiaries will have a choice of 35 stand-alone PDPs, on average, up by four from 2013. The average premium (weighted by enrollment) is expected to increase by 5 percent across all PDPs from 2013 to 2014 unless many new or current enrollees select lower-priced plans. As in prior years, the average monthly premium for 2014 masks a significant amount of variation across plans. Enrollees in two of the most popular PDPs will experience 50-percent premium increases if they stay in the same plans in 2014, while enrollees in three other popular PDPs will see lower premiums.
- Beneficiaries receiving Low-Income Subsidies (LIS) will have access to a modestly higher number of plans for no monthly premium in 2014 compared to 2013, but some plans have lost their so-called “benchmark” status for 2014, which will require enrollees to switch plans to maintain the full value of their subsidies.
- The majority of plans offered in 2014 will offer no gap coverage beyond that which is required by the Affordable Care Act (ACA) of 2010, which phases out the coverage gap by 2020. Under current law, for 2014, manufacturer prices for brand-name drugs purchased in the gap will be discounted by 50 percent (with plans paying 2.5 percent and enrollees paying the other 47.5 percent), and plans will pay 28 percent of the cost for generic drugs in the gap (with enrollees paying 72 percent).
- Notable trends for 2014 include a growing share of PDPs using preferred pharmacy networks and adopting more formulary cost-sharing tiers. For example, a majority of PDPs now use preferred pharmacy networks where cost sharing is lower when enrollees use preferred pharmacies and higher outside the preferred network. In 2006, few PDPs used this type of pharmacy network.
Key Findings
Part D Plan Availability
In 2014, a total of 1,169 PDPs will be offered nationwide, up by 13 percent from the 1,031 PDPs offered in 2013.
- Despite the increase in PDPs available in 2014, this total represents 706 fewer PDPs than the peak level in 2007 of 1,875 plans. (Exhibit 1)
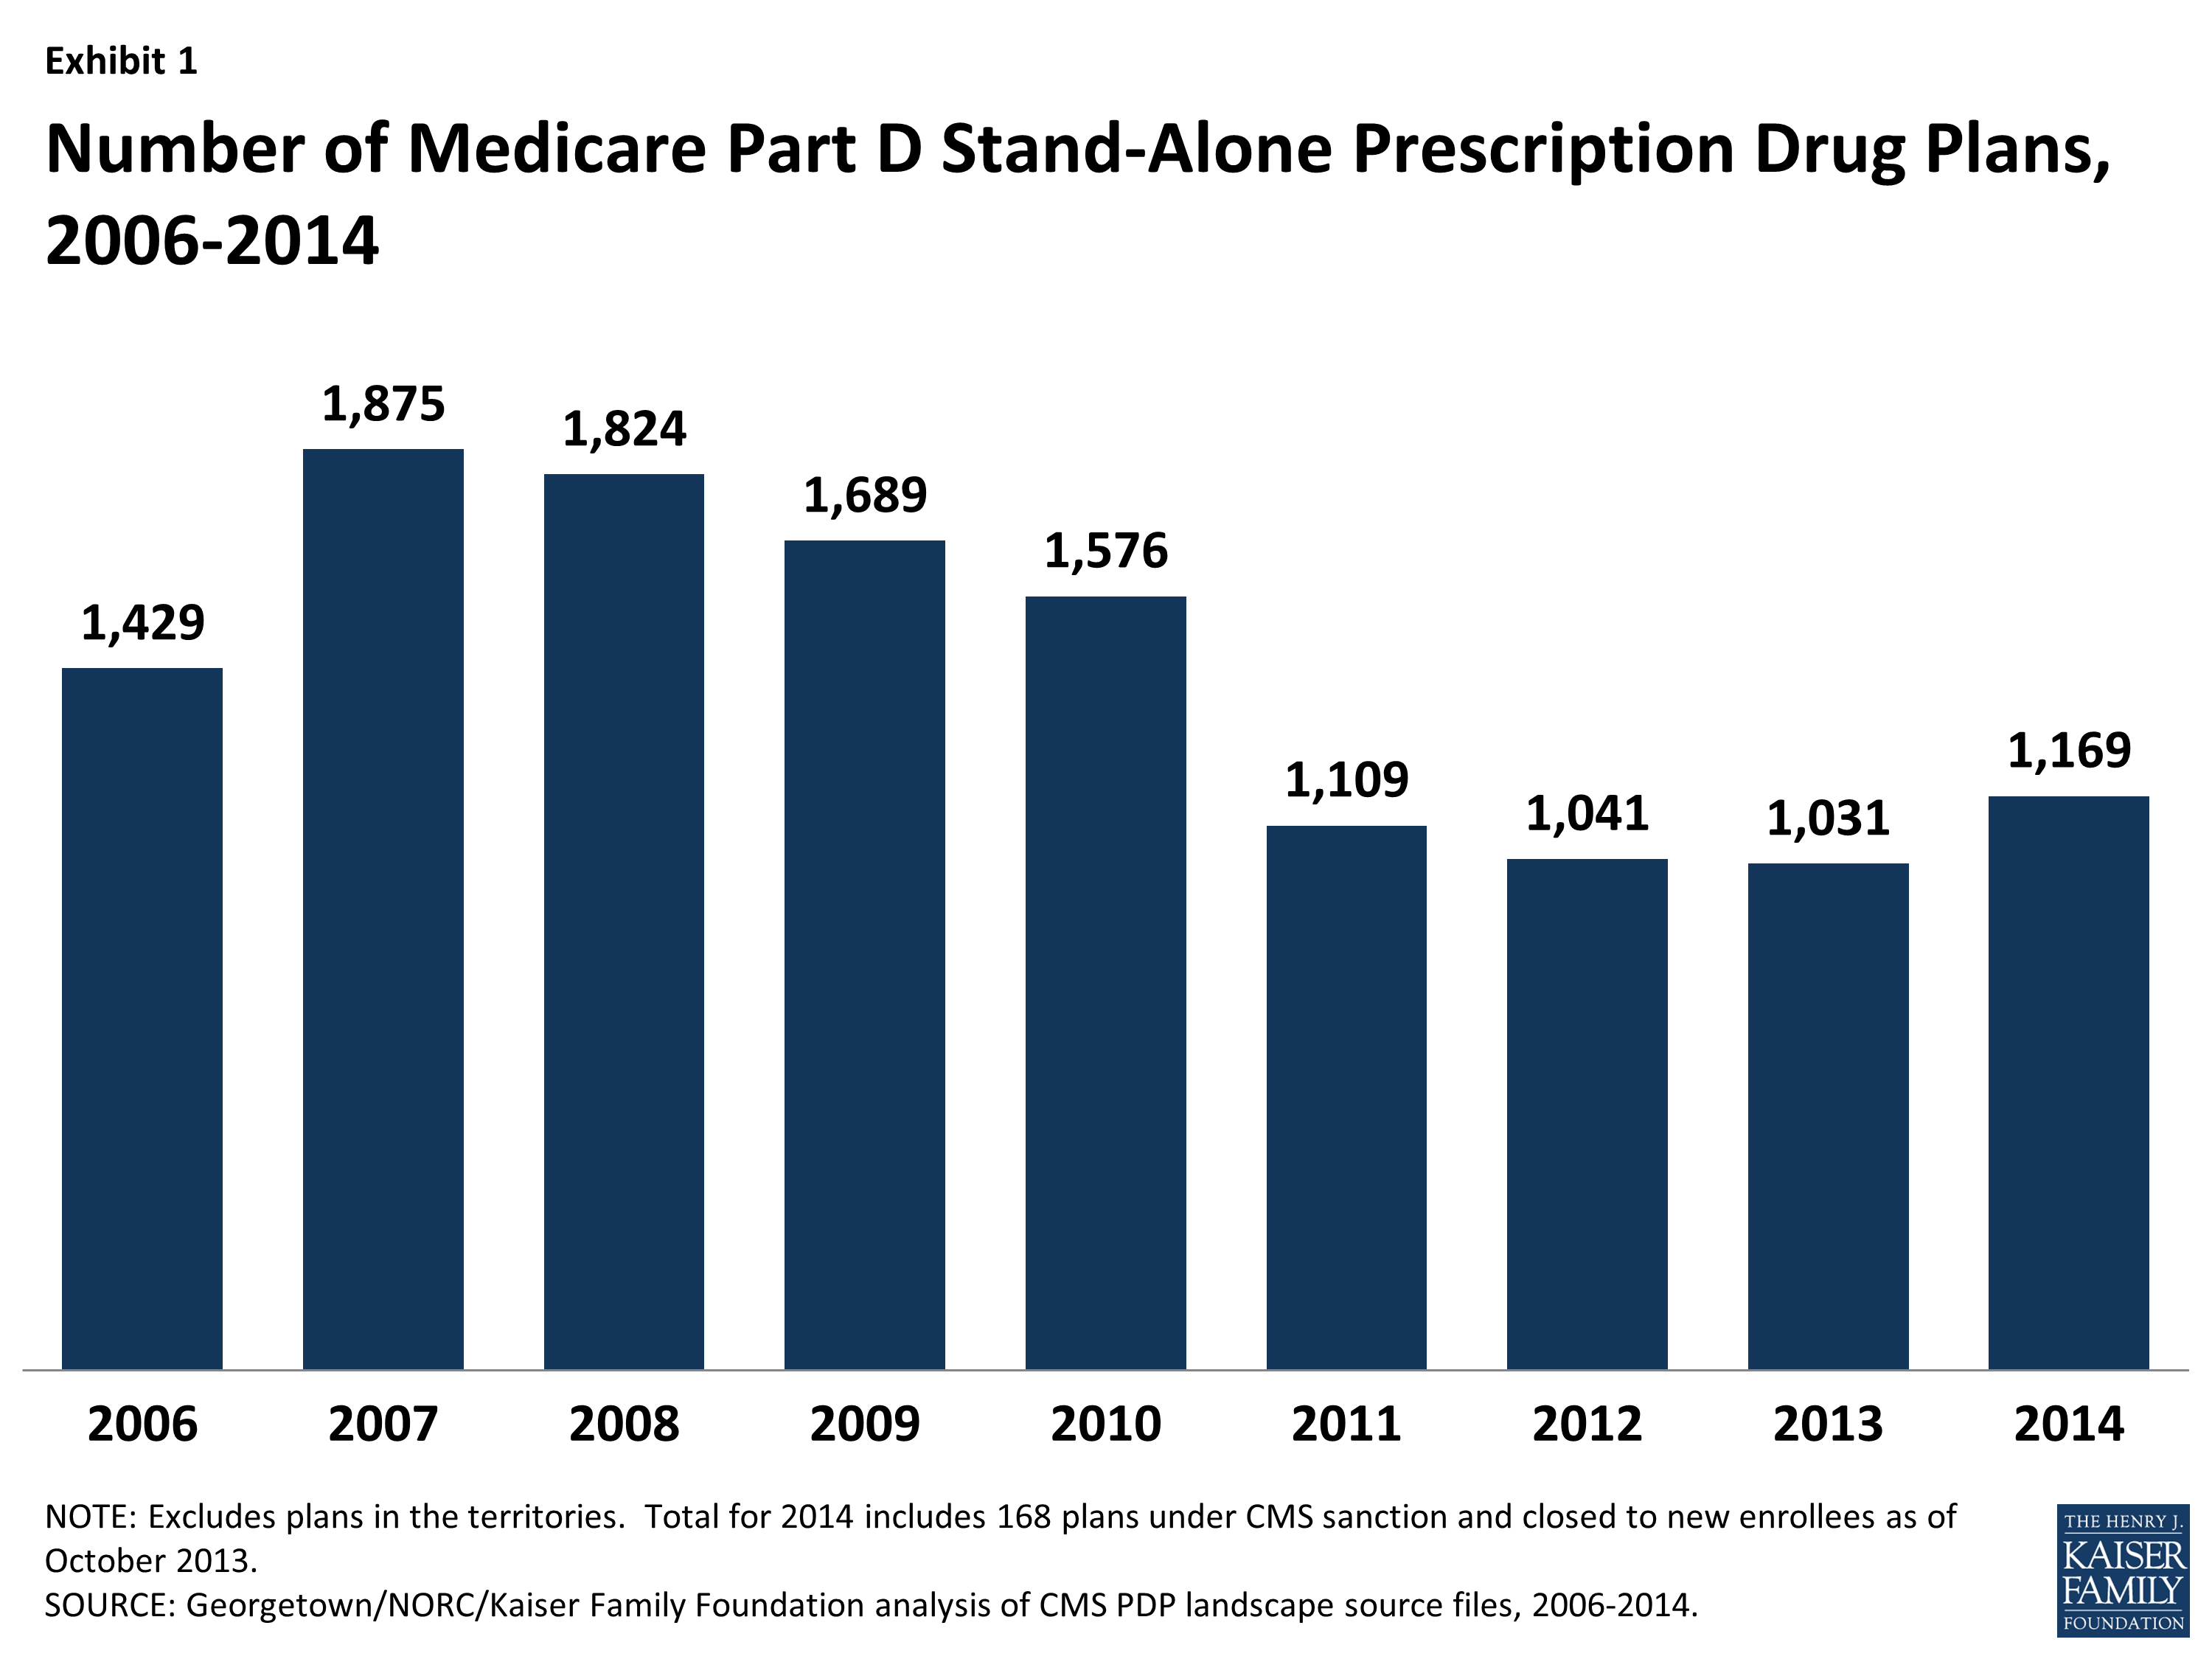
Exhibit 1. Number of Medicare Part D Stand-Alone Prescription Drug Plans, 2006-2014
Beneficiaries across the country continue to have a substantial number of Part D plan choices. The average beneficiary will have a choice of 35 stand-alone PDPs in 2014.
- The number of PDPs per region in 2014 will range from a low of 28 PDPs in the Alaska region to a high of 39 PDPs in the Pennsylvania/West Virginia region. The number of plans is higher in every region compared to 2013; for example, up by five in Alaska and by one in Pennsylvania/West Virginia. (Exhibit 2; Appendix 1, Table A1)
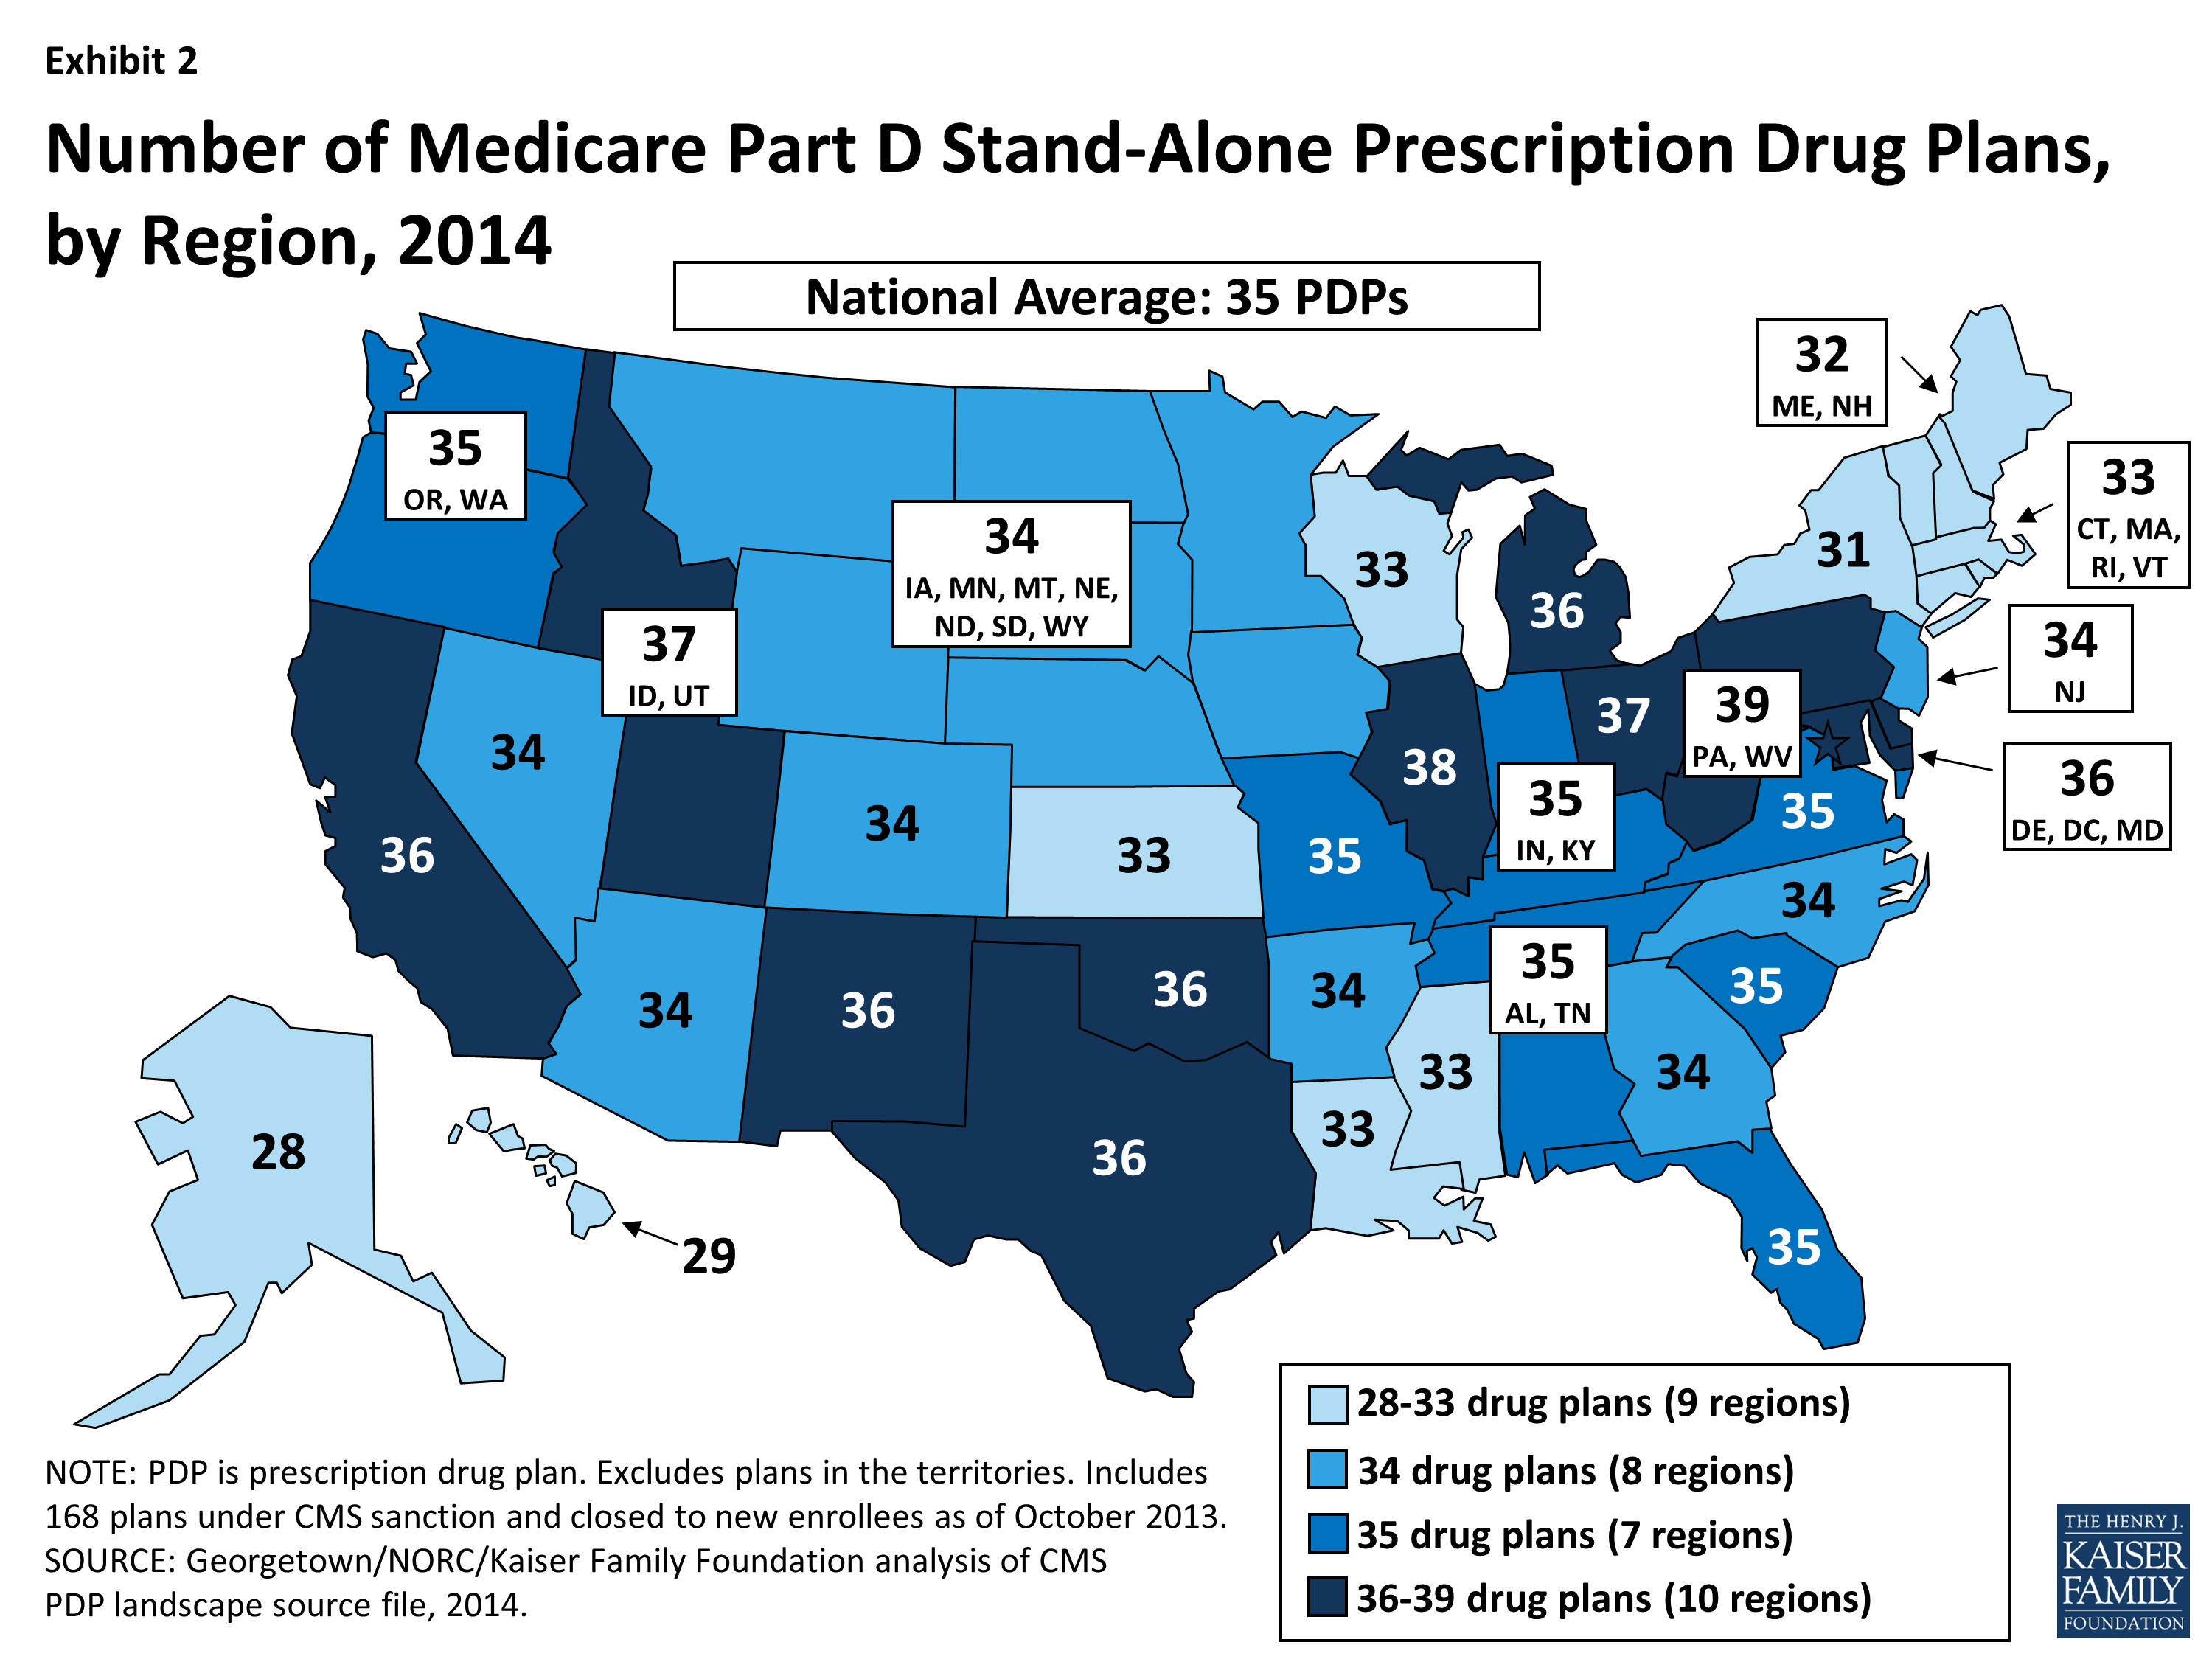
Exhibit 2. Number of Medicare Part D Stand-Alone Prescription Drug Plans, by Region, 2014
Inside the Part D marketplace in 2014, 212 new PDPs entered the market and 46 PDPs exited the market entirely. Most of the plan exits are from one company (EnvisionRx), which eliminated its enhanced plan option that currently has only about 7,300 enrollees across 34 regions. Of the new PDP entrants, about half are PDPs offered by plans sponsors new to the PDP market, while others are new offerings by existing plan sponsors; 28 are replacing PDPs offered by the same sponsor.
- Two new plan sponsors are entering the program with a broad set of 2014 plan offerings: Smartbridge Life Insurance Company will offer two Transamerica MedicareRx PDPs in all regions except New York; and Symphonix Heath has a new PDP in 30 regions, co-branded with RiteAid pharmacies in 18 regions.
- Humana is reorganizing its PDP offerings for 2014 by discontinuing the Humana Complete PDPs, which have been in the program since 2006; rebranding the Humana Walmart-Preferred PDPs, introduced in 2011, as Humana Preferred Rx Plans; and introducing a set of new PDPs: the Humana Walmart Rx Plans, priced at $12.60 per month in most regions (the lowest-priced plan nationwide, excluding the territories). Both PDPs will use preferred pharmacy networks.4
- Cigna has restructured its PDP offerings and added offerings so that three PDPs are available in each region. In addition, Cigna offers a fourth PDP in each region as a result of its 2012 acquisition of HealthSpring; these PDPs have been rebranded as Cigna-HealthSpring Rx PDPs.
- Both the SilverScript PDPs, offered by CVS Caremark in all 34 regions with 3.4 million enrollees, and the SmartD Rx PDPs, a new national PDP offering in 2013 with about 88,000 enrollees, were placed under sanctions that ban any new enrollment and all marketing activities. CVS Caremark has indicated that it expects to remain under sanction throughout this year’s annual enrollment period. SmartD was acquired by Express Scripts in September.
Monthly Premiums
The projected average monthly PDP premium for 2014 will be $39.90 (weighted by 2013 enrollment, assuming beneficiaries remain in their current plan).5 This is a 5 percent increase ($1.76) from the weighted average monthly premium of $38.14 in 2013, and a 54 percent increase from $25.93 in 2006, the first year of the Medicare Part D drug benefit. Average monthly premiums (weighted by enrollment) for PDPs have risen every year since 2006, except for a modest drop between 2011 and 2012. (Exhibit 3)
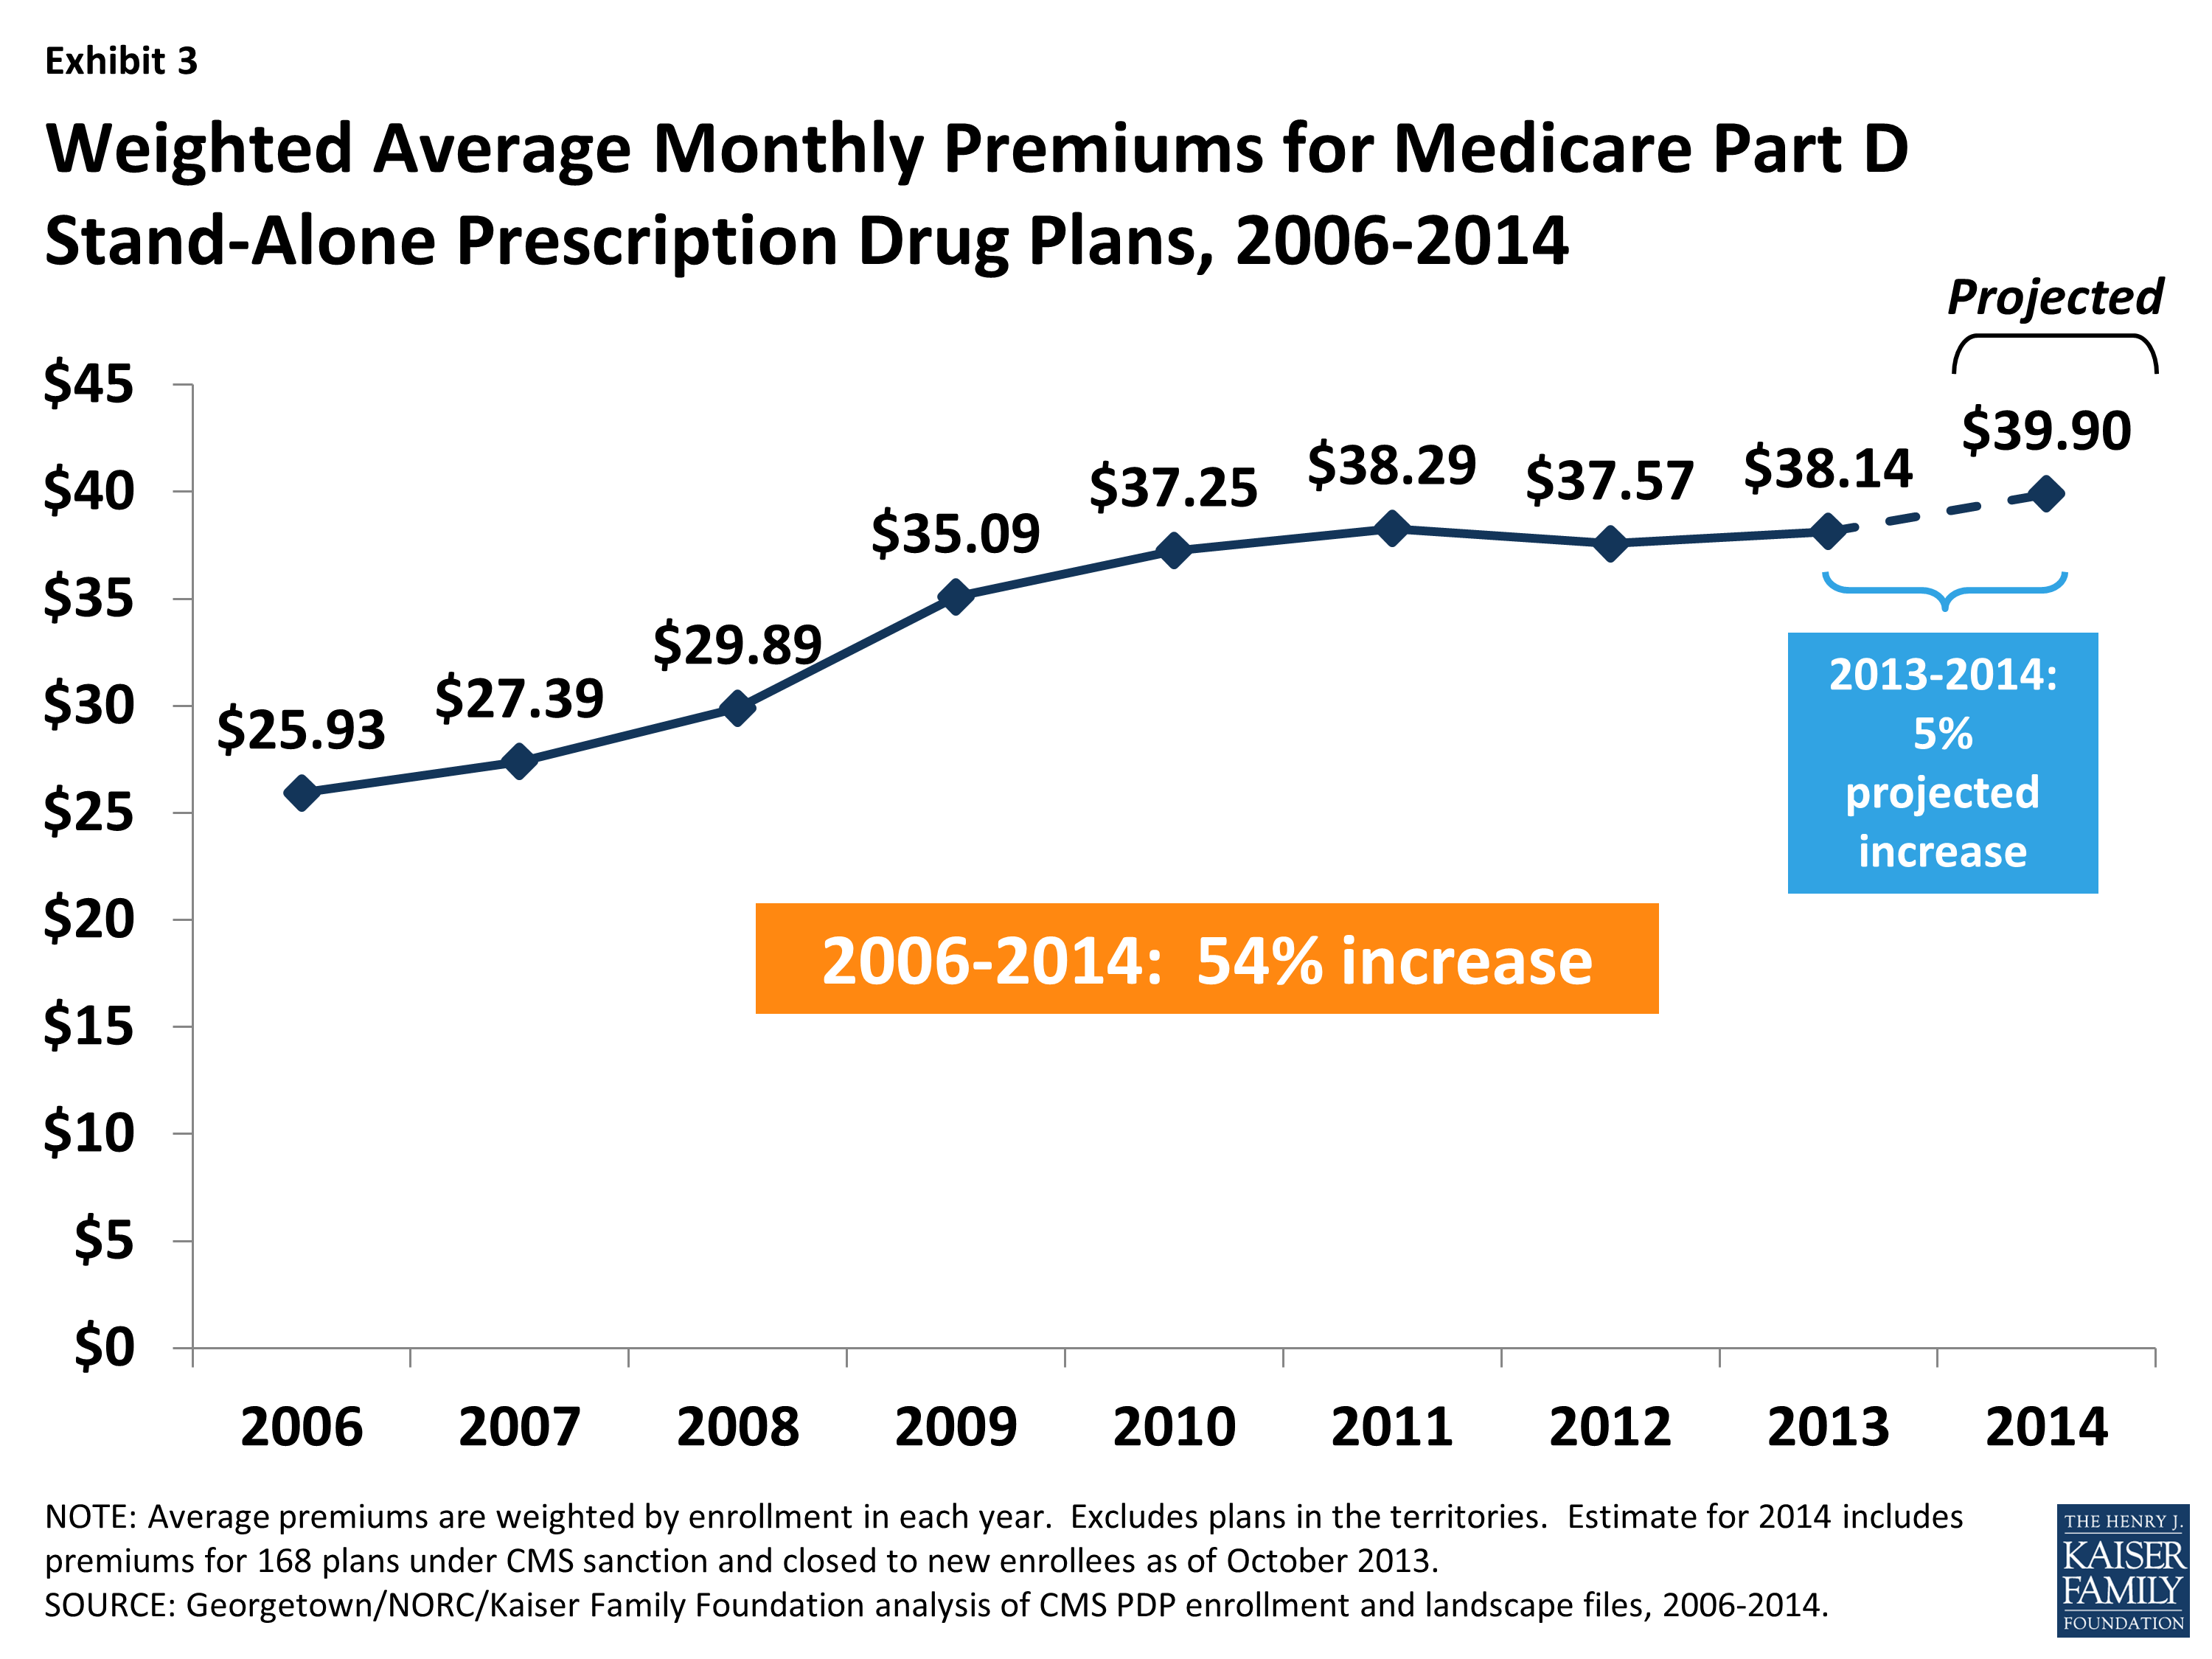
Exhibit 3. Weighted Average Monthly Premiums for Medicare Part D Stand-Alone Prescription Drug Plans, 2006-2014
CMS has reported that the average premium for standard Part D coverage offered by PDPs and Medicare Advantage drug plans between 2013 and 2014 is increasing by about $1; the higher premium increase reported here is based on PDPs only, excluding Medicare Advantage drug plans, and also includes PDPs offering enhanced coverage, which typically have higher premiums. For PDPs offering only the basic benefit in both years, the 2014 premium is projected to be 1 percent lower than in 2013 (based on current enrollment patterns), whereas premiums for enhanced PDPs are projected to rise by about 10 percent. Enrollment changes during the annual enrollment period—in particular, switches to newly available lower-premium PDPs—are likely to reduce modestly the weighted average increase reported here.
Underneath these overall program trends, there is wide variation across plans in premium changes from 2013 to 2014, with a greater share of enrollees projected to pay more per month if they stay in their current plans than the share expected to pay less or a similar amount.
- A majority of all PDP enrollees (58 percent) are projected to pay at least $1 more per month if they stay in their current plans; this includes 14 percent (2.5 million beneficiaries) who will experience an increase of more than $10 in their monthly plan premium in 2014 unless they select a less expensive plan and another 44 percent who would pay from $1 to $10 more if they remain in their current plan in 2014.6 (Exhibit 4)
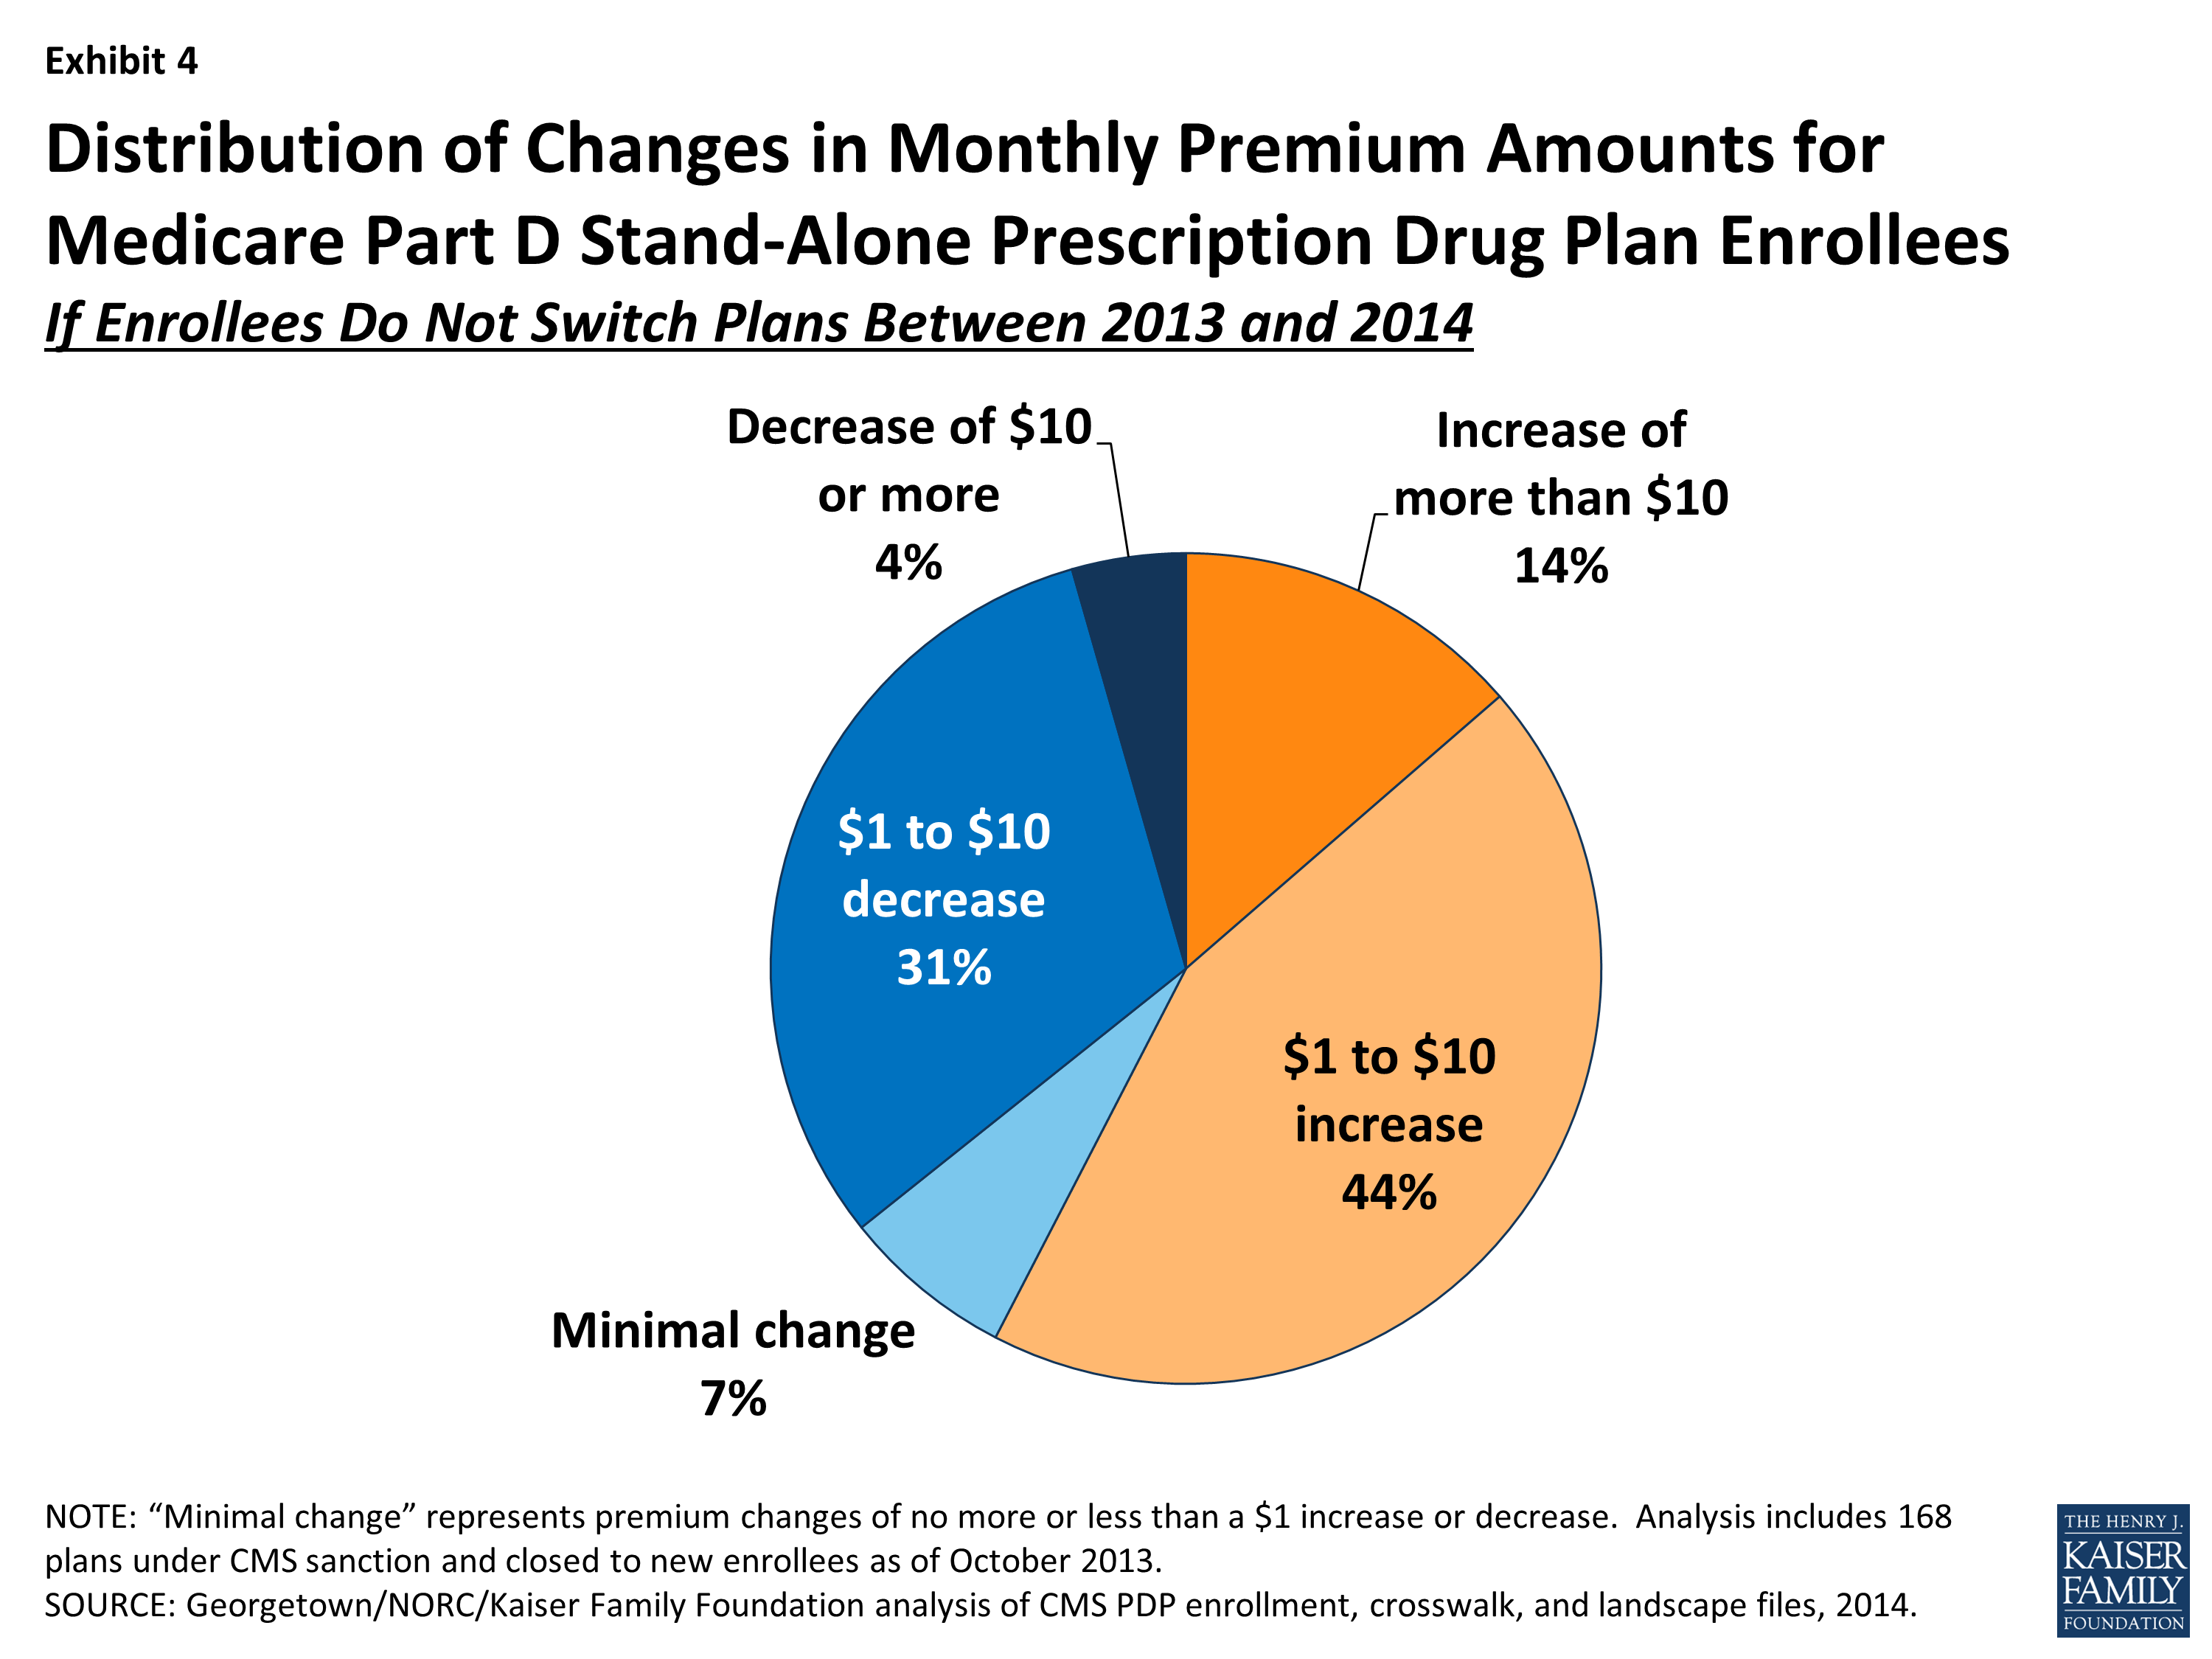
Exhibit 4. Distribution of Changes in Monthly Premium Amounts for Medicare Part D Stand-Alone Prescription Drug Plan Enrollees
- By contrast, 35 percent of all PDP enrollees are projected to see a decrease of $1 per month or more if they stay in their current plans in 2014; this includes 4 percent of PDP enrollees (approximately 800,000 beneficiaries) who would see premium reductions of at least $10 if they stay with their current PDPs, and another 31 percent who would experience a premium decrease of between $1 and $10.
- The remaining 7 percent of PDP enrollees will face a nominal change in their monthly premium (no more or less than a $1 increase or decrease) if they stay in their current plan in 2014.
Changes to premiums from 2013 to 2014, averaged across regions and weighted by 2013 enrollment, vary widely across some of the most popular Part D PDPs. (Exhibit 5)
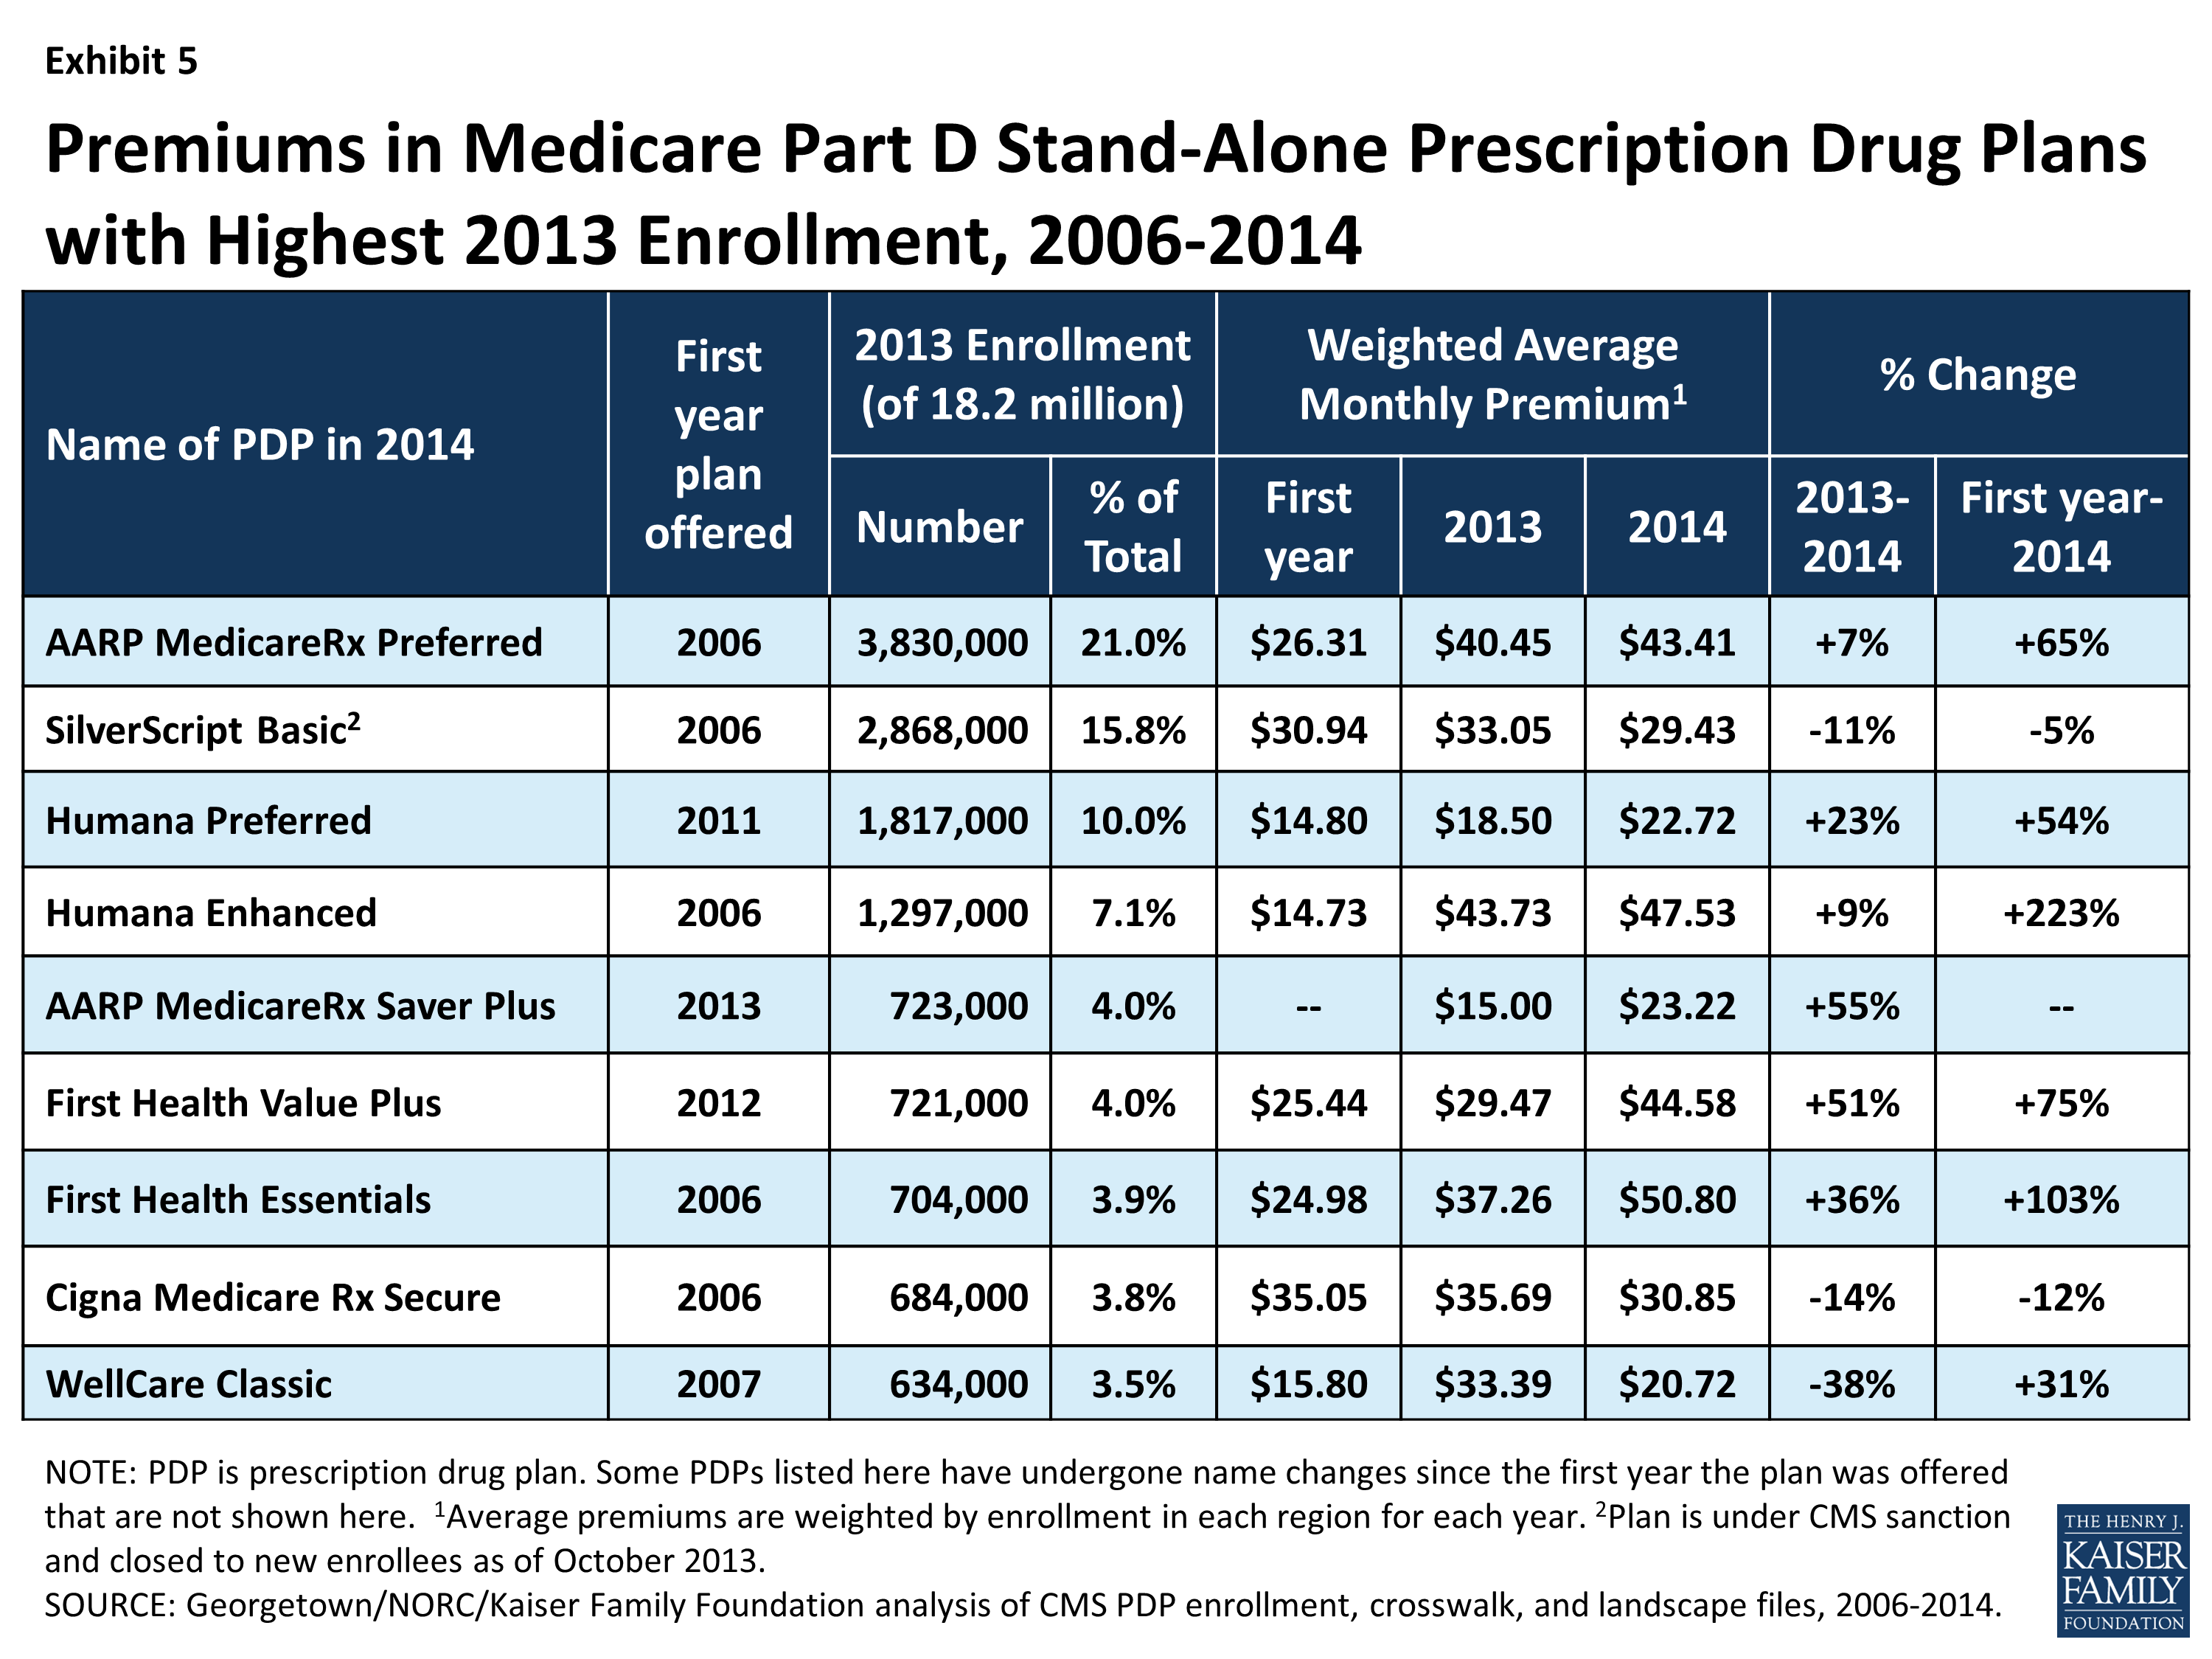
Exhibit 5. Premiums in Medicare Part D Stand-Alone Prescription Drug Plans with Highest 2013 Enrollment, 2006-2014
- Premiums for two of the largest PDPs will increase by more than 50 percent next year. United HealthCare’s AARP Medicare Rx Saver Plus, which was new to the market in 2013 and had the lowest premium in all regions, is increasing its average monthly premium by 55 percent from $15.00 to $23.22—still well below the national average but no longer the nation’s least expensive PDP. First Health Value Plus, which was new to the market in 2012 and now operated by Aetna, is increasing its average premium by 51 percent from $29.47 to $44.58.
- Enrollees in two other large PDPs will face a double-digit percentage increase, on average, in their monthly premium between 2013 and 2014 if they stay in the same plan: First Health Essentials (formerly First Health Premier), with a 36 percent increase (from $37.26 to $50.80), and Humana Preferred Rx Plan (formerly Walmart-Preferred), with a 23 percent increase (from $18.50 to $22.72).
- By contrast, enrollees in another three of the largest PDPs will experience a double-digit percentage decrease, on average, in their monthly premium if they stay in the same plan: Wellcare Classic (38 percent lower, from $33.39 to $20.72), Cigna Medicare Rx Secure (formerly Plan One) (14 percent lower, from $35.69 to $30.85), and SilverScript Basic (11 percent lower, from $33.05 to $29.43).
Looking at the weighted average premium changes over the longer term in the most popular PDPs that have been available since the start of the Part D program in 2006:
- The average premium for Humana PDP Enhanced, although up just 9 percent over 2013, is more than three times as large as it was in 2006, having increased from $14.73 to $47.53.
- The average premium for the PDP with the most enrollees in 2013, UnitedHealth’s AARP Preferred MedicareRx PDP, has increased 65 percent since 2006 (from $26.31 to $43.41), close to the program’s overall average premium increase of 54 percent.
- By contrast, the monthly premium for SilverScript Basic, operated by CVS Caremark, is 5 percent lower in 2014 ($29.43) than it was in 2006 ($30.94).
Average PDP monthly premiums, weighted by 2013 enrollment, will vary widely in 2014 across regions, ranging from $27.99 per month for PDPs in the New Mexico region (one of only four regions with an average under $35) to $46.53 per month for PDPs in the Idaho/Utah region and $45.04 in South Carolina. (Appendix 1, Table A2)
- Premium changes from 2013 to 2014 vary considerably by region. For example, average premiums in four regions are projected to fall slightly, whereas the highest average premium increases across regions will be 16 percent and 15 percent in Colorado and Nevada, respectively. (Exhibit 6)
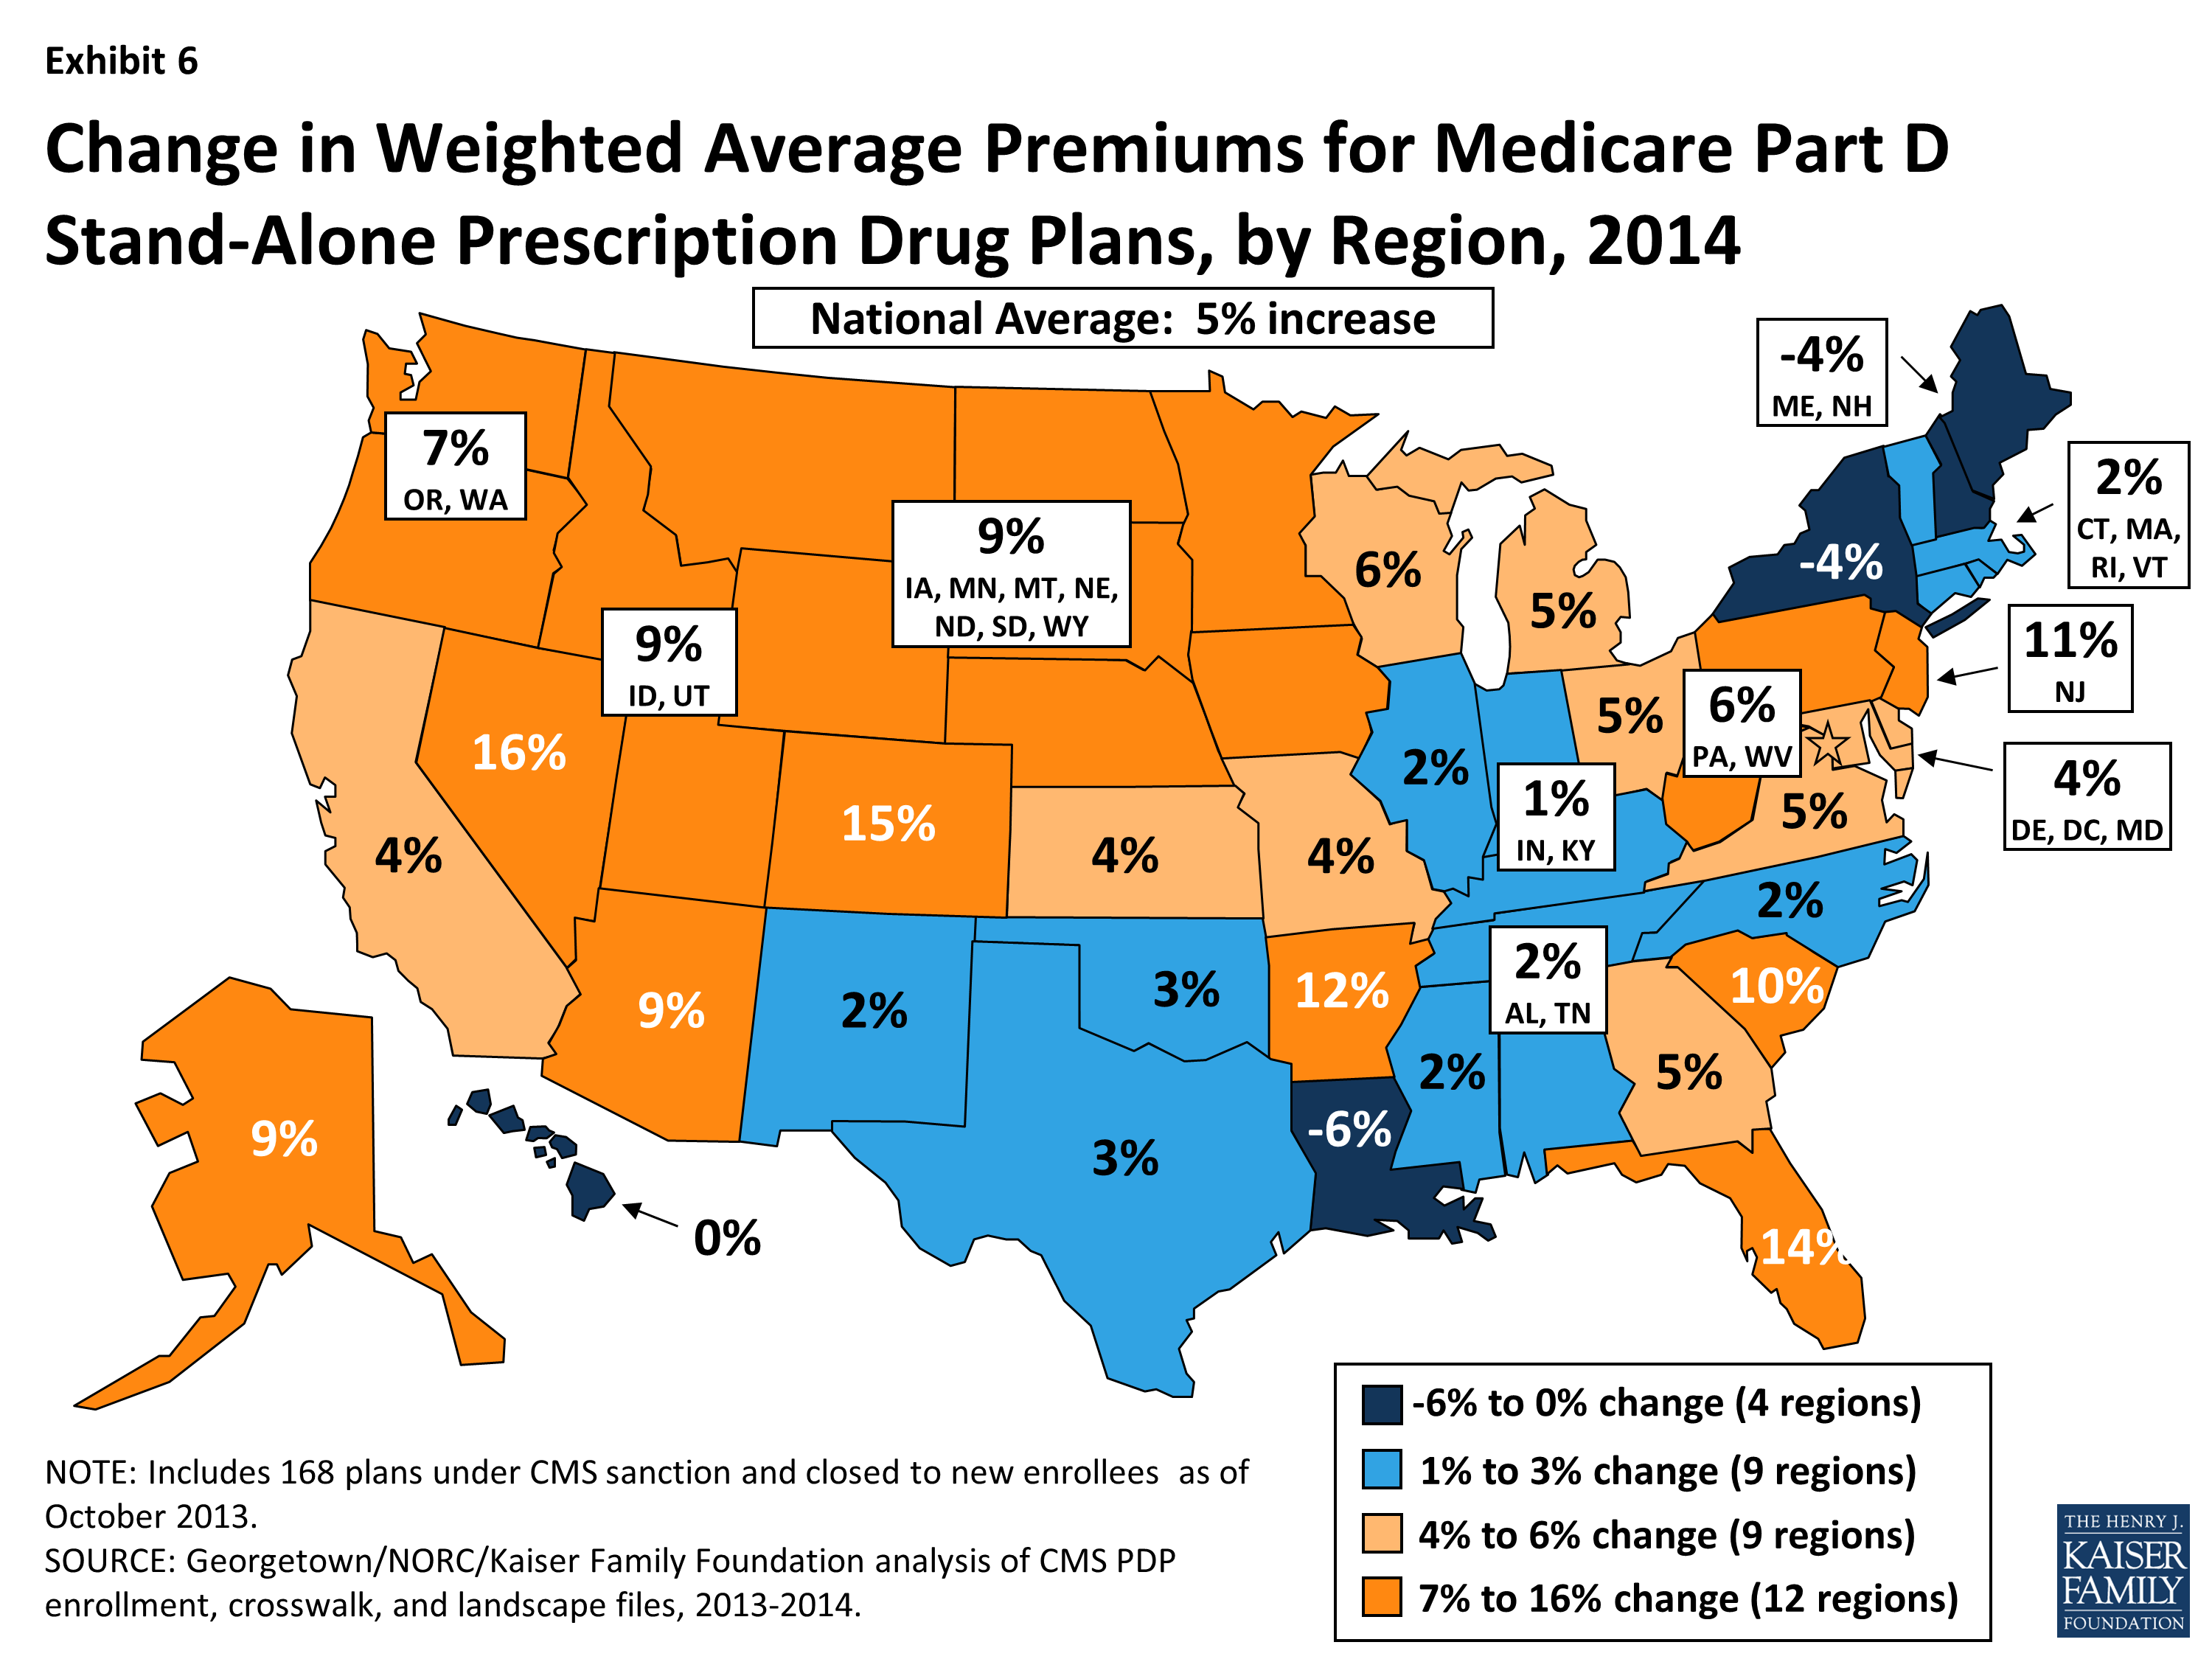
Exhibit 6. Change in Weighted Average Premiums for Medicare Part D Stand-Alone Prescription Drug Plans, by Region, 2014
- The regional variation in projected premium changes is influenced by regional differences in which PDPs have the highest share of enrollment and by decisions of plan sponsors to adjust premiums differently from region to region. For example, monthly premiums for the three PDPs with the most enrollees in Florida (which has a statewide premium increase of 14 percent) are increasing by double-digit percentages, whereas premiums for the three largest PDPs in New York (which has a statewide premium decrease of 4 percent) are either increasing by less than $1 or decreasing. More specifically, the premium for the AARP MedicareRx Preferred PDP—the plan with the most enrollees in both regions—increased by 11 percent in Florida, but by only 1 percent in New York.
These average and plan-level premium amounts do not take into account the income-related Part D premium that took effect in 2011 for Part D enrollees with higher annual incomes ($85,000/individual and $170,000/couple). Established by the ACA, the income-related Part D premium requires higher-income enrollees to make an additional payment to the government for Part D coverage, regardless of the plan selected. In 2014, the monthly surcharge will range from $12.10 to $69.30, depending on income, in addition to the monthly premium payment for the specific Part D plan.7 An estimated 5 percent of Part D enrollees are required to make these additional payments in 2013.8 Under current law, the income thresholds are not indexed to increase annually until 2020, which will result in an increasing share of Part D enrollees paying the income-related premiums over the next several years.
Benefit Design: The Coverage Gap and Deductibles
All beneficiaries who reach the coverage gap, or “doughnut hole,” in 2014 will pay less than the full cost of the price of their drugs, as a result of changes made by the Affordable Care Act. For 2014, manufacturer prices for brand-name drugs purchased in the gap will be discounted by 50 percent, with plans paying an additional 2.5 percent and enrollees paying the remaining 47.5 percent. Plans will pay 28 percent of the cost for generic drugs in the gap, with enrollees paying 72 percent. In 2014, the coverage gap begins after an enrollee incurs $2,850 in total drug spending and ends after an enrollee has spent a total of $4,550 out of pocket (or $6,691 in total drug costs under the standard benefit).9 At that point, catastrophic coverage begins, where enrollees generally pay only 5 percent of drug costs. (Appendix 2)
Most Part D plans will offer little or no gap coverage in 2014 beyond what is required by the ACA under the standard benefit. With all Part D enrollees now getting coverage for a share of their costs in the gap, the value of additional gap coverage offered by plans, beyond what the law requires, will become lower each year approaching 2020, when beneficiaries will only be responsible for 25 percent of their total drug costs in the gap.
- In 2014, about 82 percent of all PDPs will offer either no or very limited gap coverage—76 percent of plans will offer nothing beyond what the ACA requires and 6 percent will cover fewer than 10 percent of the drugs on their formulary.10 This is an increase from 2013, when 69 percent of PDPs were offering no or limited additional gap coverage—meaning a somewhat smaller share of plans will offer some gap coverage beyond what the ACA requires in 2014 than in 2013. (Exhibits 7 and 8; Appendix 1, Table A3)
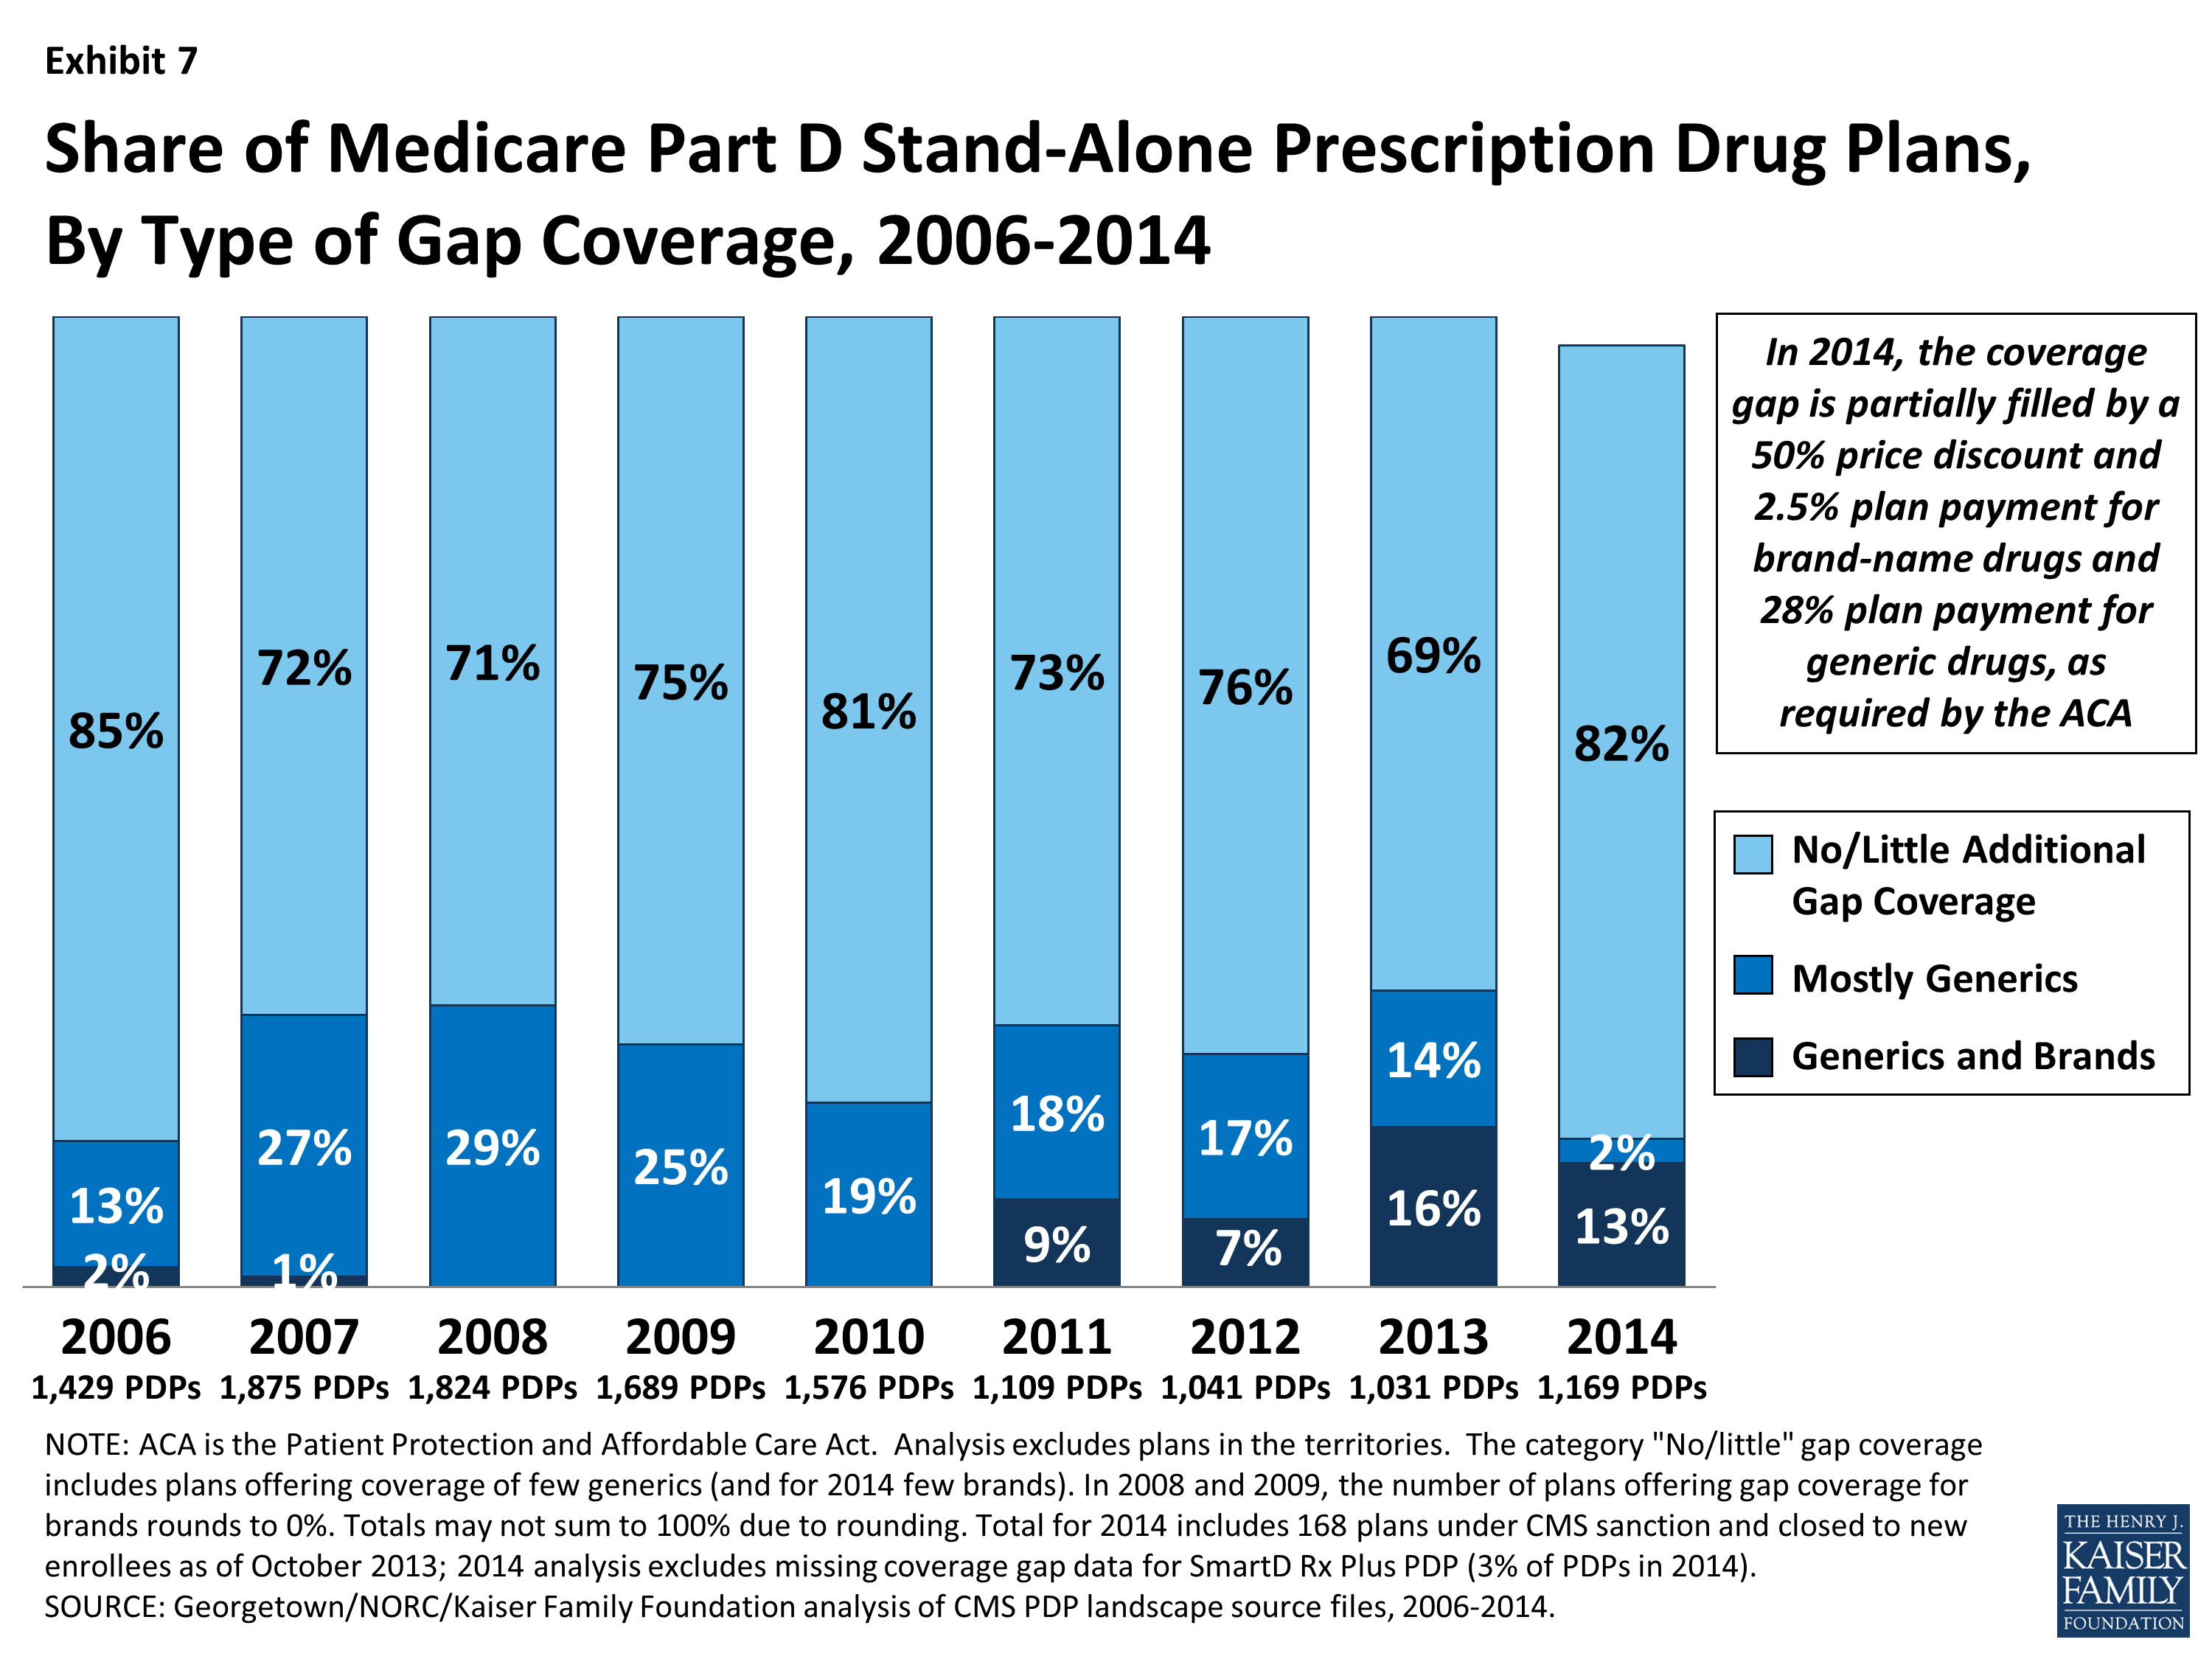
Exhibit 7. Share of Medicare Part D Stand-Alone Prescription Drug Plans, By Type of Gap Coverage, 2006-2014
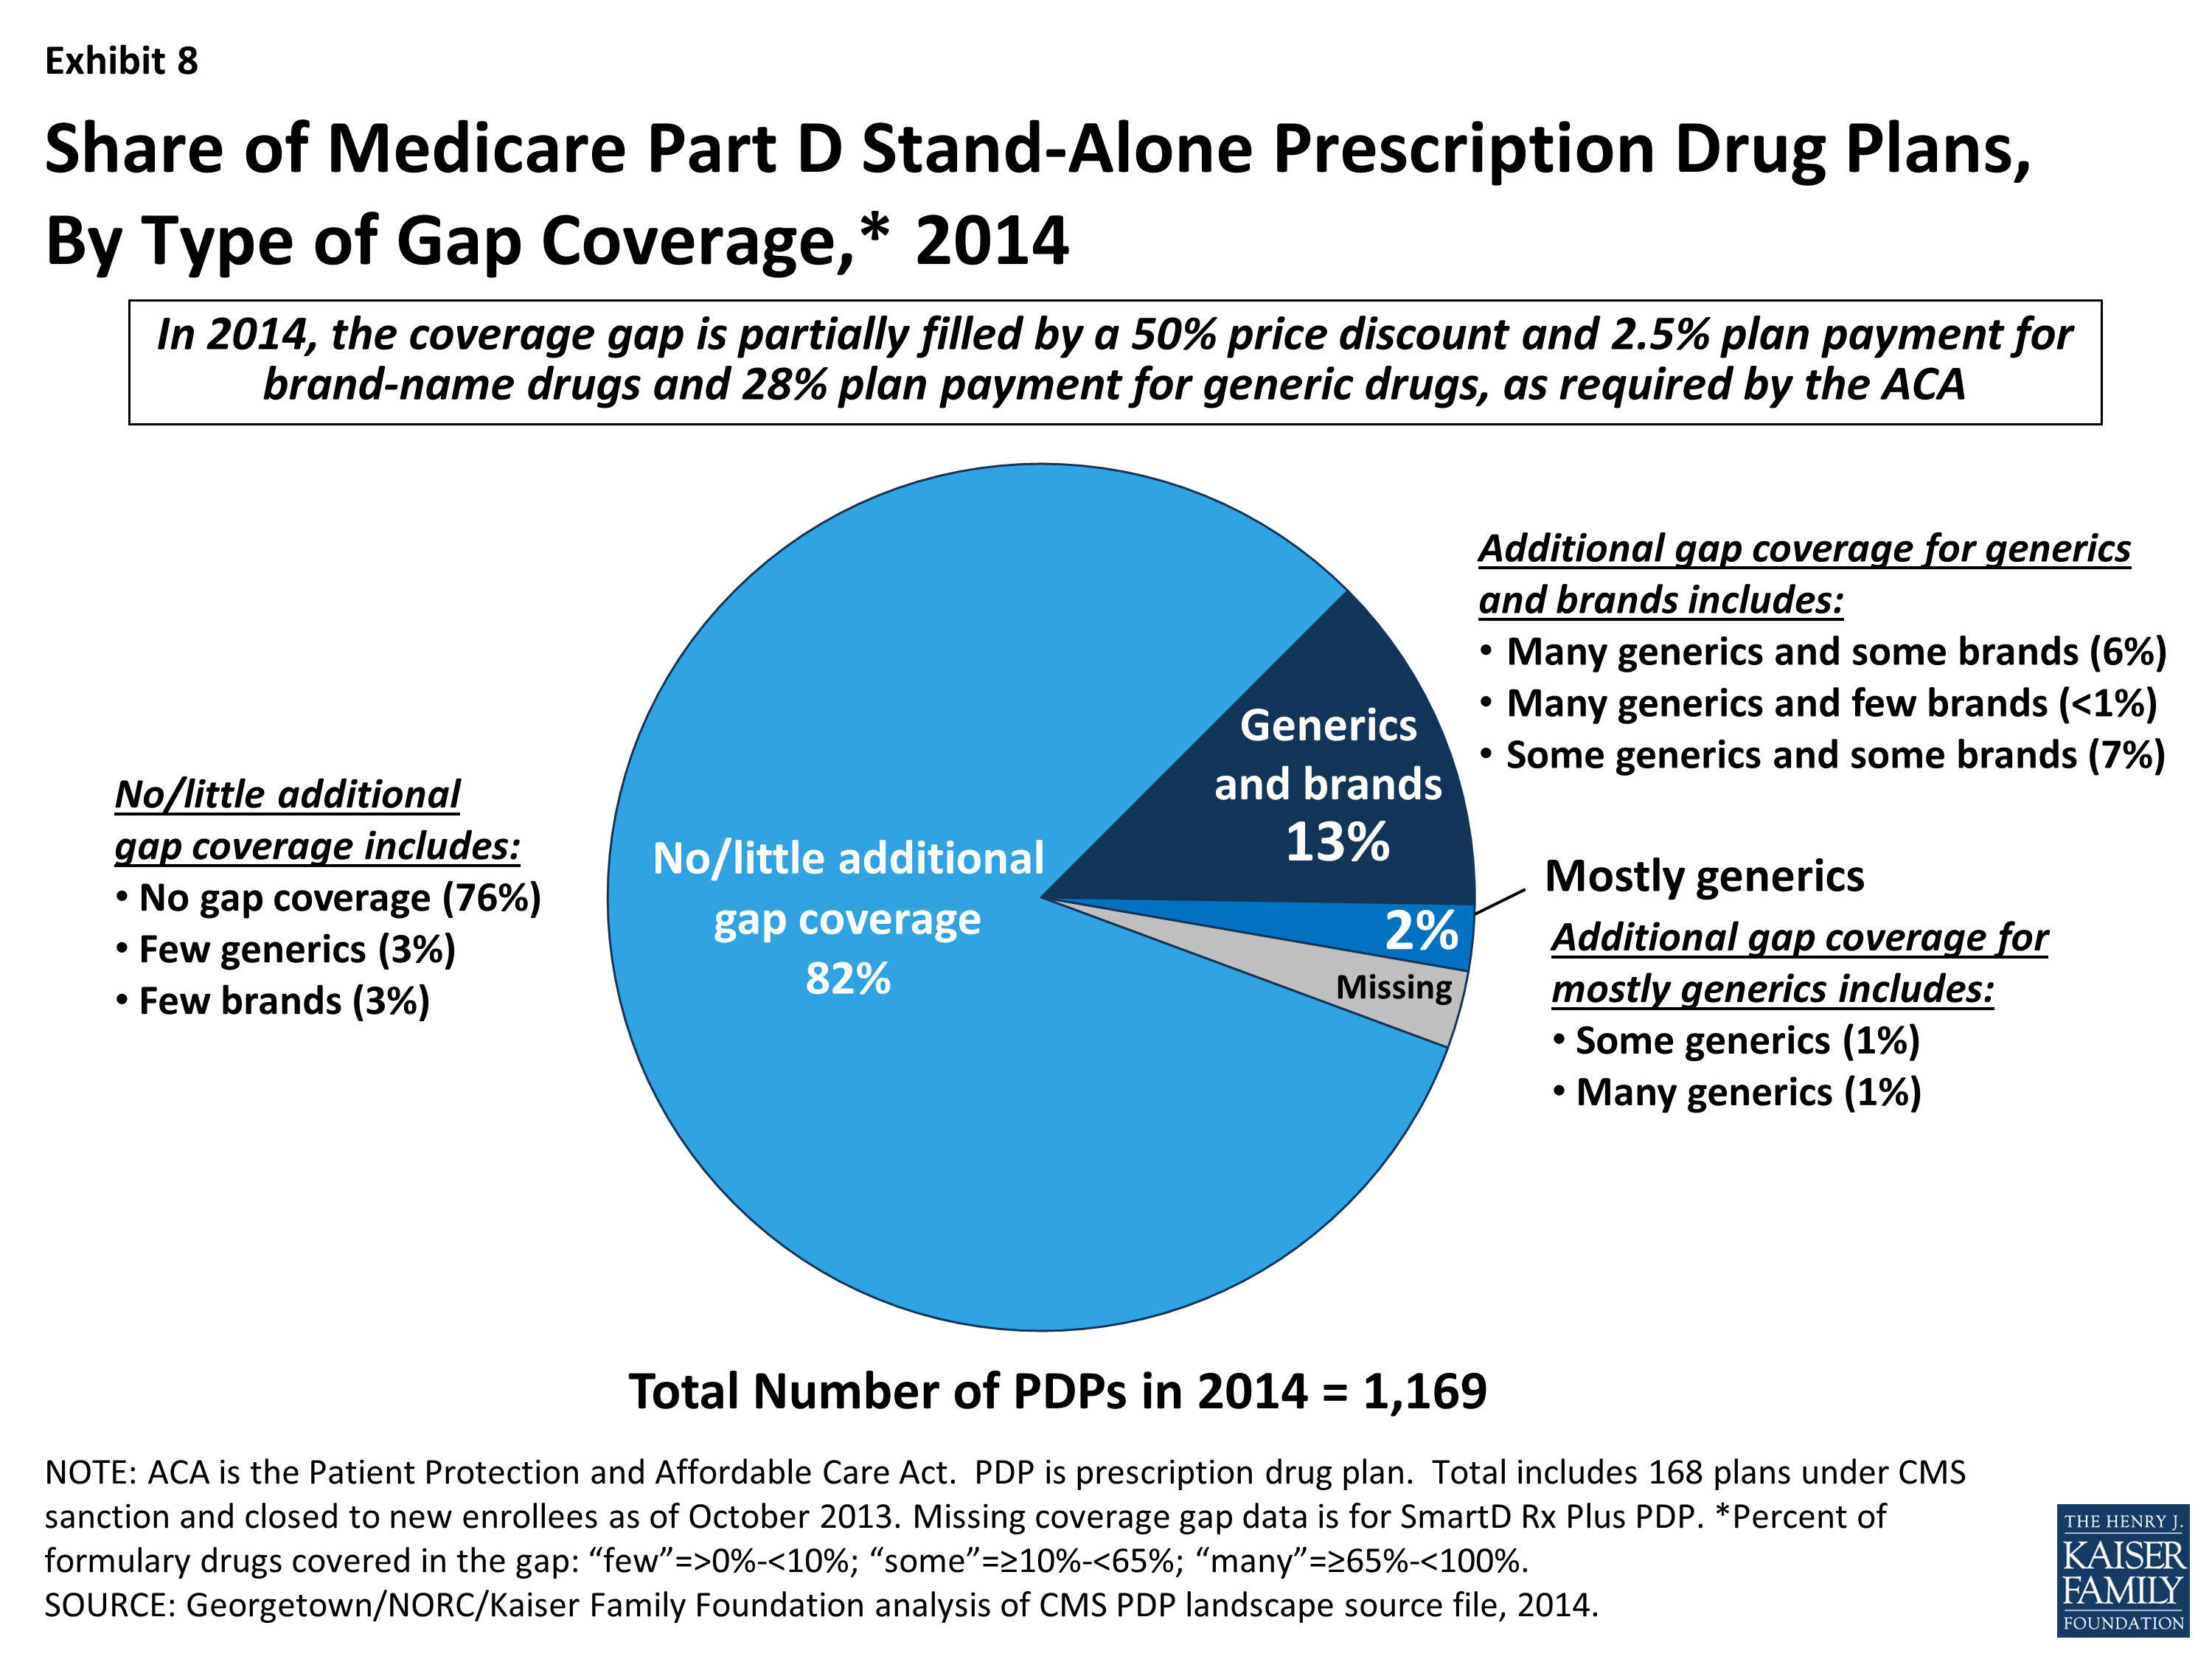
Exhibit 8. Share of Medicare Part D Stand-Alone Prescription Drug Plans, By Type of Gap Coverage, 2014
- Among the 15 percent of PDPs offering additional gap coverage in 2014 beyond what the law requires (defined as covering more than a “few” generics or brands), a very small share of PDPs (2 percent) limit gap coverage to generic drugs, with no additional gap coverage for brand-name drugs. (Exhibit 8)
- In 2014, 13 percent of PDPs (115 PDPs, including those offered by Cigna, Coventry/First Health, Silverscript, UnitedHealth, and some Blue Cross plans) will cover “some” brand-name drugs (defined as between 10 percent and 65 percent of the brand-name drugs on the plan’s formulary) in the coverage gap, about twice the level in 2012. No PDP will offer full gap coverage for all drugs on their formulary in 2014.
- A majority of PDPs (53 percent) will charge a deductible in 2014, the same as in 2013. Most PDPs with a deductible will charge the standard $310 amount (which is down somewhat from the standard amount of $325 in 2013 as a result of lower per-capita costs in Part D11). Among PDPs that charge a deductible, the share with a deductible below the standard amount has declined substantially from 2010 to 2014 (from 24 percent to 4 percent). (Exhibit 9)
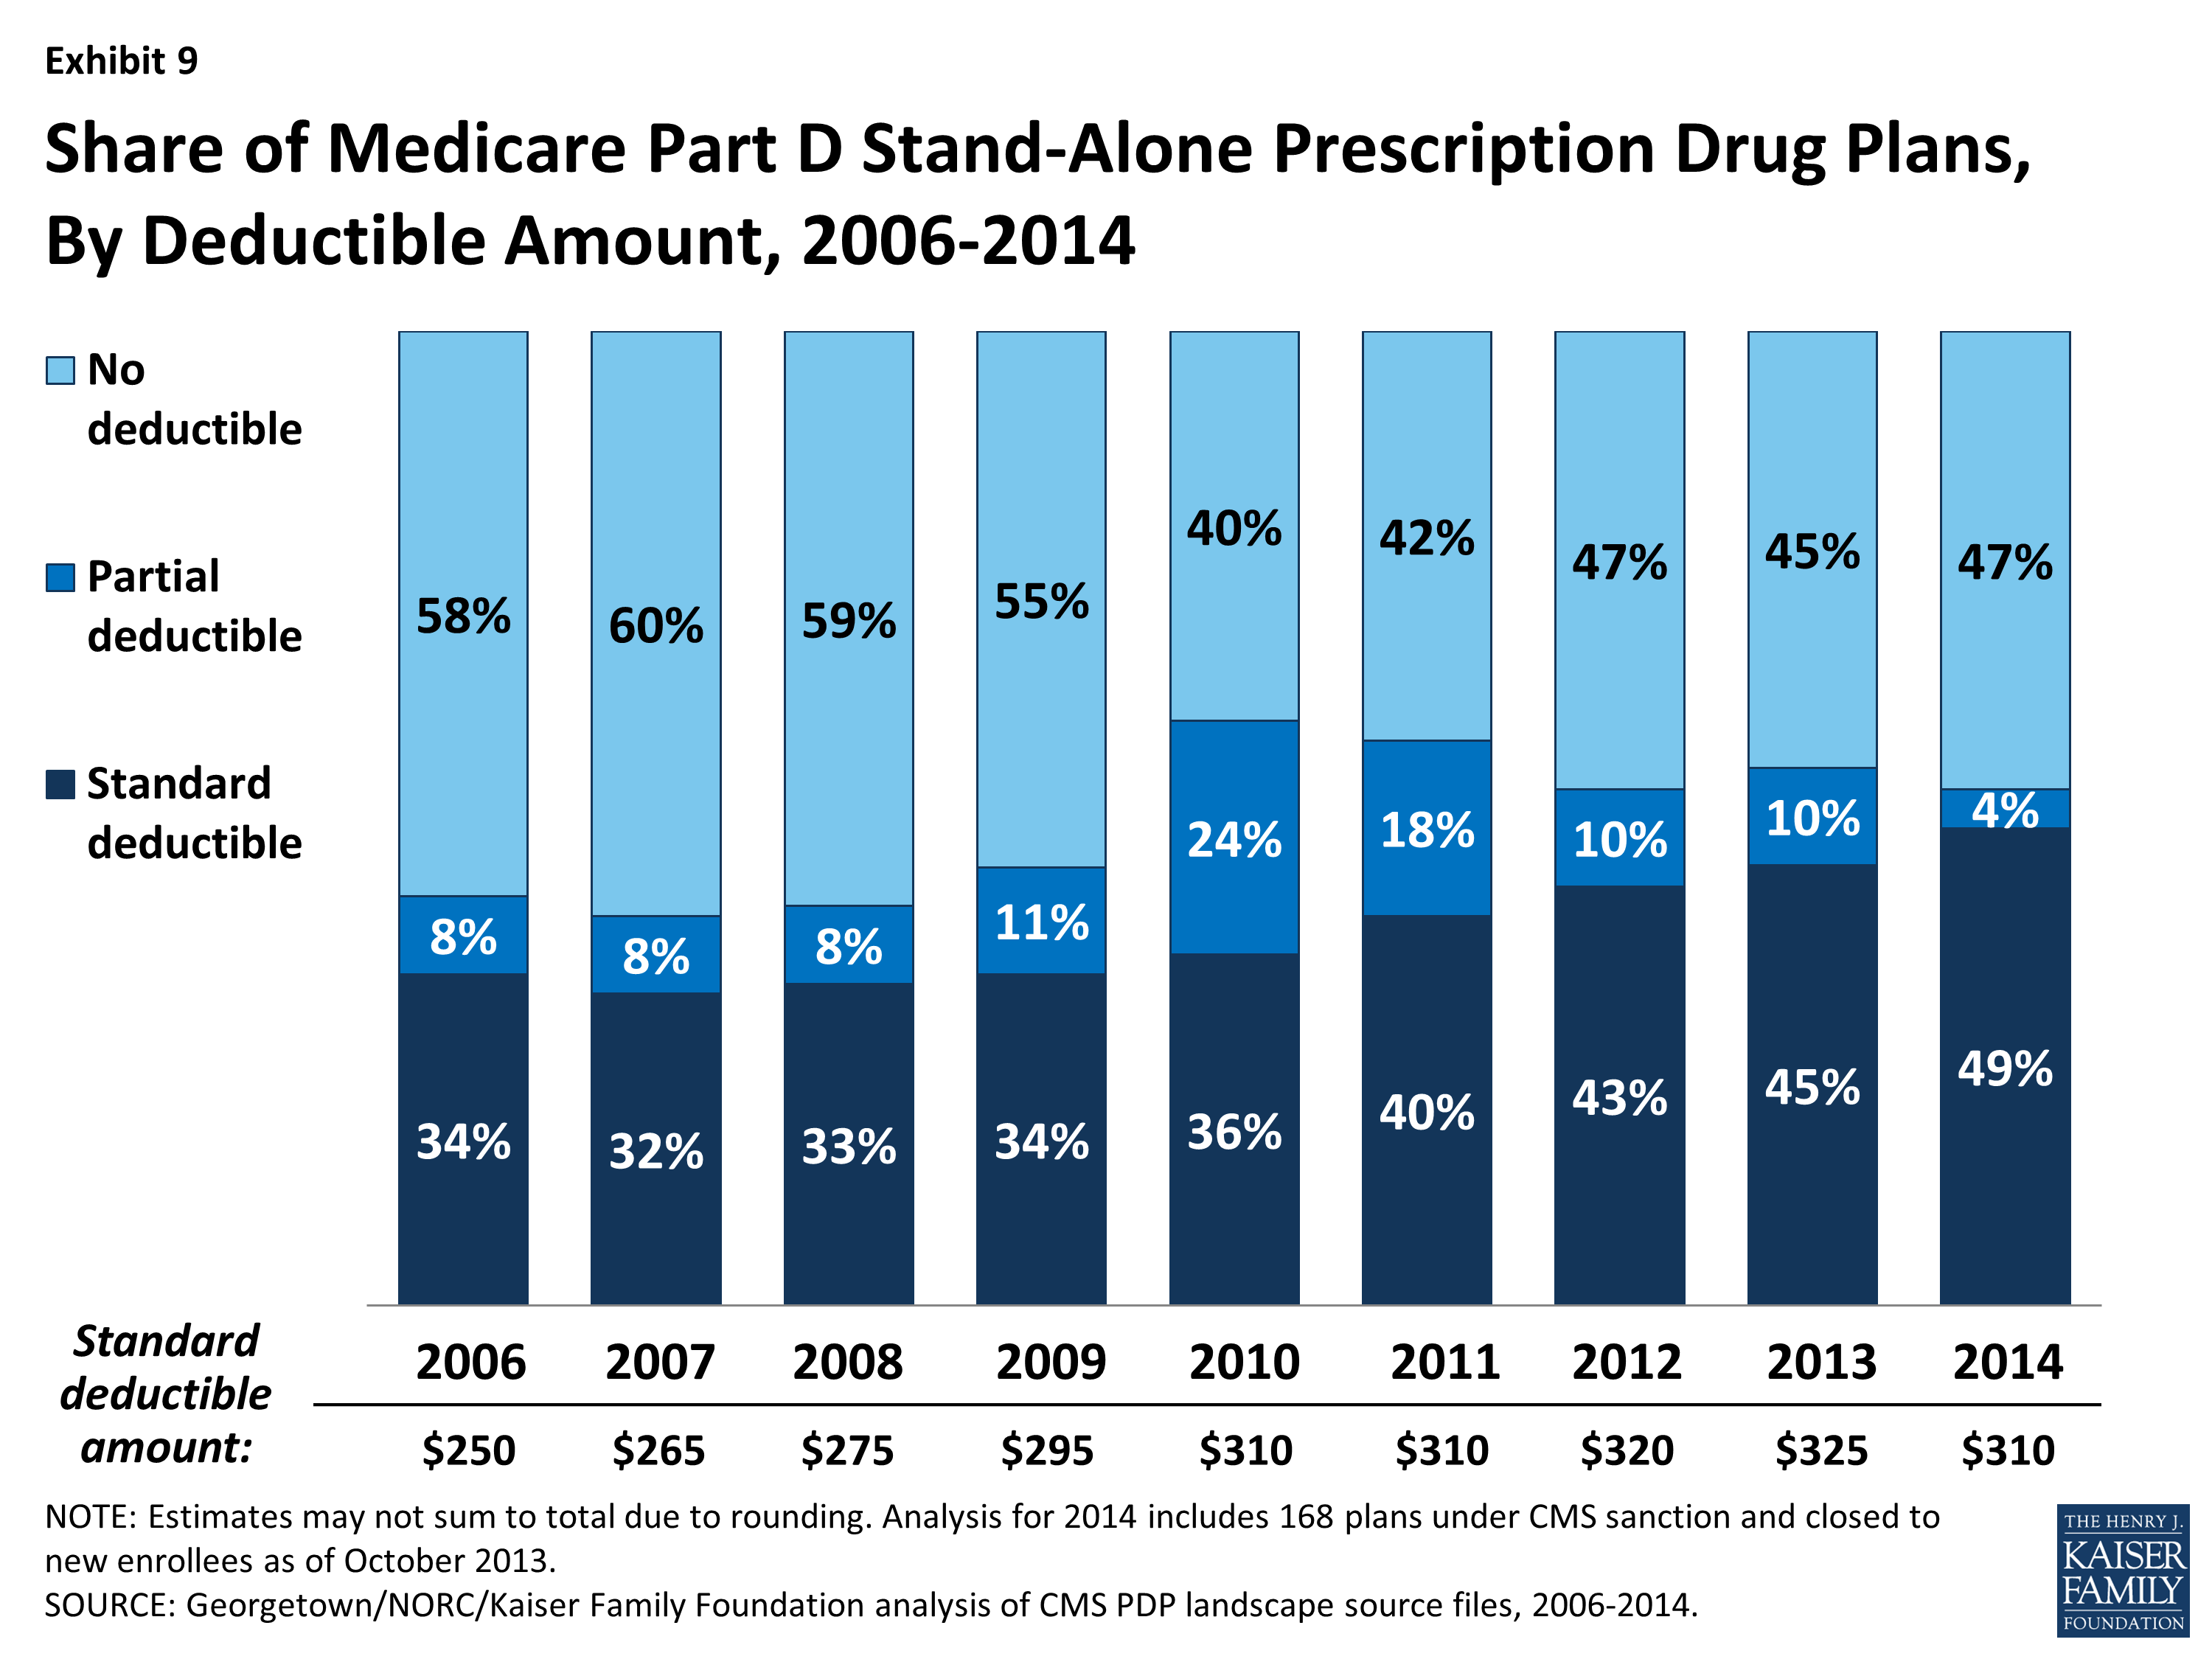
Exhibit 9. Share of Medicare Part D Stand-Alone Prescription Drug Plans, By Deductible Amount, 2006-2014
Low-income Subsidy (“Benchmark”) Plans
The total availability of benchmark plans—PDPs available for no monthly premium to Low-Income Subsidy (LIS) enrollees—will be somewhat greater in 2014 than in the five previous years.
- In 2014, 352 plans will be available for enrollment of LIS recipients for $0 premium. This represents a 6 percent increase in plans for LIS recipients, or 31 more plans than in 2013. (Exhibit 10; Appendix 1, Table A4)
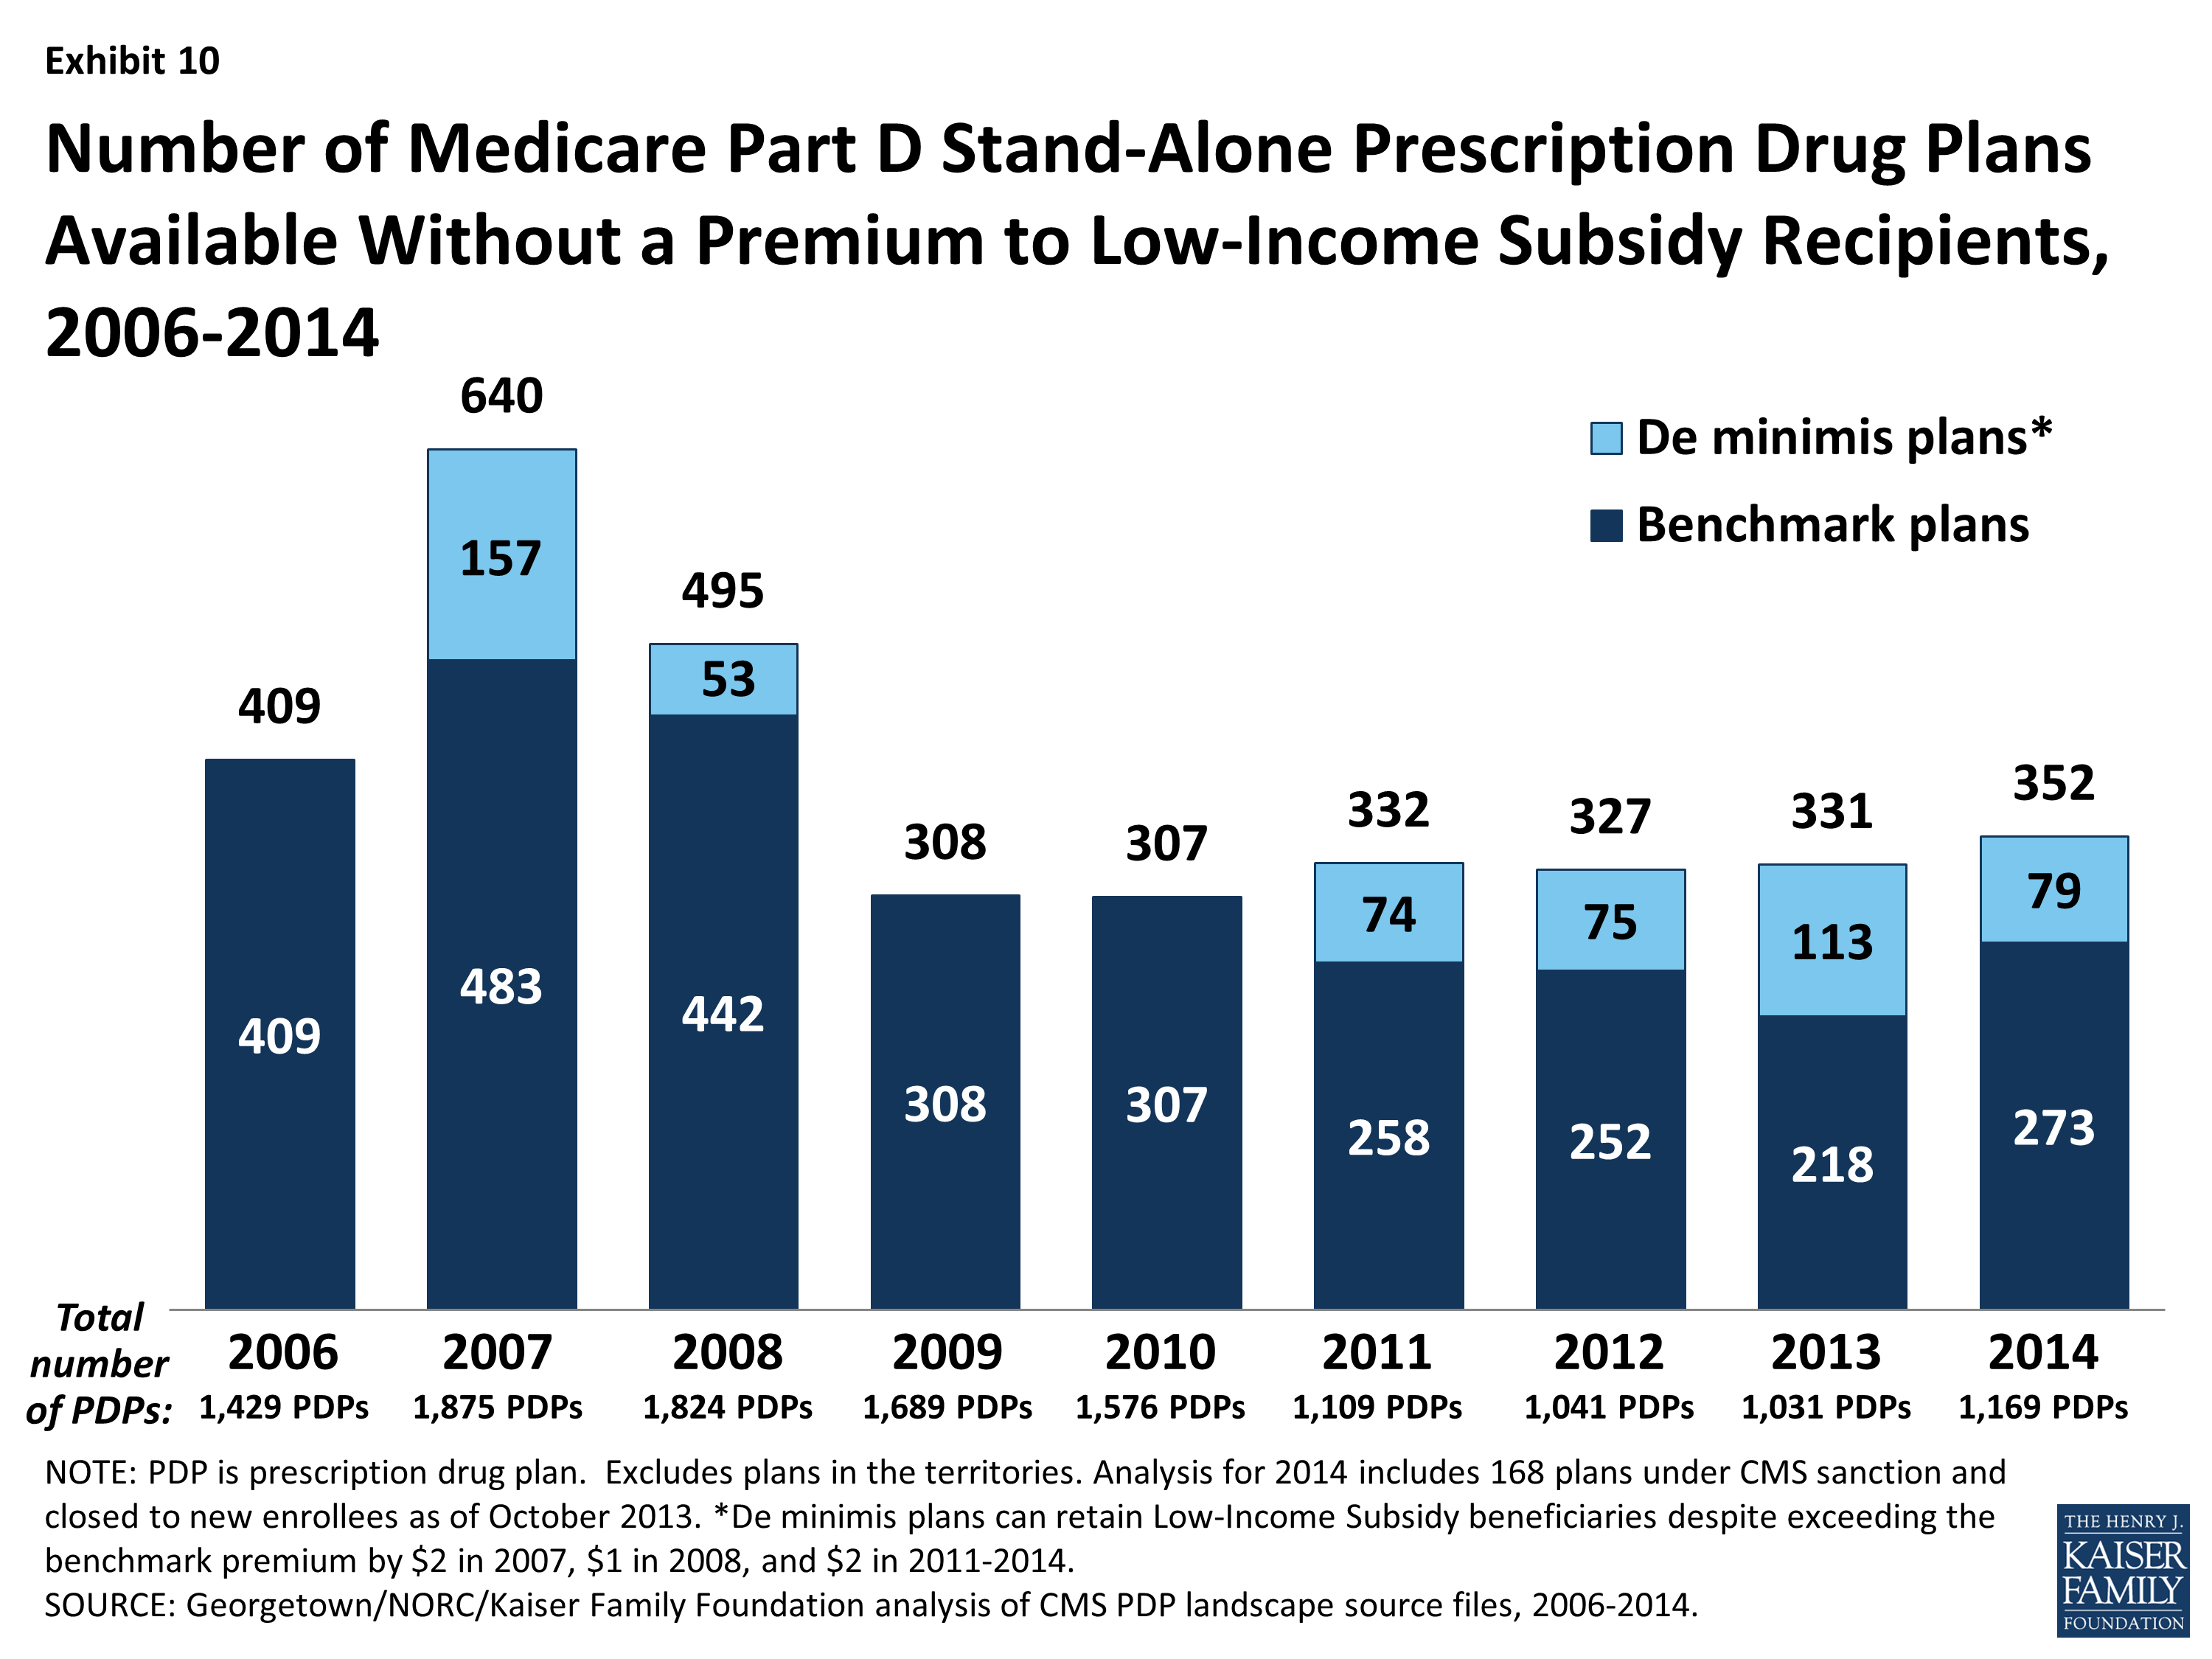
- Policies adopted by CMS in previous years make it easier for PDPs to qualify as benchmark plans, including the “de minimis” policy that allows plans to waive a premium amount of up to $2 in order to retain their LIS enrollees.12 Of the 352 benchmark plans in 2014, about one in four (79 plans) qualify through the “de minimis” policy—fewer than the 113 “de minimis” plans in 2013.
- Among the 2013 benchmark plans that will continue to participate in Part D in 2014, 60 PDPs have lost their benchmark status due to either higher premiums in 2014 or to a lower regional benchmark in 2014. About 517,000 LIS beneficiaries (6 percent of LIS enrollment in 2013) are enrolled in these plans—a potential source of disruption to their coverage.
- The number of benchmark plans available in 2014 will vary by region, from 4 benchmark PDPs in the Hawaii and Nevada regions (out of 29 and 34 PDPs, respectively) to 15 benchmark PDPs in the Indiana/Kentucky region (out of 35 PDPs). (Exhibit 11)
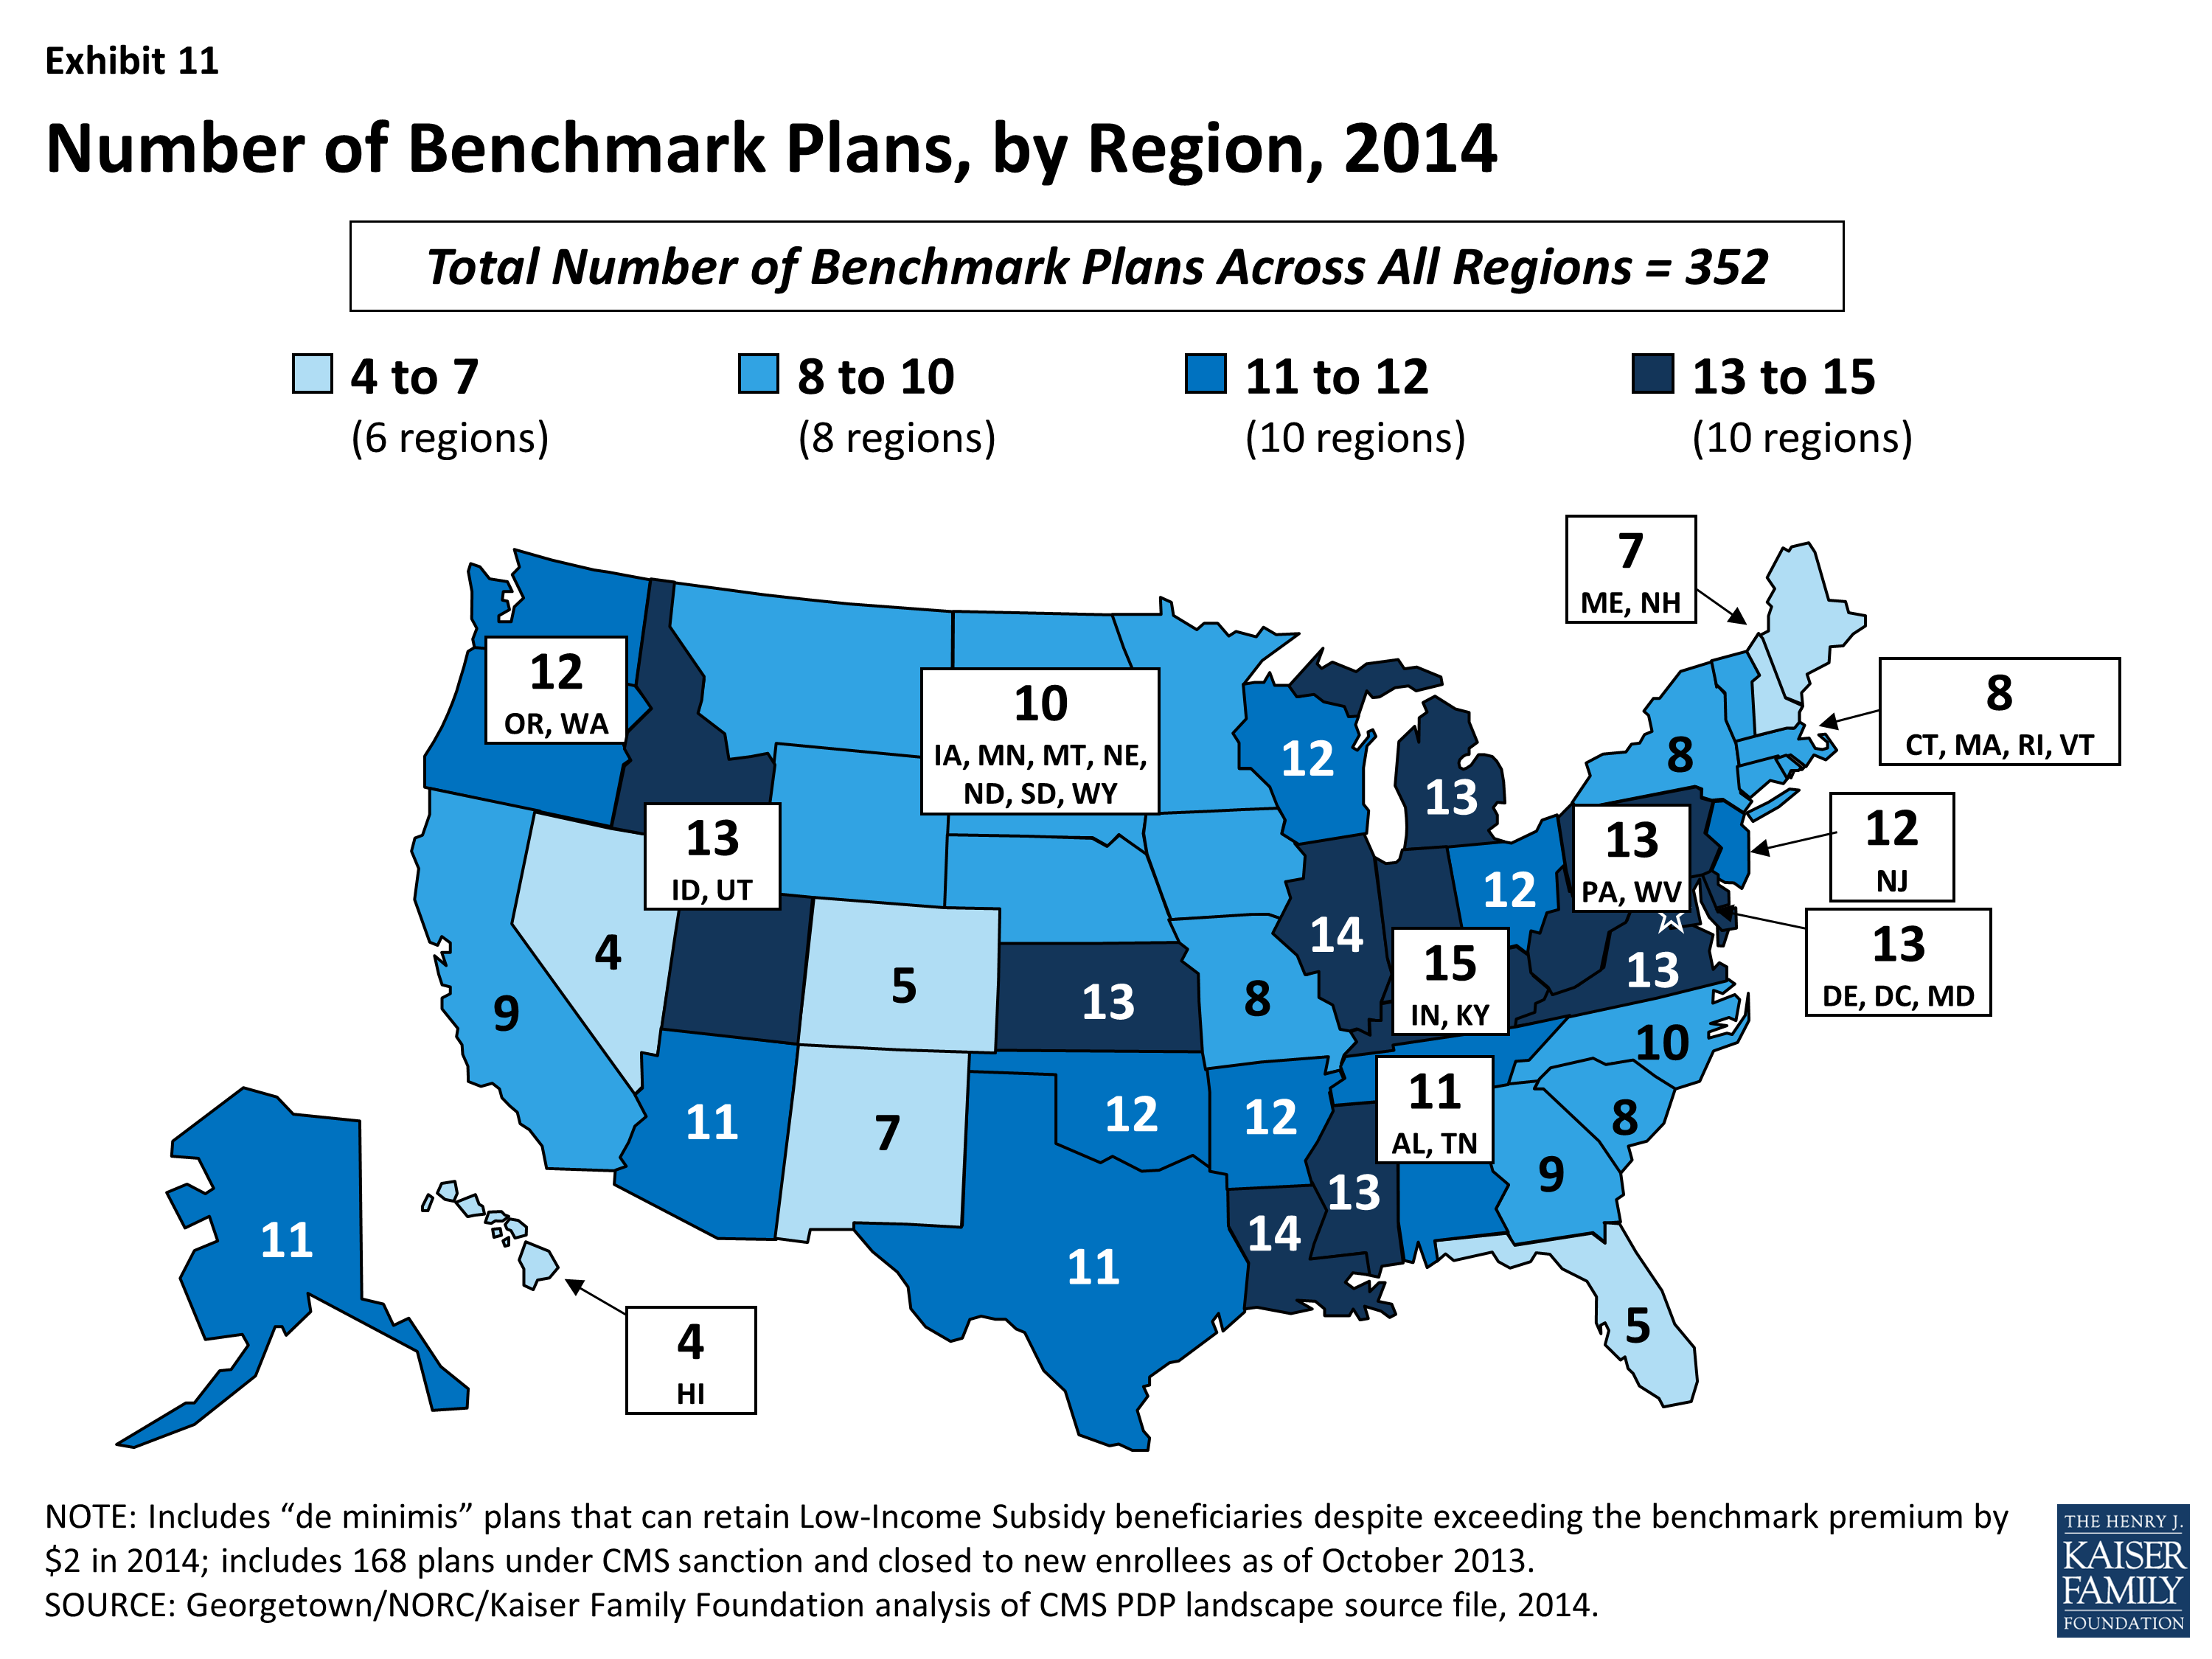
Exhibit 11. Number of Benchmark Plans, by Region, 2014
- Benchmark plan availability will decline in 9 of 34 regions between 2013 and 2014, while more LIS plans will be available in 20 regions. Year-to-year changes in most regions are relatively modest; the largest changes are the loss of six benchmark plans in the Hawaii and South Carolina regions. (Exhibit 12)
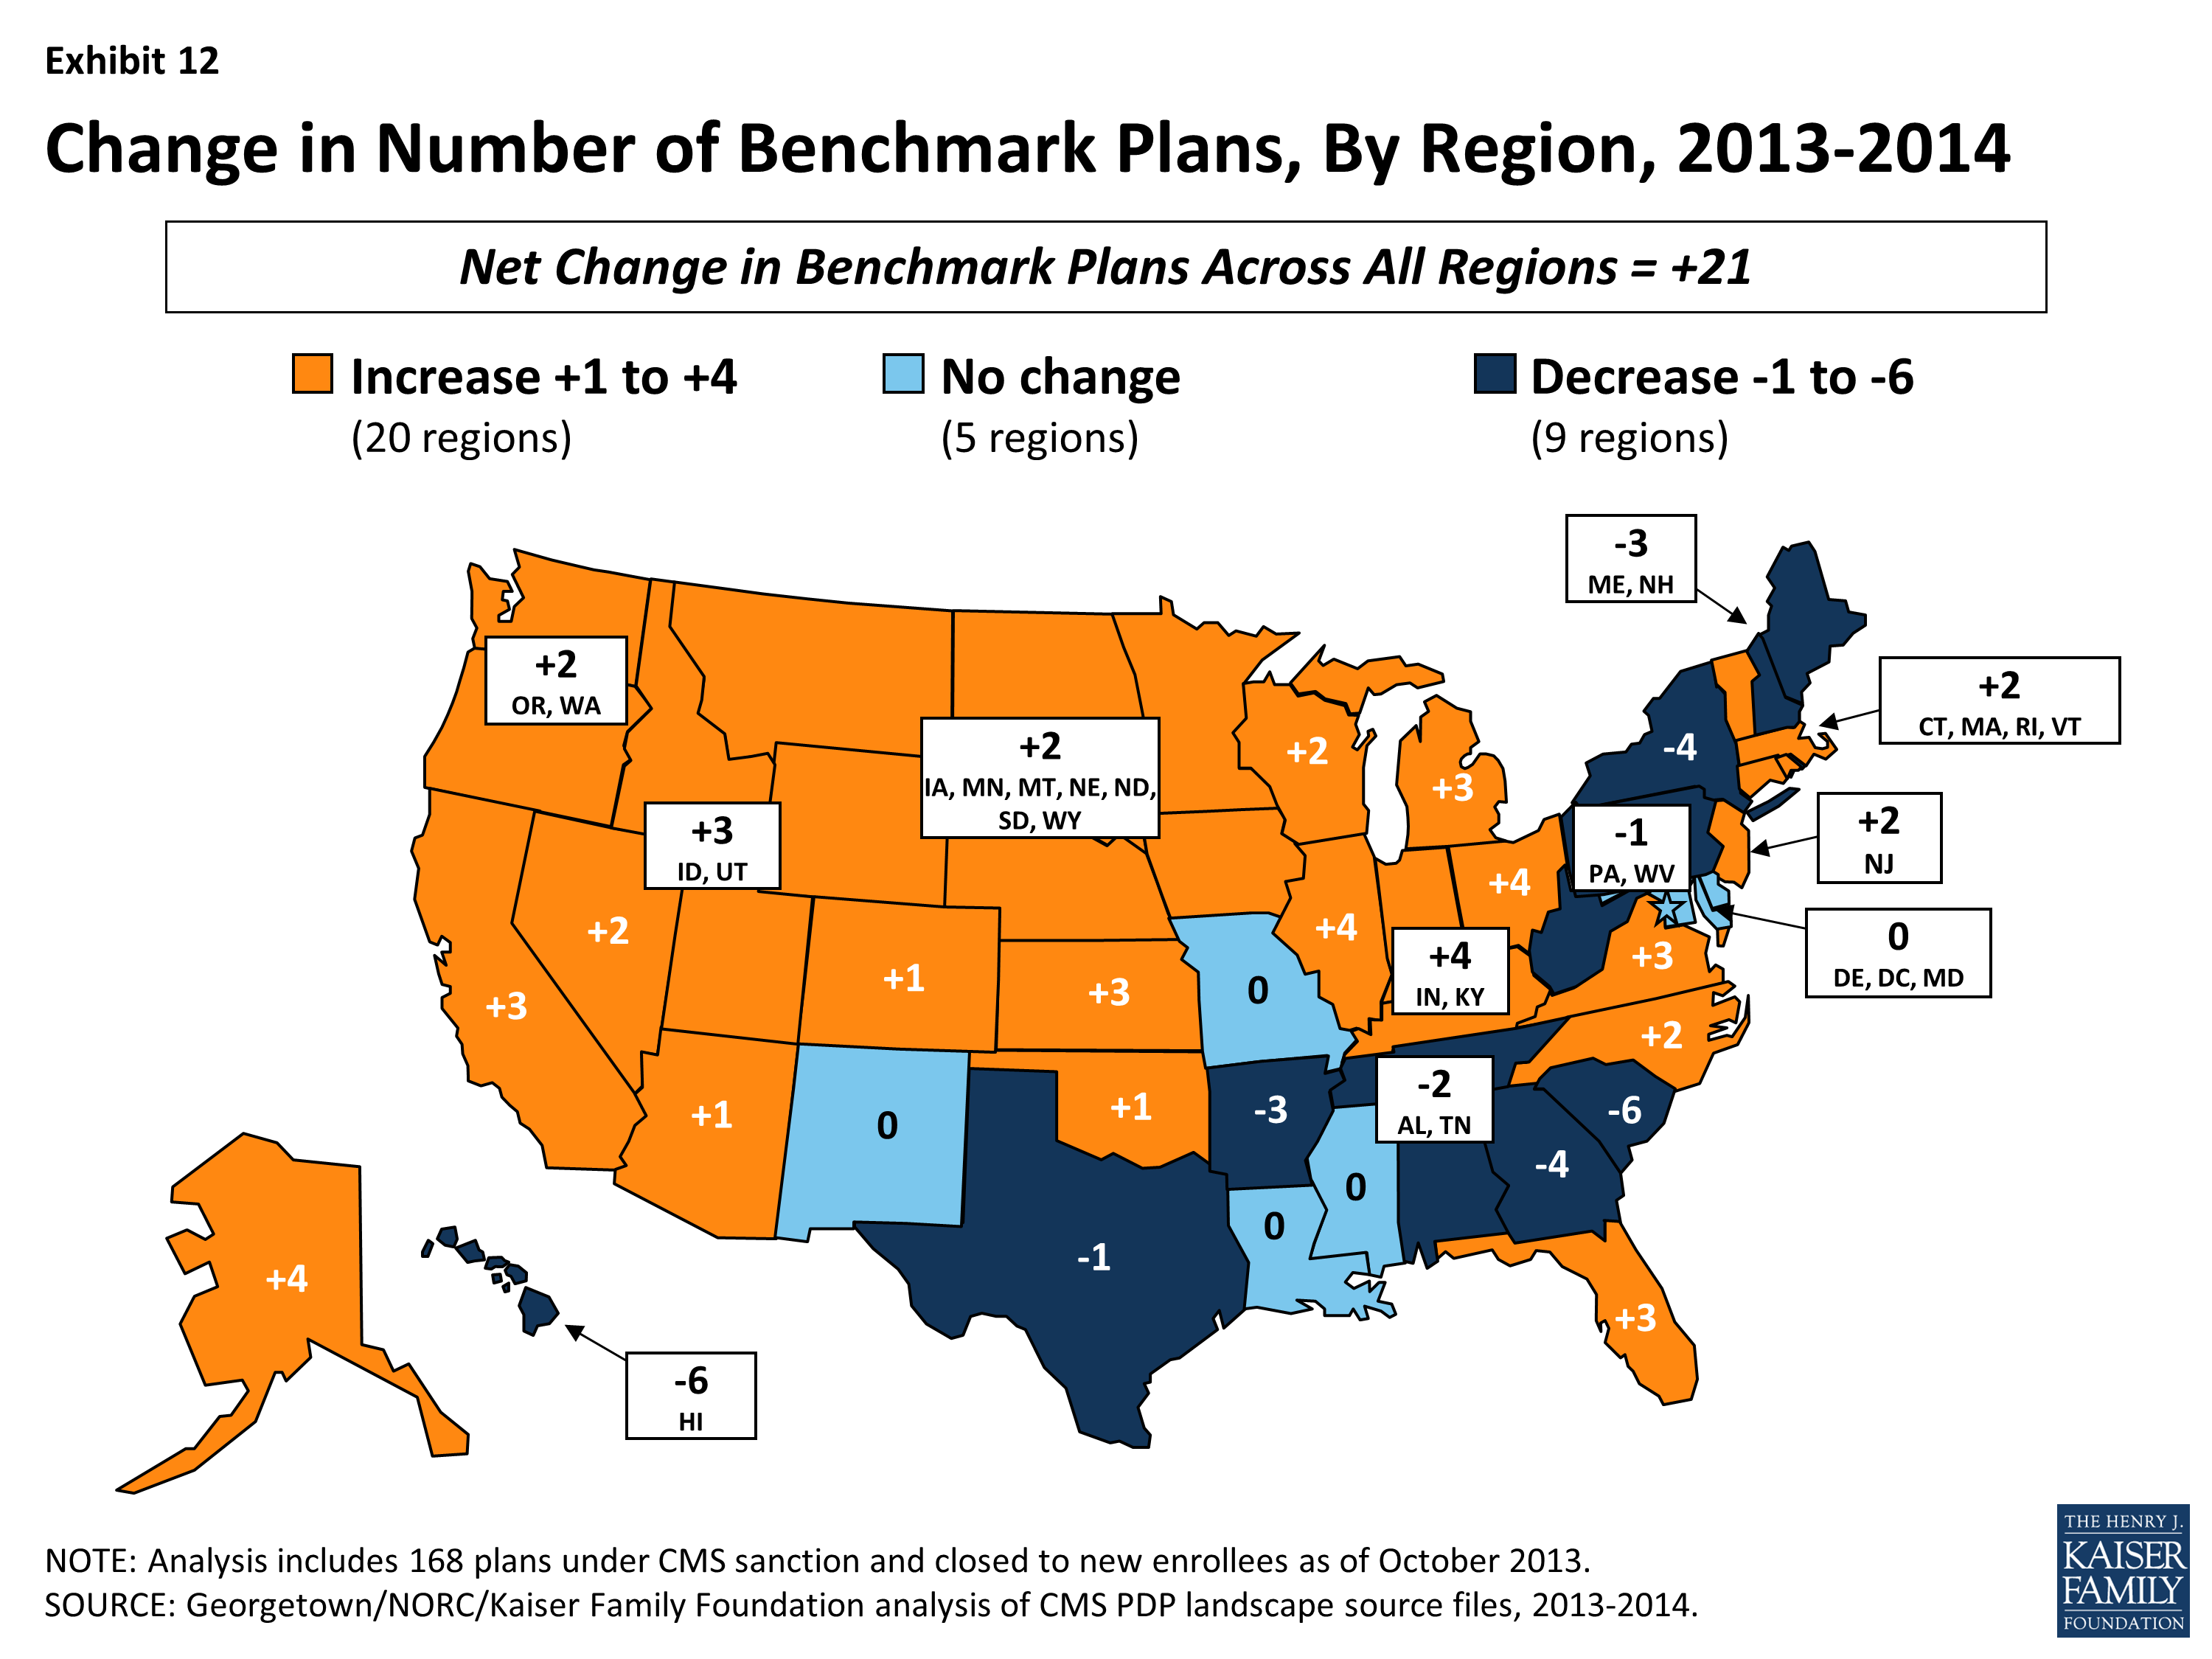
Exhibit 12. Change in Number of Benchmark Plans, By Region, 2013-2014
About 1.9 million people—about one in four LIS beneficiaries (23 percent)—are enrolled in PDPs in 2013 that will not qualify as benchmark plans in 2014 (Exhibit 13). This group includes 517,000 beneficiaries who were in benchmark plans in 2013; the remaining three-quarters (72 percent) of these beneficiaries are currently enrolled in non-benchmark plans and thus paid a premium in 2013. In fact, about 470,000 LIS enrollees will pay premiums of at least $20 per month and nearly 81,000 LIS enrollees will pay premiums of at least $50 per month if they do not switch to other PDPs.
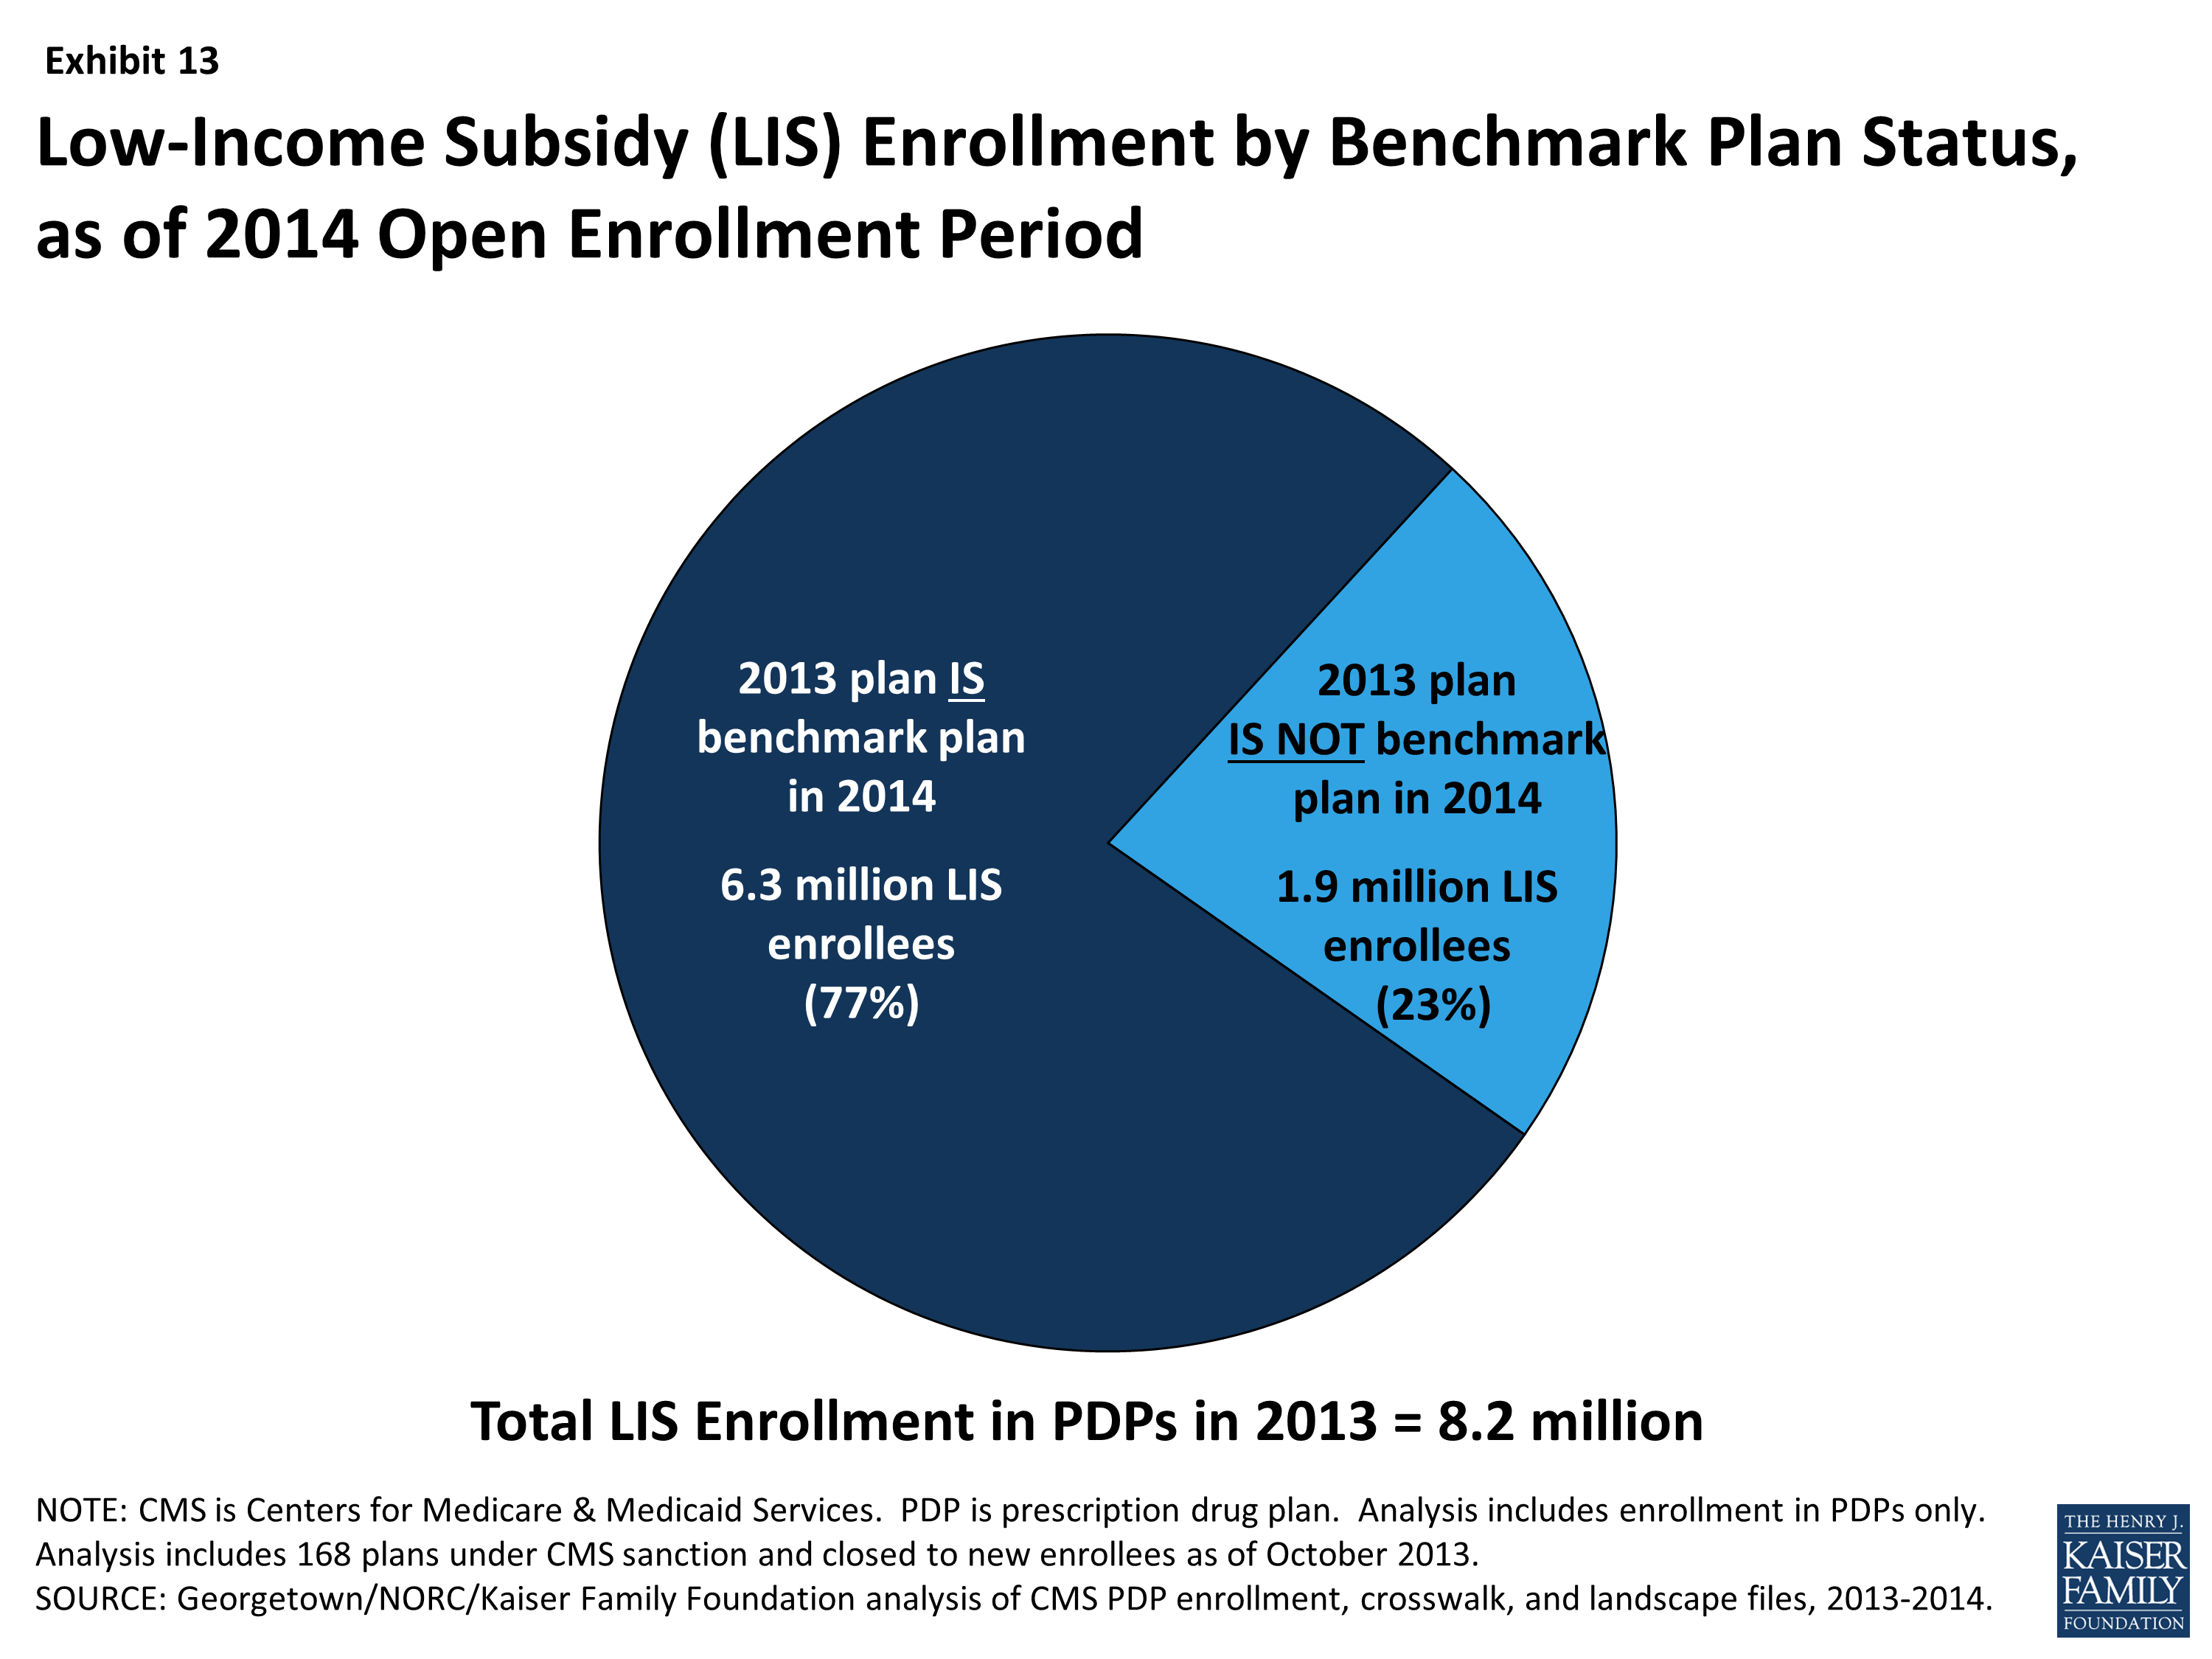
Exhibit 13. Low-Income Subsidy (LIS) Enrollment by Benchmark Plan Status, as of 2014 Open Enrollment Period
- The number of LIS beneficiaries who will potentially pay a premium in 2014 unless they enroll in (or are switched to) benchmark plans (1.9 million) is down considerably from the 2.7 million LIS beneficiaries who were in a similar situation at the time of last year’s open enrollment period.
- CMS will reassign a subset of these LIS enrollees, specifically those who were randomly assigned by CMS to their current plan (last year, one-third of those scheduled to pay a premium were reassigned), and several states will help reassign those enrolled in their state pharmacy assistance programs (SPAPs).13 But many other LIS beneficiaries not scheduled to be in benchmark plans in 2014 must switch plans on their own or pay a premium if they remain in their 2013 plan. Those in the latter group will not be reassigned because in the past they or someone assisting them made a choice to switch plans. Most affected LIS beneficiaries will receive a letter from CMS or their SPAP either informing them of their reassignment or reminding them that they can choose a different plan and avoid paying a premium.
The number of benchmark plans offered by the major Part D organizations has fluctuated substantially during the program’s five years. This year, nine PDP sponsors will have benchmark plans in at least half of the 34 regions, including one of the companies new to the program (Symphonix).
- In 2013, about 70 percent of LIS enrollees in PDPs are in plans operated by just four plan sponsors (CVS Caremark, Humana, UnitedHealthcare, and Cigna). Each of these sponsors has PDPs that qualify as benchmark plans in 2014 in at least 27 of the 34 PDP regions, although each sponsor has had at least one previous year when it qualified in less than half of the regions. Two sponsors (Humana and UnitedHealthcare) have benchmark plans in all 34 regions in 2014. (Exhibit 14)
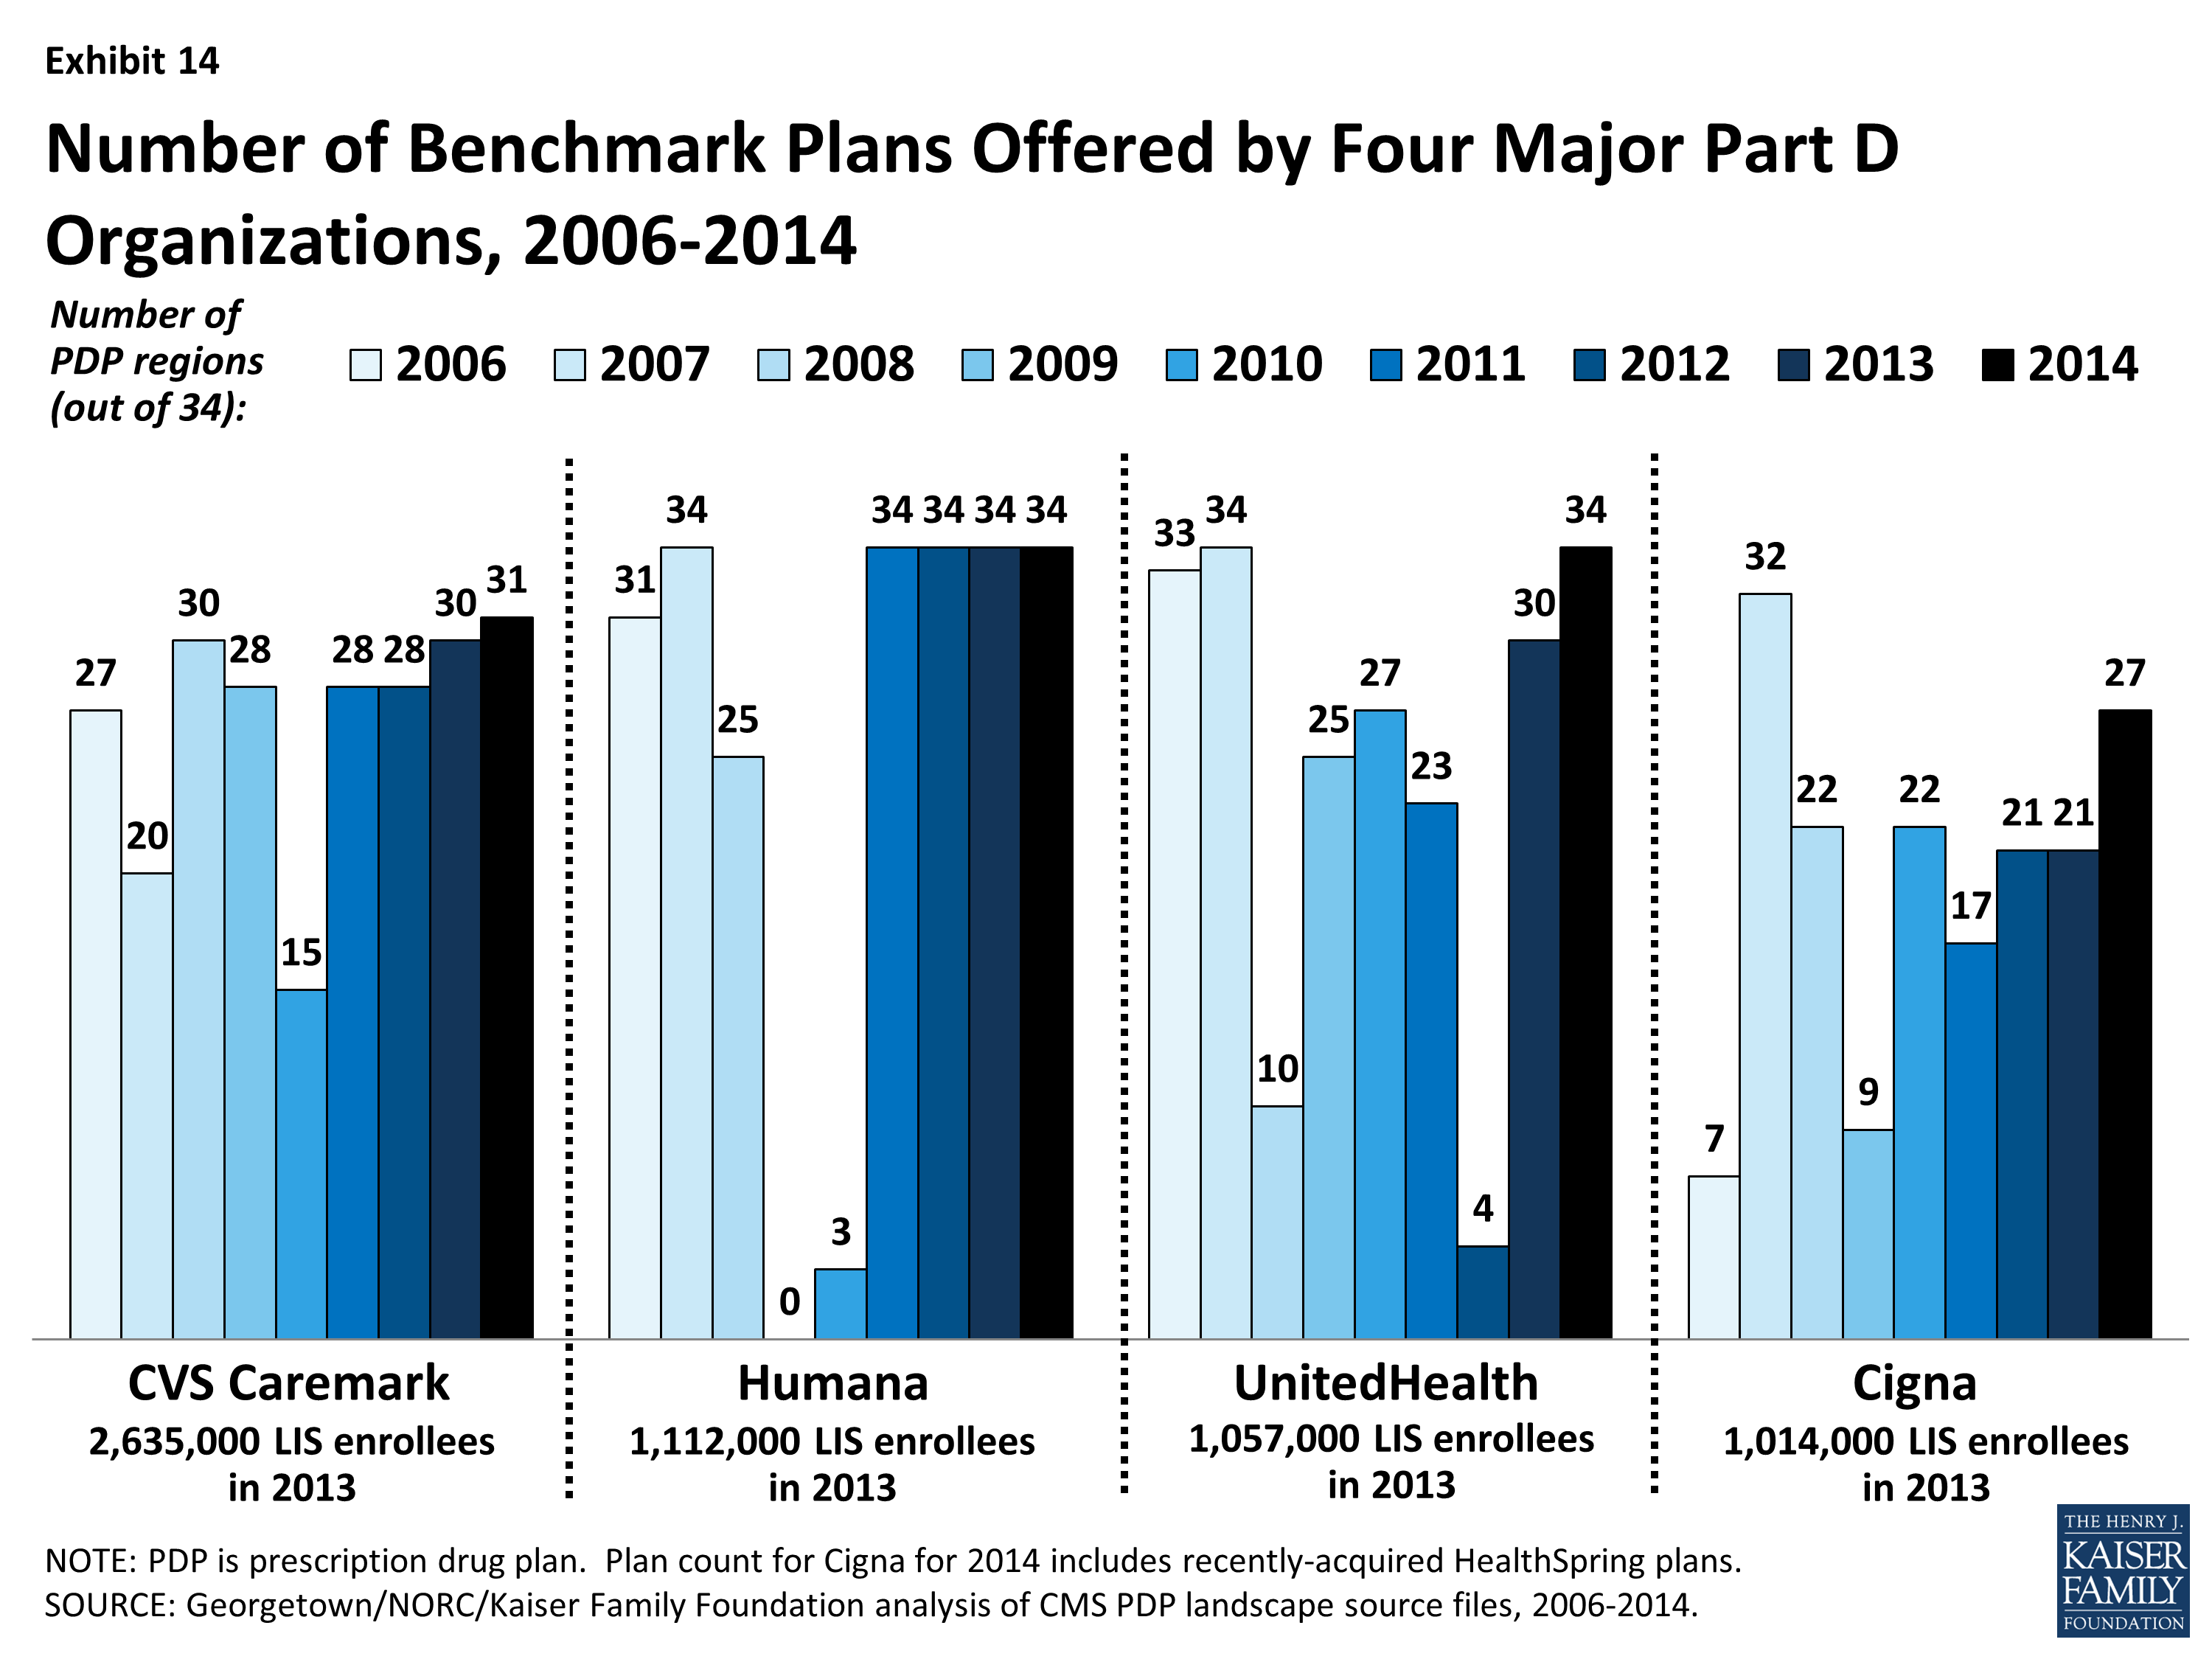
Exhibit 14. Number of Benchmark Plans Offered by Four Major Part D Organizations, 2006-2014
- Although these four sponsors have PDPs that qualify as benchmark plans in most regions, their LIS enrollees may be split between benchmark plans and other plans operated by these sponsors. For example, 71 percent of UnitedHealthcare’s LIS enrollees are in non-benchmark PDPs and thus pay premiums. Most of them are in the AARP Medicare Rx Preferred PDP, which was a benchmark PDP in the program’s earlier years. By contrast, only 5 percent of Cigna’s LIS enrollees and only 2 percent CVS Caremark’s LIS enrollees are in those sponsors’ non-benchmark PDPs.
Notable Trends for 2014
Two other notable trends characterize the Part D program for 2014:
- In contrast to the program’s first years, a growing number of PDPs are using preferred pharmacy networks, whereby enrollees pay lower cost sharing for their prescriptions when they use preferred pharmacies (although cost-sharing differences vary considerably across the plans). This trend has gained prominence in recent years with the market entry of co-branded PDPs featuring relationships with specific pharmacy chains, such as the Humana Walmart-Preferred Rx PDP (new in 2011) and the Aetna CVS/Pharmacy PDP (new in 2012). In 2006, there were some co-branding relationships between PDPs and pharmacy chains, but in general they were not accompanied by lower cost sharing at the pharmacy chains. About 72 percent of all PDPs in 2014 will have a preferred pharmacy network with lower cost-sharing levels when prescriptions are filled at preferred pharmacies. For example, in the AARP Medicare Rx Saver Plus PDP, the copayment for a preferred brand drug will be $20 in a preferred pharmacy and $30 in another network pharmacy. Copayments in the new Humana Walmart Rx Plan at a preferred pharmacy will be $1 for drugs on the preferred generic tier and $4 for drugs on the non-preferred generic tier, compared to $10 and $33, respectively, at other network pharmacies.
- While a majority of Part D plans have adopted some type of tiered cost sharing for their formulary since the program’s first year, there has been a trend toward the use of more cost-sharing tiers. In 2006, some plans had three tiers—generics, preferred brand drugs, and non-preferred brand drugs—and some also added a fourth tier for specialty drugs. By 2013, a five-tier benefit design, with the addition of a second generic tier to the four-tier arrangement, had become the most common, and it will be the dominant formulary design in the 2014 PDP market. Of 31 PDPs offered in at least half of all PDP regions in 2014, 24 (77 percent) have this type of formulary design.
Discussion
In 2014, the number of Medicare Part D stand-alone prescription drug plans offered nationwide will grow modestly with the entry of new PDP offerings by several long-time plan sponsors. The average Medicare beneficiary will have a choice of 35 PDPs in 2014, a slight increase from 2013, and most will also have access to several Medicare Advantage drug plans.
On average, plan enrollees who remain in the same plan will see a modest 5 percent premium increase ($1.76 per month) if they stay enrolled in the same plan in 2014. But moving beyond the overall average change, about one-third of all PDP enrollees will experience a premium reduction in 2014 and about 14 percent of PDP enrollees will see a premium increase of $10 or more. Enrollees in four of the program’s most popular PDPs will experience premium increases of at least 10 percent, and those enrolled in two of these PDPs face increases of 50 percent. By contrast, enrollees in three other popular PDPs will see lower premiums. As in recent years, there is a new PDP offered in all regions at a low premium for 2014, and some enrollees may consider switching from PDPs that are increasing premiums to some of the lower-premium PDPs.
The majority of plans offered in 2014 will offer no gap coverage beyond that which is required by the Affordable Care Act, and the amount of gap coverage available to all plan enrollees will become increasingly more generous as the Medicare Part D “doughnut hole” gradually closes by 2020.
Beneficiaries receiving Low-Income Subsidies will have 21 more plans available to them for no monthly premium in 2014 than in 2013, although nearly one of four LIS beneficiaries will need to change plans between 2013 and 2014 to avoid paying a premium. Although some of the latter group will be reassigned by CMS to benchmark plans, many are likely to end up in non-benchmark plans and pay premiums for drug coverage in 2014, despite having the option to enroll in a zero-premium plan.
This evaluation of the Part D plan landscape for 2014 and changes over time suggests that many PDP enrollees will face some changes in their current plan, whether in the form of higher or lower premiums, deductibles, gap coverage, pharmacy networks, or other benefit design features. While the annual enrollment period is the best opportunity for people on Medicare to evaluate their coverage options and make changes, a recently released study of plan switching by several authors of this analysis showed that about 87 percent of all PDP enrollees stayed in the same plan in annual enrollment periods between 2006 and 2010.14 Even when they were projected to face large premium increases, 72 percent of PDP enrollees with projected increases of $20 or more and 79 percent of those with premium increases of $10 to 20 stayed enrolled in the same plan. Furthermore, evidence from that study indicated that even when PDP enrollees respond to premium changes, enrollees who switch plans do not always end up with lower out-of-pocket costs for their prescription drug purchases. Finding ways to get more Part D enrollees engaged in the act of comparing and reviewing plans and making changes that could save them money remains an ongoing challenge for CMS and policymakers.
Jack Hoadley and Laura Summer are with Georgetown University; Juliette Cubanski is with the Kaiser Family Foundation; Elizabeth Hargrave is with NORC at the University of Chicago.
Exhibit 1. Number of Medicare Part D Stand-Alone Prescription Drug Plans, 2006-2014
Exhibit 2. Number of Medicare Part D Stand-Alone Prescription Drug Plans, by Region, 2014
Exhibit 3. Weighted Average Monthly Premiums for Medicare Part D
Exhibit 4. Distribution of Changes in Monthly Premium Amounts for Medicare Part D Stand-Alone Prescription Drug Plan Enrollees
Exhibit 5. Premiums in Medicare Part D Stand-Alone Prescription Drug Plans with Highest 2013 Enrollment, 2006-2014
Exhibit 6. Change in Weighted Average Premiums for Medicare Part D Stand-Alone Prescription Drug Plans, by Region, 2014
Exhibit 7. Share of Medicare Part D Stand-Alone Prescription Drug Plans,
Exhibit 8. Share of Medicare Part D Stand-Alone Prescription Drug Plans,
Exhibit 9. Share of Medicare Part D Stand-Alone Prescription Drug Plans,
Exhibit 10. Number of Medicare Part D Stand-Alone Prescription Drug Plans Available Without a Premium to Low-Income Subsidy Recipients, 2006-2014
Exhibit 11. Number of Benchmark Plans, by Region, 2014
Exhibit 12. Change in Number of Benchmark Plans, By Region, 2013-2014
Exhibit 13. Low-Income Subsidy (LIS) Enrollment by Benchmark Plan Status,