Medicare Advantage 2015 Data Spotlight: Overview of Plan Changes
In 2014, more than 16 million Medicare beneficiaries (30%) were enrolled in Medicare Advantage plans – private plans, such as HMOs or preferred provider organization (PPOs) that receive funds from the federal government (Medicare) to provide Medicare-covered benefits to enrollees. Under the current Medicare program, Medicare Advantage plans are offered as an alternative to the traditional Medicare fee-for-service program, and Medicare beneficiaries can enroll in a Medicare Advantage plan, change Medicare Advantage plans, or switch from Medicare Advantage to traditional Medicare during the annual open enrollment period. Federal payments to Medicare Advantage plans were gradually reduced by the Affordable Care Act of 2010 (ACA) with the goal of creating greater parity in payments between the traditional Medicare program and Medicare Advantage by 2017.1
Beneficiaries will be able to choose from 18 Medicare Advantage plans, on average, in 2015, the same number of plans as in 2014. While some plans will leave the market in 2015, others are entering or expanding and most enrollees (over 95 percent) will be able to remain in their same plan in 2015 if they choose. About 480,000 beneficiaries – less than 5 percent of all enrollees – will need to find new plans because their 2014 plan will no longer be available in 2015.2
Most beneficiaries (78 percent) will have access to zero-premium plans in 2015, though the emphasis on such plans could be declining. The average beneficiary who remains in the same Medicare Advantage plan in 2014 and 2015 will pay $41 per month, an increase of $7 per month, or 20 percent, on average; beneficiaries could avoid higher premiums by changing plans or decide that their current plan still is attractive despite the higher premium. All Medicare Advantage plans will include a limit on enrollees’ out-of-pocket expenses for services covered under Medicare Parts A and B, but the plans’ limits will be about $240 higher, on average, in 2015 than in 2014. Deductibles for Part D drug coverage will also increase, on average. These changes are consistent with historical trends, and indicate that Medicare Advantage plans can be expected to provide somewhat less financial protection in 2015 than they have historically.
This Data Spotlight, like those prepared by us in previous years, reviews trends in Medicare Advantage plan choices available to beneficiaries, premiums and other plan characteristics in 2015. The brief does not, however, analyze changes in benefits or cost sharing requirements for individual services, which could be major factors in an enrollee’s out of pocket expenses.3 Nor does it examine changes in provider networks that could affect beneficiaries’ access to preferred physicians and other health care providers. This spotlight is part of a series of spotlights tracking key changes in the Medicare Advantage program. The analysis is based on publicly available data from the Centers for Medicare and Medicaid Services (CMS).4
Plan Offerings in 2015
Number of Plans Offered
In total, 1,945 Medicare Advantage plans will be available nationwide for individual enrollment in 2015 (Exhibit 1), 69 fewer plans than were available in 2014 as the aggregate number of departing plans (378 plans) outnumber new entrants (309 plans; Exhibit 2).5
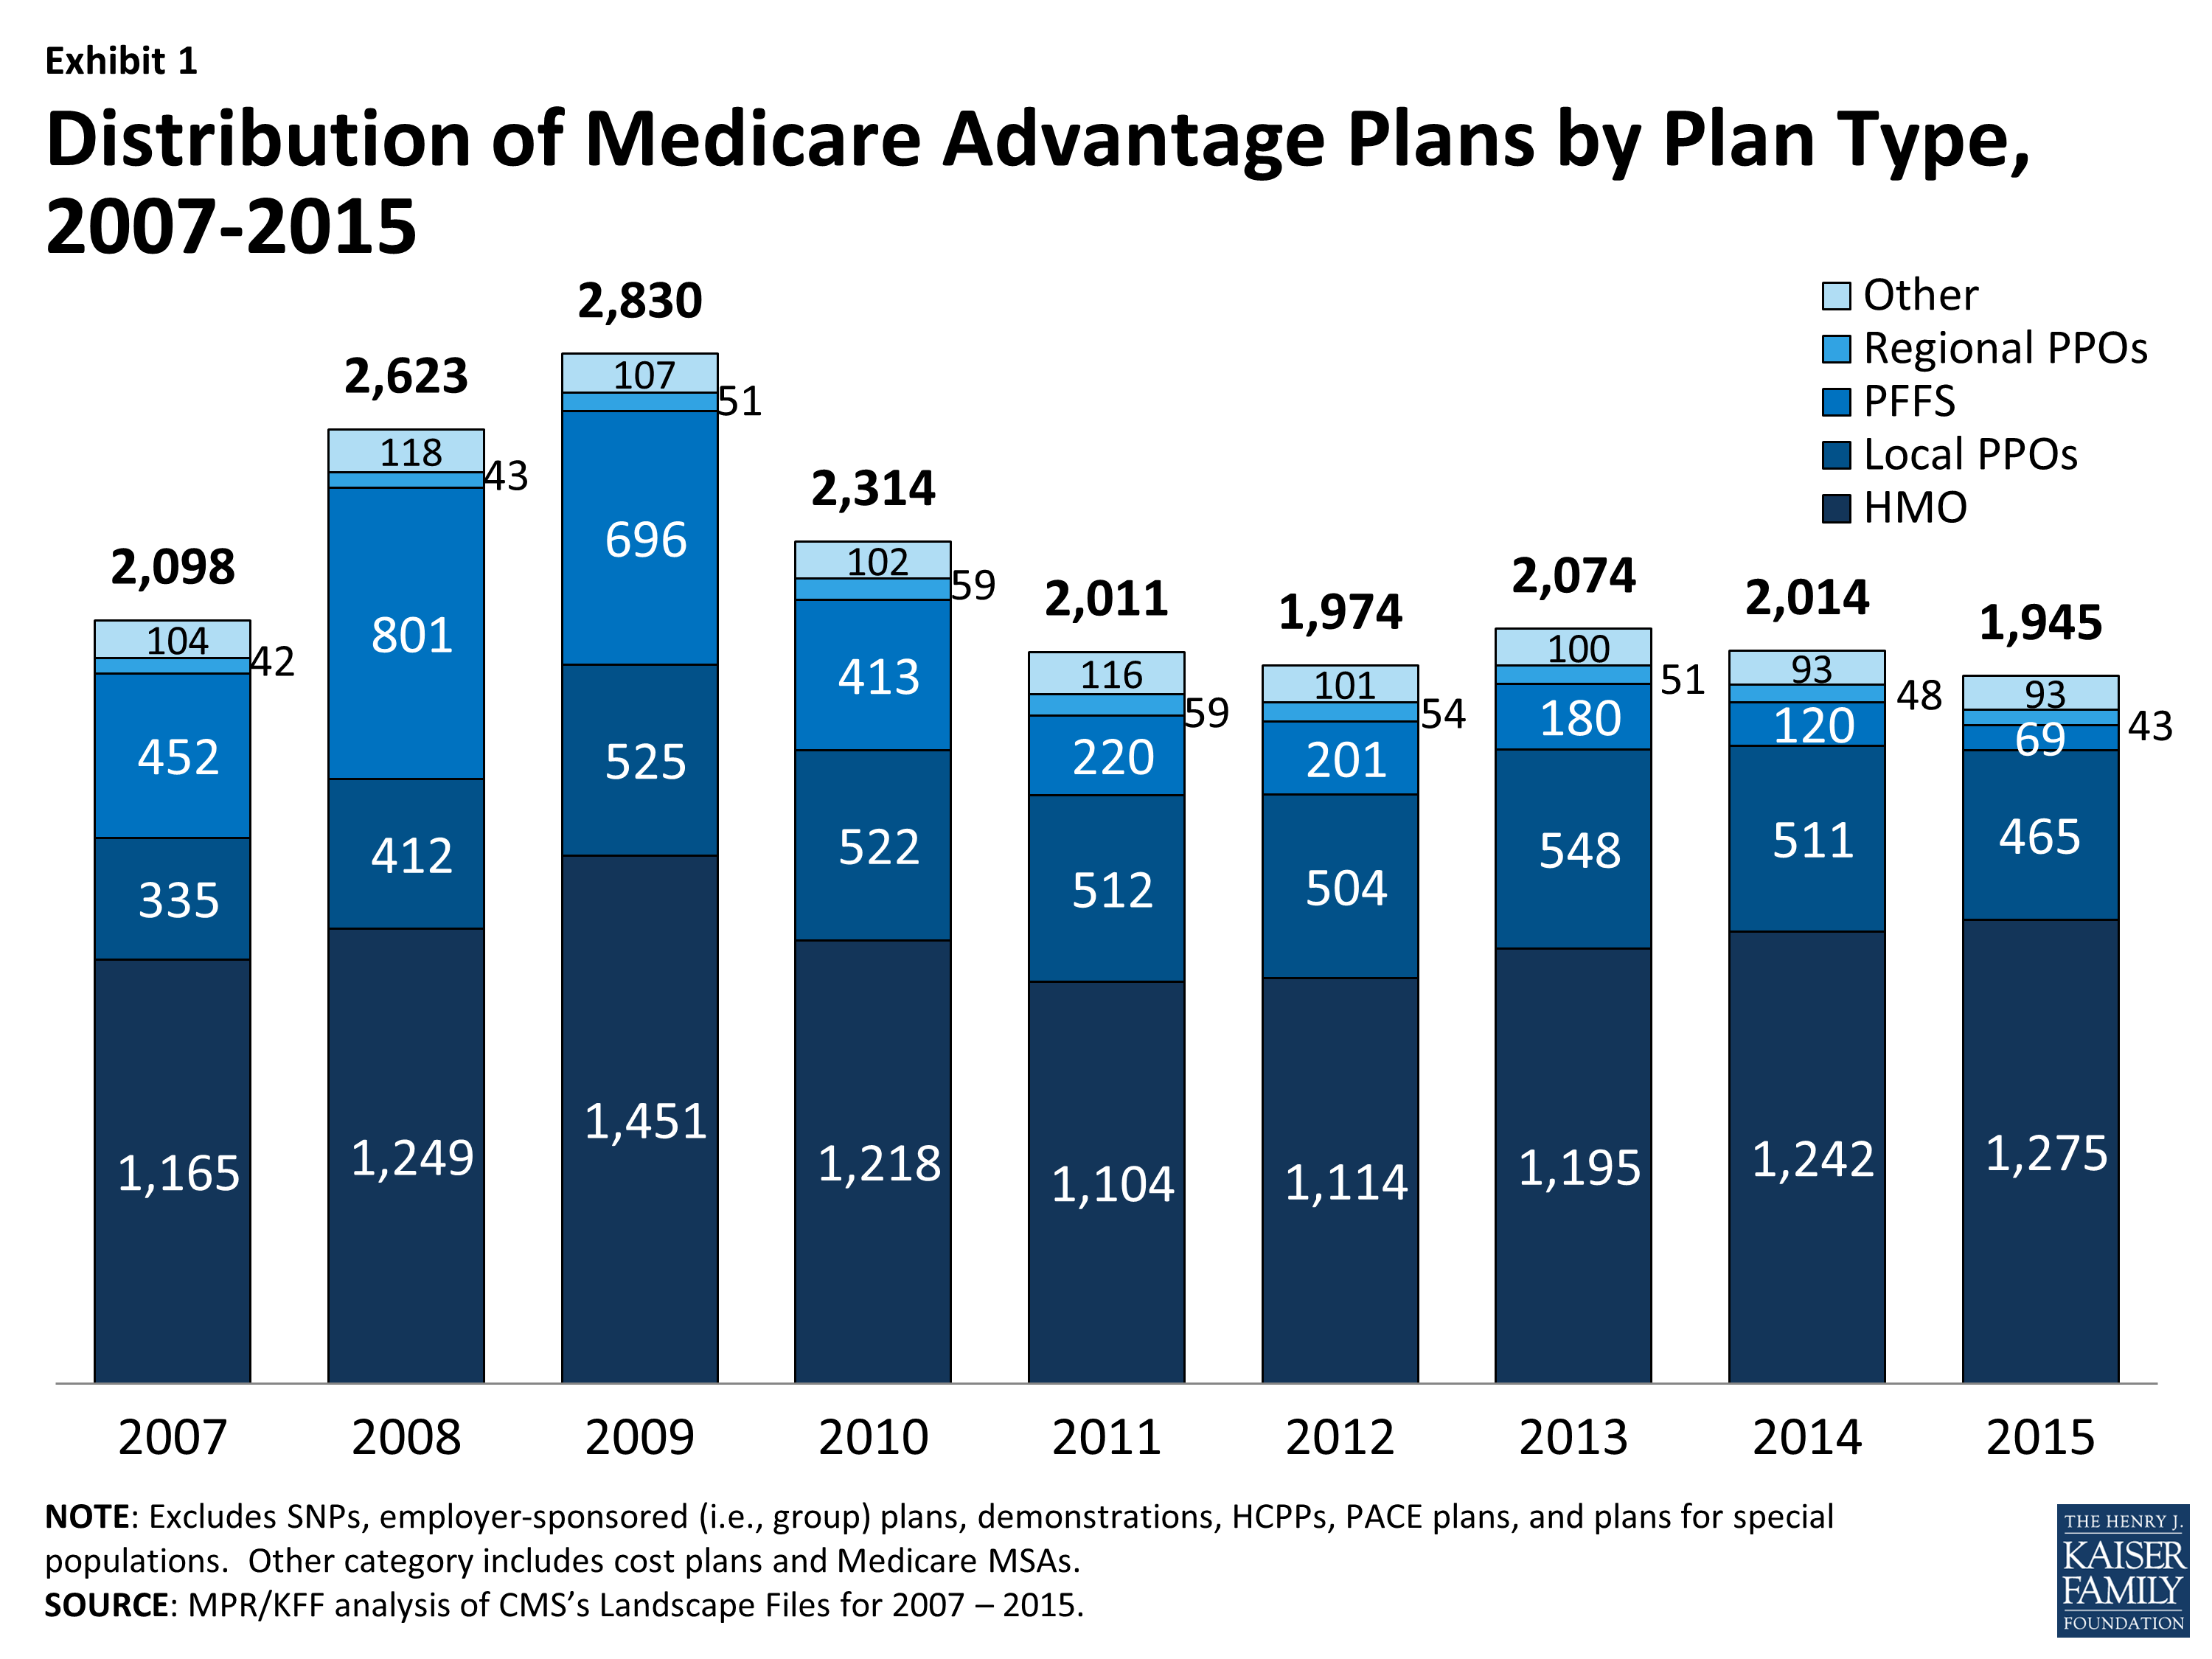
Exhibit 1: Distribution of Medicare Advantage Plans by Plan Type, 2007-2015
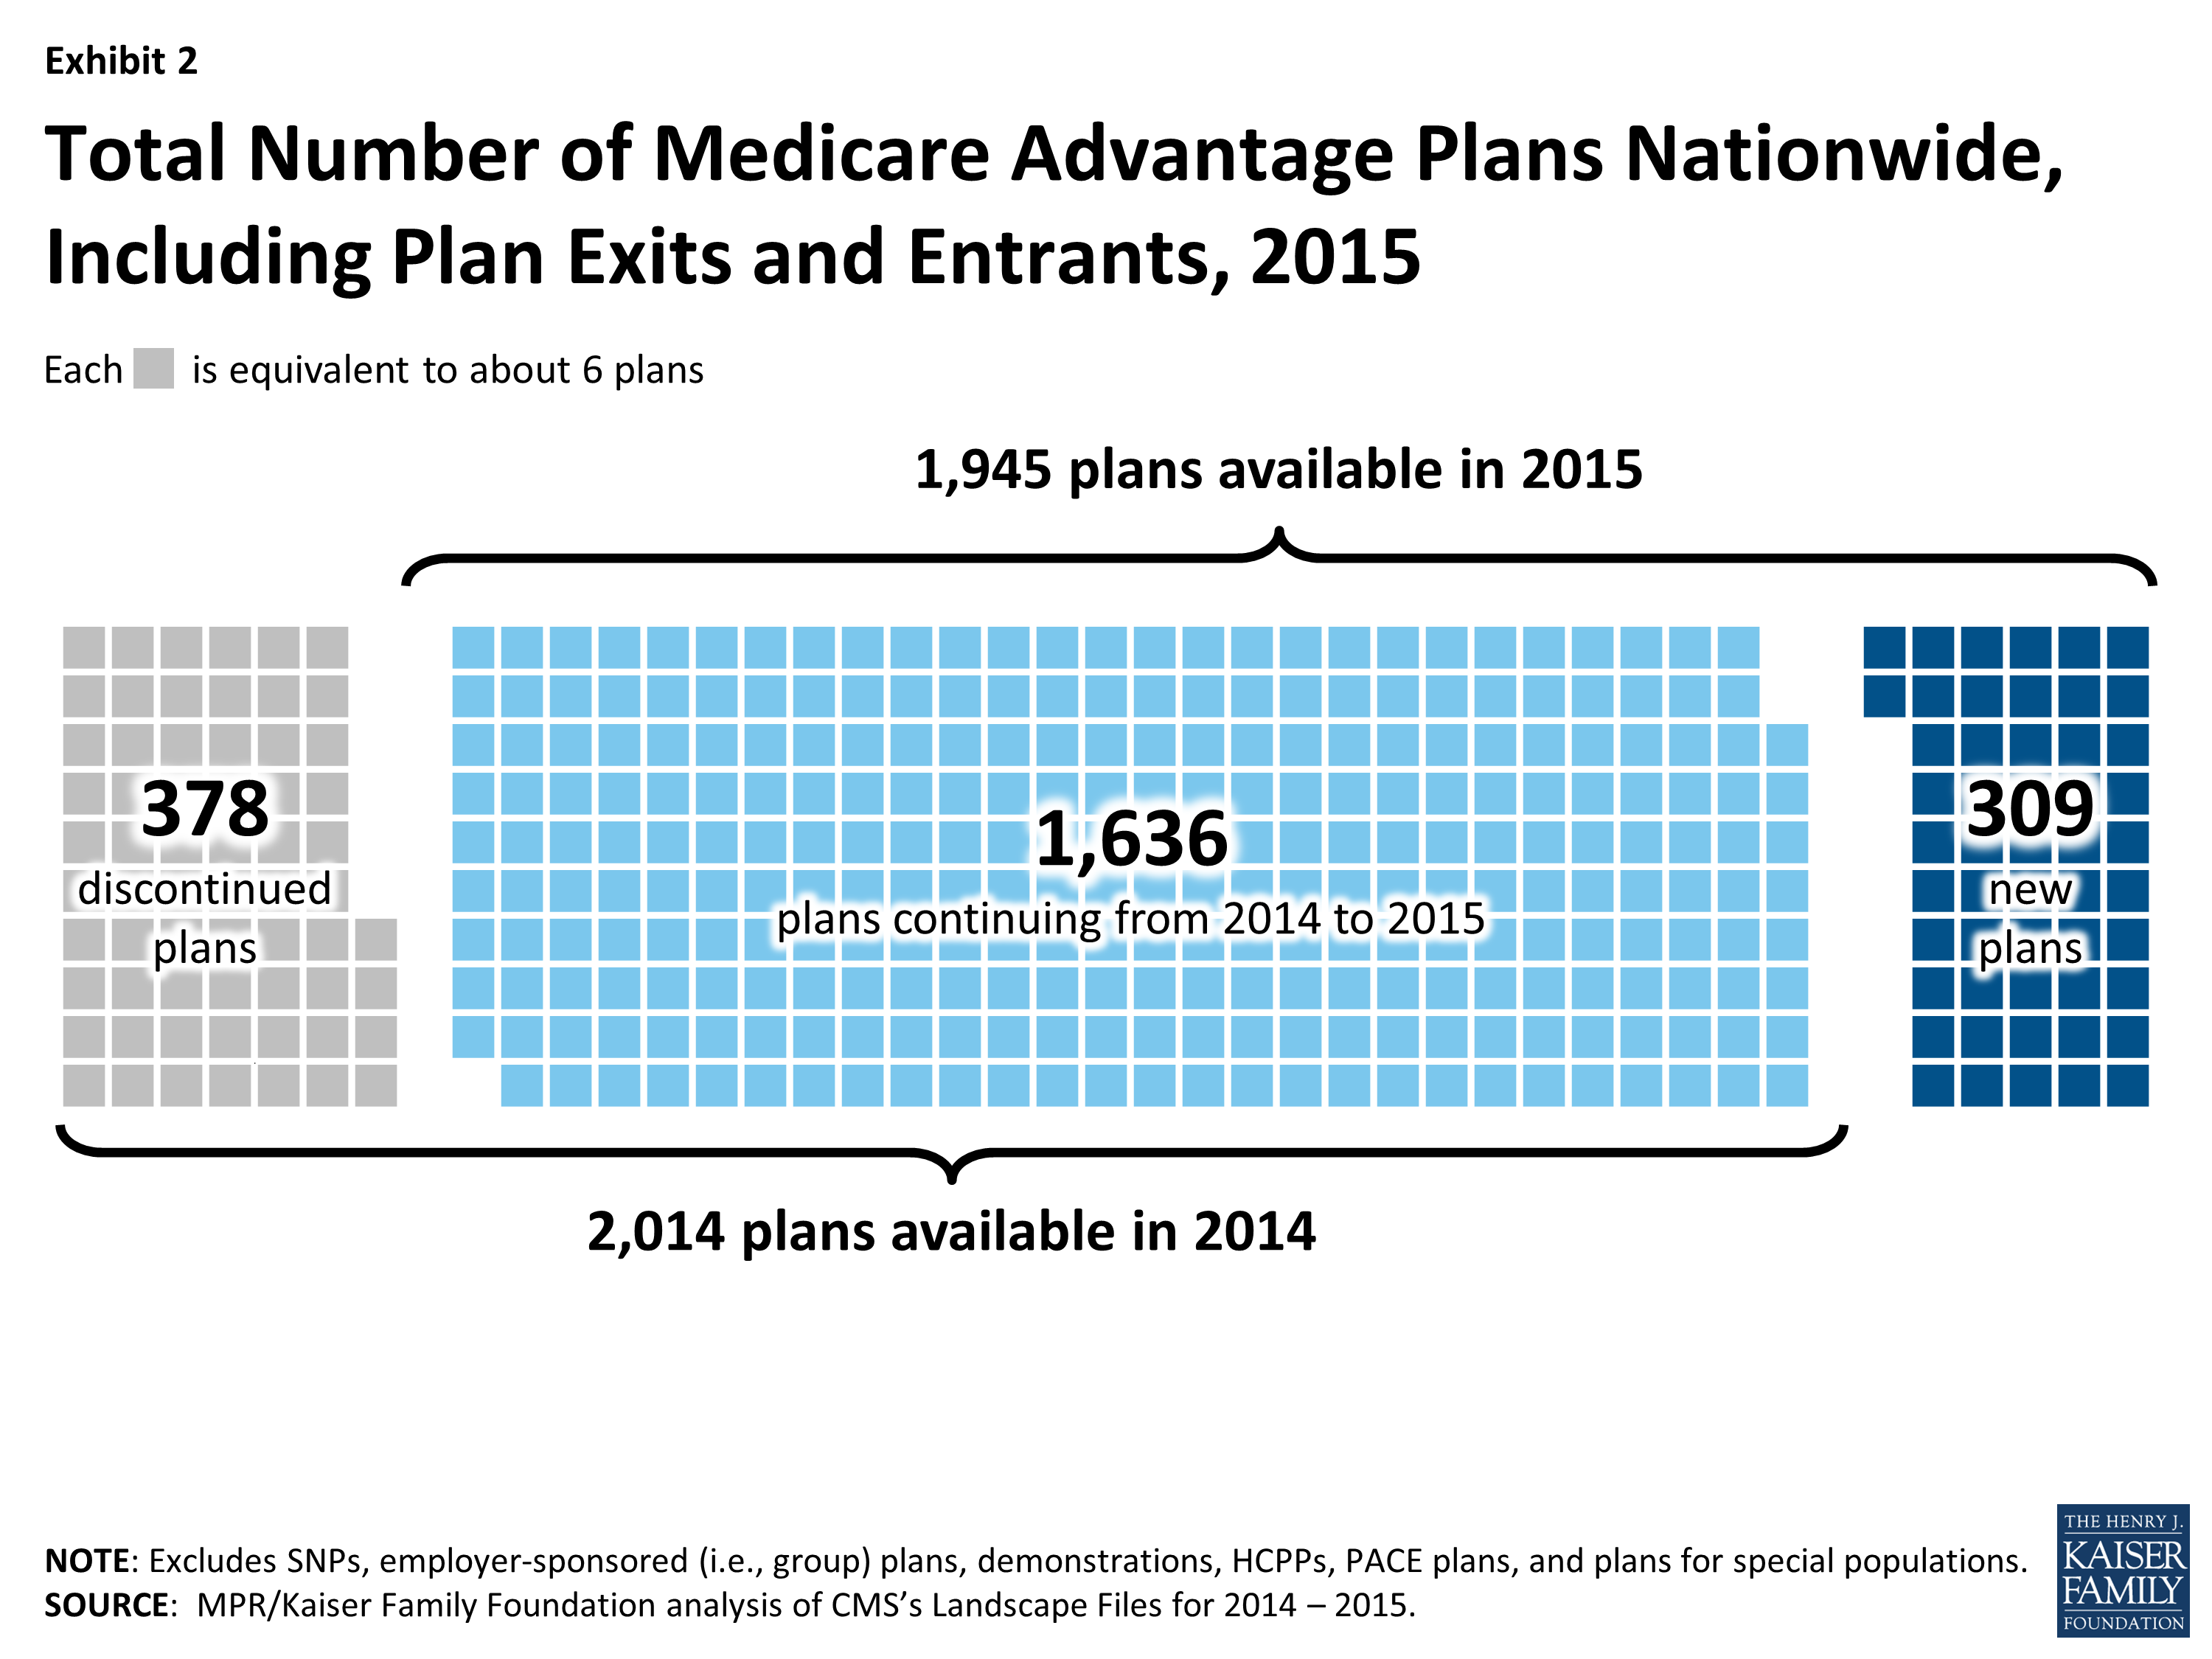
Exhibit 2: Total Number of Medicare Advantage Plans Nationwide, Including Plan Exits and Entrants, 2015
To a considerable extent, the decline in plans reflects the diminished role of PFFS plans in the Medicare Advantage marketplace since the Medicare Improvements for Patients and Providers Act (MIPPA) of 2008, which required most PFFS plans to adopt provider networks. In 2015, 69 PFFS plans will be offered compared to 120 in 2014 and a high of 801 in 2008 (Table A1). The number of local PPOs offered will decline by 46 plans (from 511 in 2014 to 465 in 2015), and the number of regional PPOs will decline by 6 plans (from 48 in 2014 to 43 in 2015). In contrast, the total number of HMOs available for enrollment will increase from 1,242 plans to 1,275 between 2014 and 2015.
Earlier analysis provides detail on the nature of change at the national and state level as plans enter and depart the market in 2015.6 While virtually every state (except AK and WY) will have some change in plan offerings, most of the plans exiting the market had relatively few enrollees and most had average or below average quality star ratings.
Medicare beneficiaries will be able to choose from among 18 plans, on average, in 2015 – the same number of plans as in 2014 (Exhibit 3). Beneficiaries in metropolitan areas will be able to choose from 20 plans, on average, the same number of plans as in 2014. Beneficiaries in non-metropolitan areas will be able to choose from among 10 plans, on average, down one plan from 2014. The average number of plans available in the lowest cost counties will somewhat decrease from 17 plans to 15 plans while the average number of plans available in the highest cost counties will increase from 21 plans to 22 plans (Table A2).
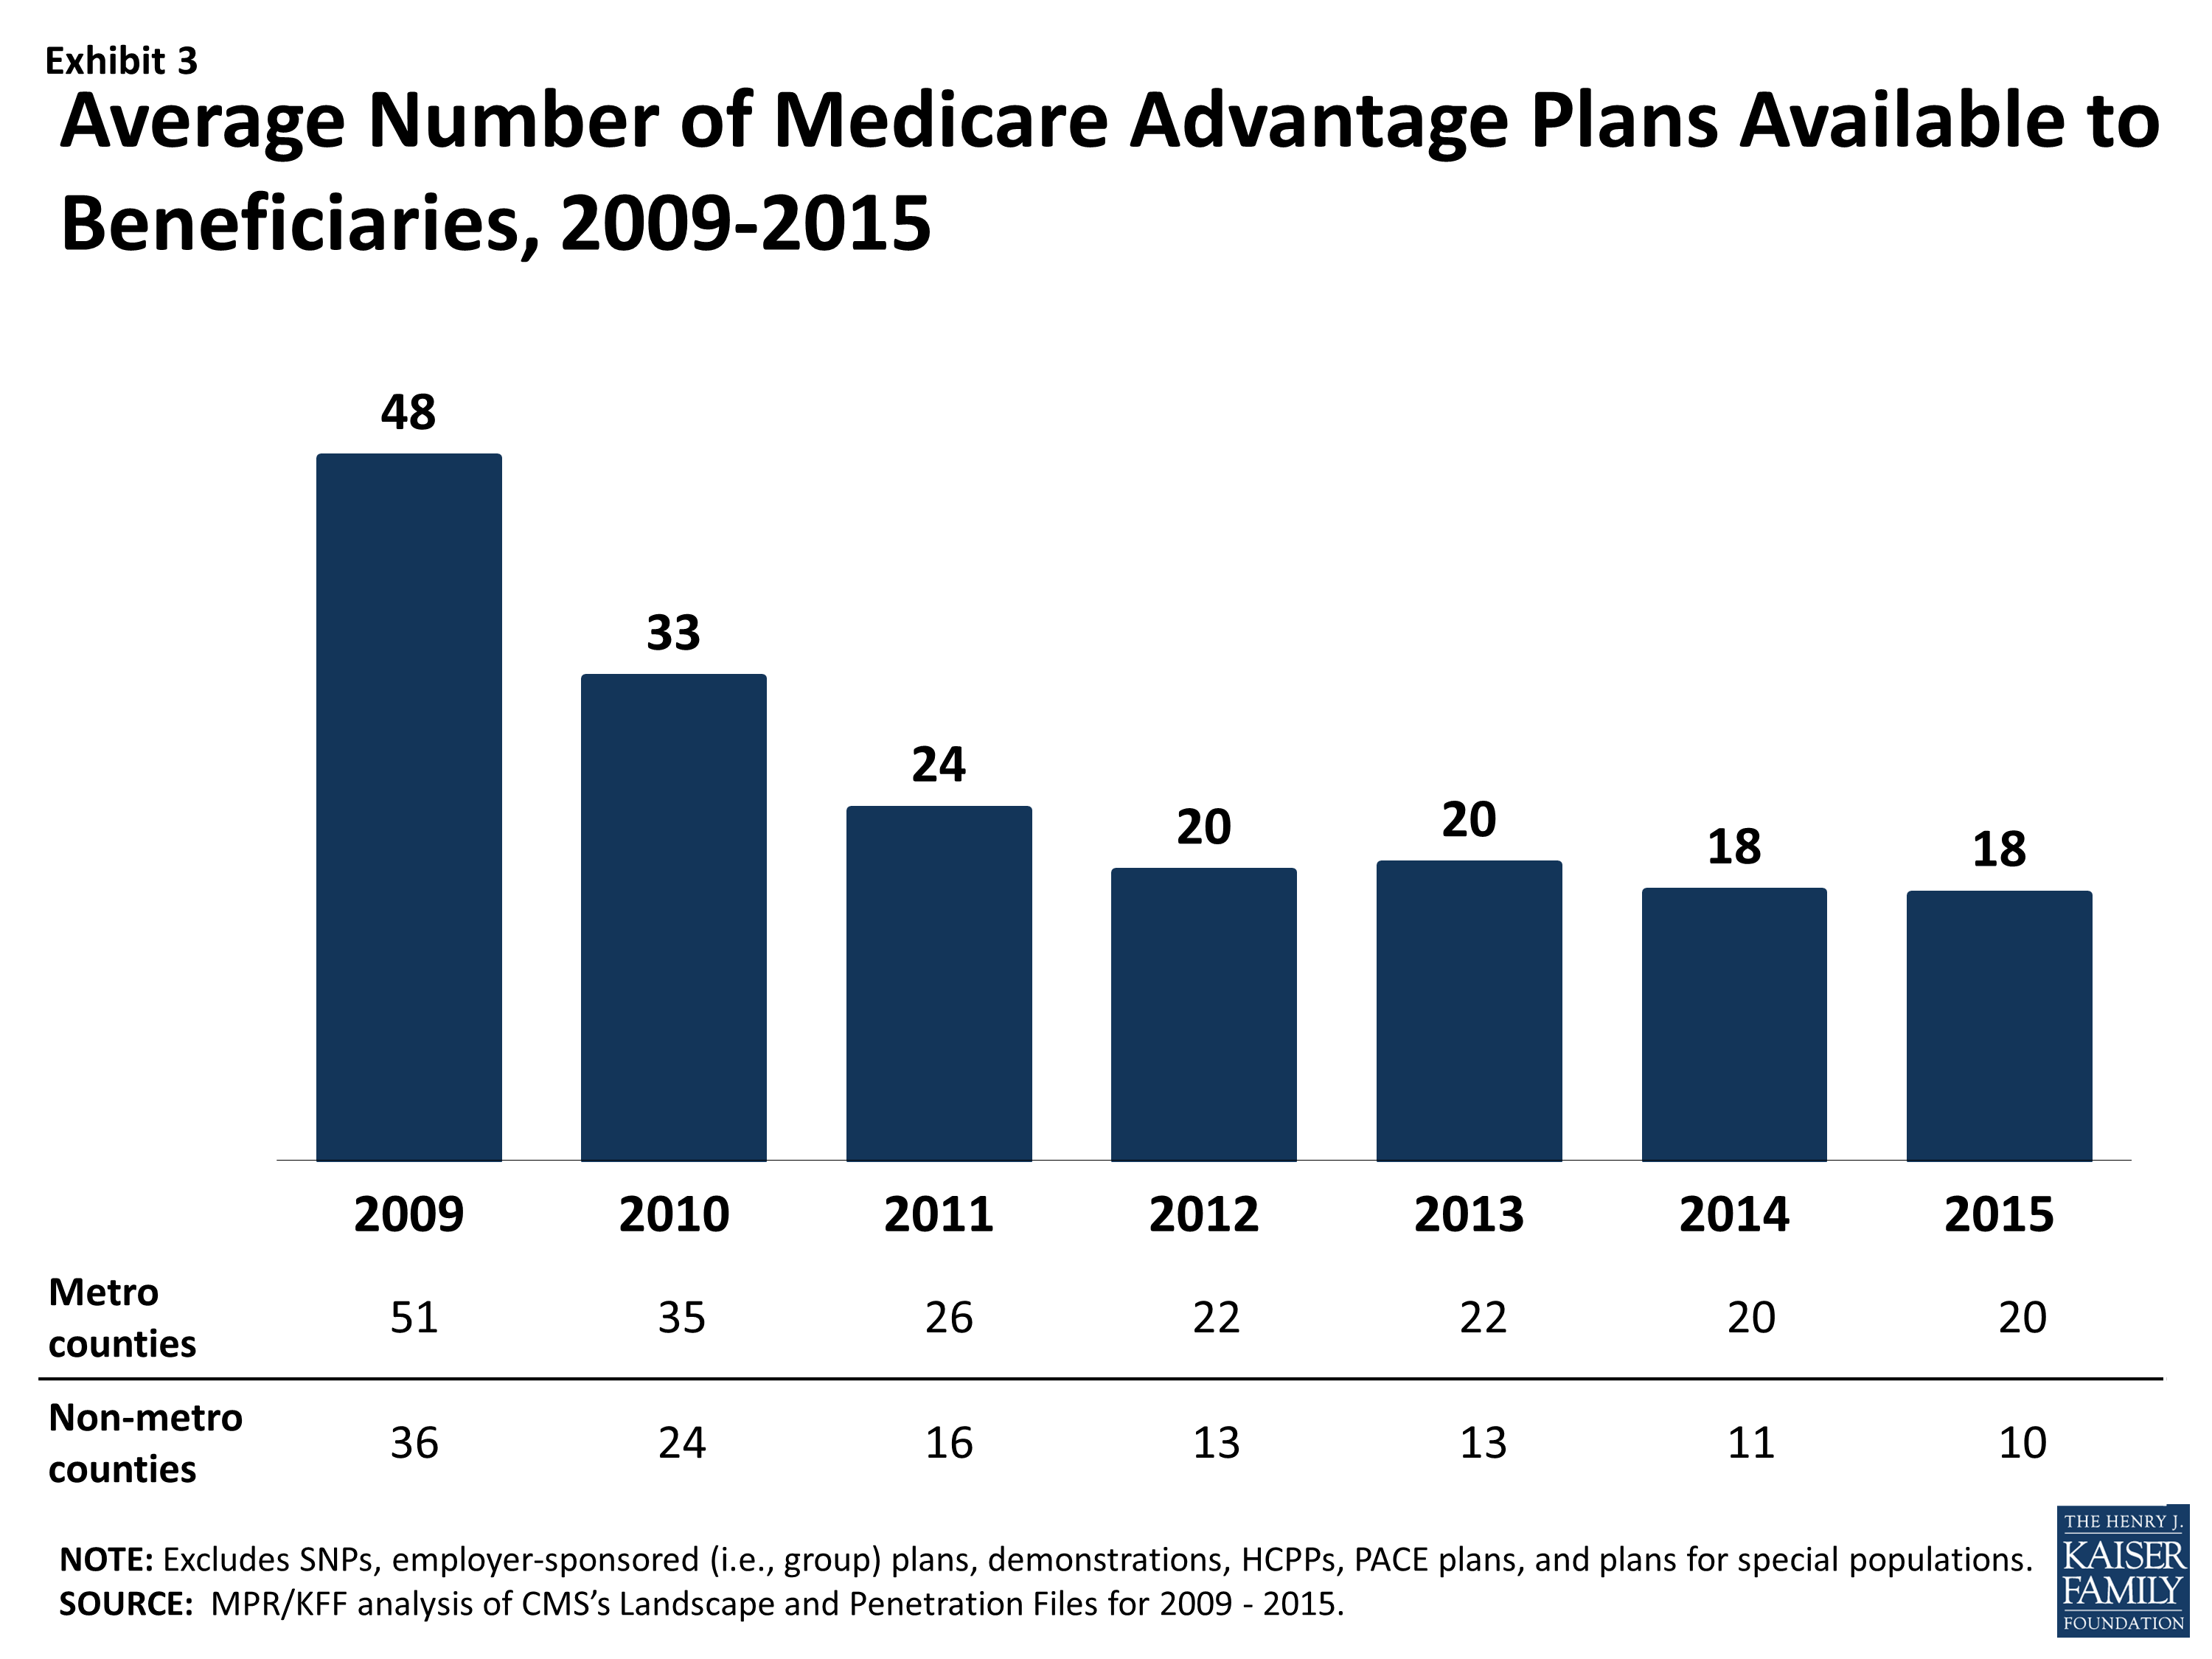
Exhibit 3: Average Number of Medicare Advantage Plans Available to Beneficiaries, 2009-2015
Access to Medicare Advantage Plans
As in recent years, virtually all Medicare beneficiaries (99%) will continue to have access to a Medicare Advantage plan as an alternative to traditional Medicare (Exhibit 4). All beneficiaries in metropolitan areas (100%) and the vast majority of beneficiaries in non-metropolitan areas (97%) will continue to have access to one or more Medicare Advantage plans. In terms of choice, the main change between 2014 and 2015 is that fewer beneficiaries, particularly those in non-metropolitan areas, will have access to a PFFS plan in 2015.
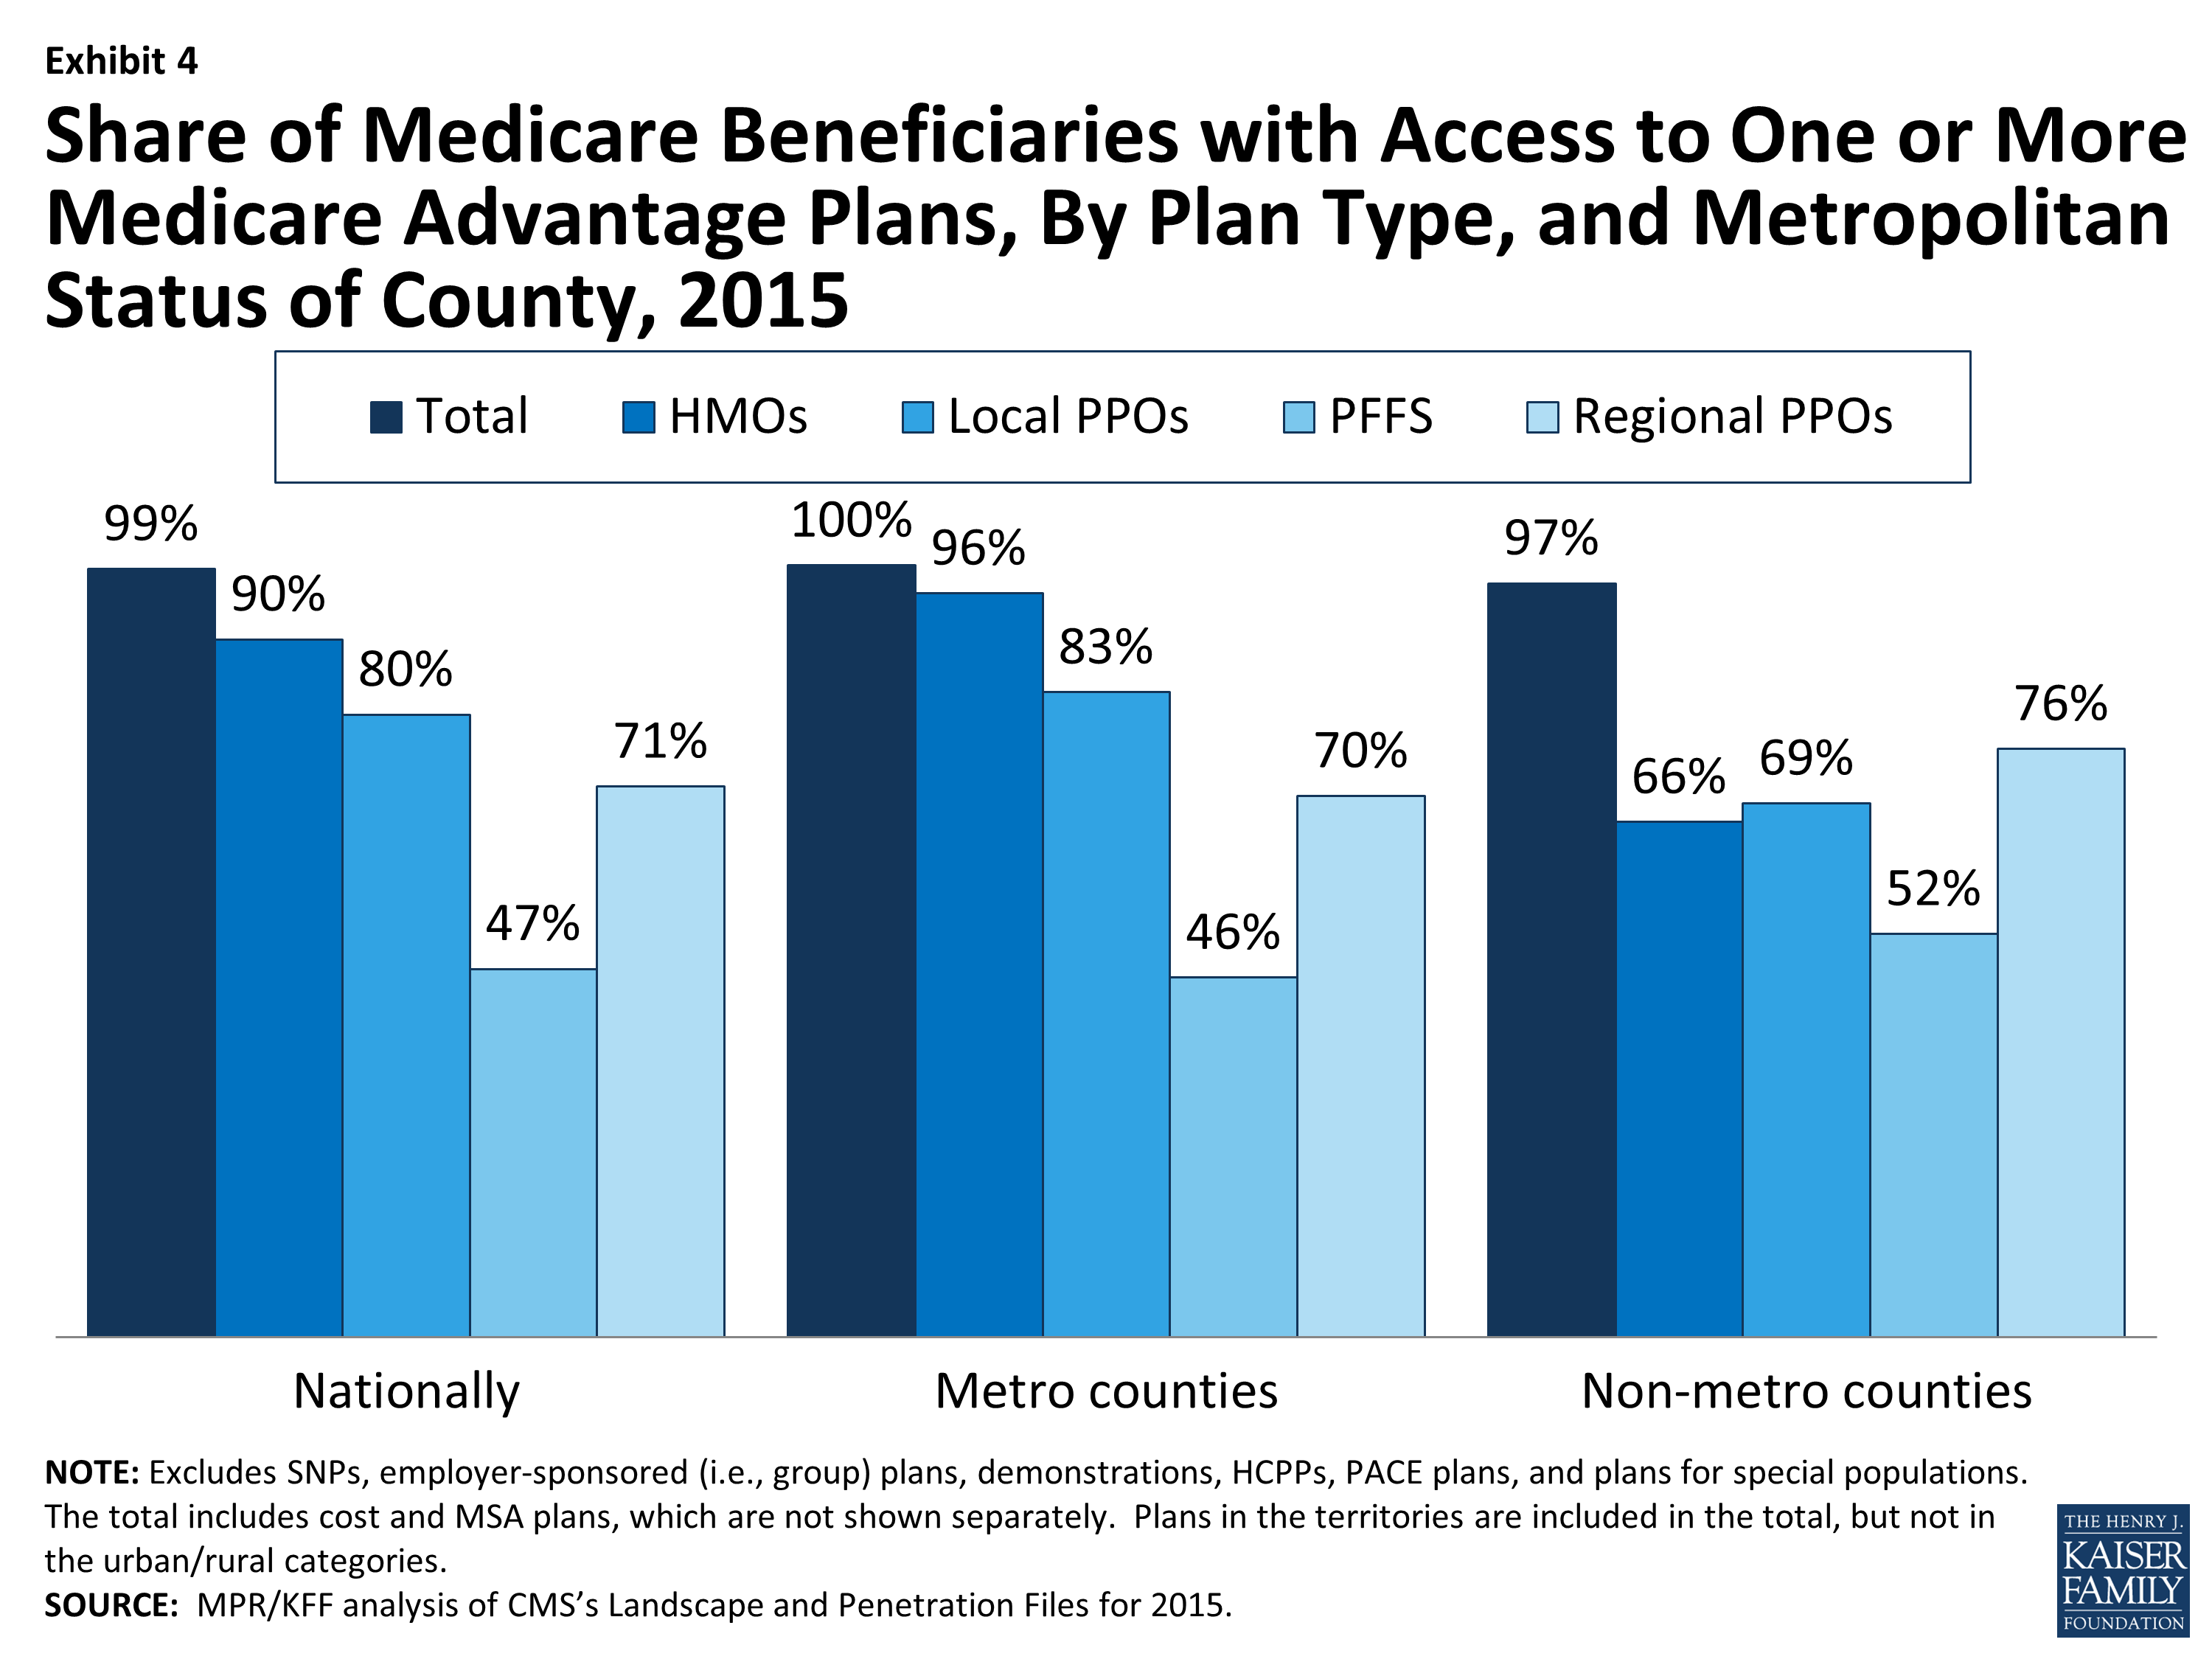
Exhibit 4: Share of Medicare Beneficiaries with Access to One or More Medicare Advantage Plans, By Plan Type, and Metropolitan Status of County, 2015
Plan Premiums
People on Medicare have said that many factors are important to them when selecting their plan, including plans’ premiums, cost-sharing, extra benefits, prescription drug coverage, and provider networks.7 Premiums are the most visible and the easiest of these factors to compare, even though the other factors are also important as they affect beneficiaries’ out-of-pocket costs and access to providers. Medicare beneficiaries enrolled in Medicare Advantage plans pay the Part B premium like other beneficiaries (less any rebate provided by the Medicare Advantage plan). Medicare Advantage enrollees may also pay an additional monthly premium charged by the Medicare Advantage plan for plan benefits and prescription drug coverage. This analysis of premiums includes only Medicare Advantage plans that offer prescription drug coverage (MA-PDs), and excludes the minority of Medicare Advantage plans (14%) that do not cover prescription drugs, in order to better approximate apples-to-apples comparisons across plan types and years.
Monthly Premiums (Unweighted By Enrollment)
We first examined the change in premiums, without weighting them for plan enrollment, to show the changes plans are making and implications for average premiums in plans available to beneficiaries. The analysis includes plans with no premiums as well as plans with monthly premiums. In 2015, the average premium for MA-PDs (unweighted by plan enrollment) will be $53 per month – an increase of $2 from 2014 (Table A3). Premiums for HMOs will average $38 per month, up $3 from 2014. Similar to prior years, HMOs will continue to have lower premiums than regional PPOs ($68 per month), local PPOs ($81 per month) and PFFS plans ($88 per month). Regional PPOs will have the largest change in premiums, on average, in which average premiums will increase 14 percent, on average, from $59 per month in 2014 to $68 per month in 2015. In contrast, premiums for PFFS plans will decrease, on average, from $91 per month in 2014 to $88 per month in 2015.
Monthly Premiums (Weighted By Enrollment), Assuming Enrollees Remain in the Same Plan
Our second analysis of Medicare Advantage premiums examines the impact of premium changes among plans offered in both years, assuming enrollees remained in the same plan. These enrollee “weighted average” premiums are a clearer indication than unweighted premiums of the amount paid by the average Medicare Advantage enrollee because enrollment differs substantially across plans. Similar to the prior analysis, this analysis includes plans with no premiums as well as plans with monthly premiums.
The premiums for MA-PDs available in both years, weighted by 2014 enrollment, will be about $41 per month, an increase of $7 per month (or 20 percent) compared to 2014 (Exhibit 5). In 2015, as in previous years, monthly premiums for HMO enrollees will be lower than for all other plan types, on average, assuming beneficiaries stay in their same plan. Enrollees in local PPOs will pay more in monthly premiums than enrollees in other types of Medicare Advantage plans, and will face larger increases in premiums (in absolute dollar terms) than enrollees in HMOs, regional PPOs, and PFFS plans if they remain in the same plan, on average. Historically, actual average premiums, available after beneficiaries respond to new plan choices, have been lower than premiums shown in this analysis because beneficiaries tend to select lower premium plans, if they switch plans.8 We will analyze the premiums for plans selected by beneficiaries in 2015 after the open enrollment period.
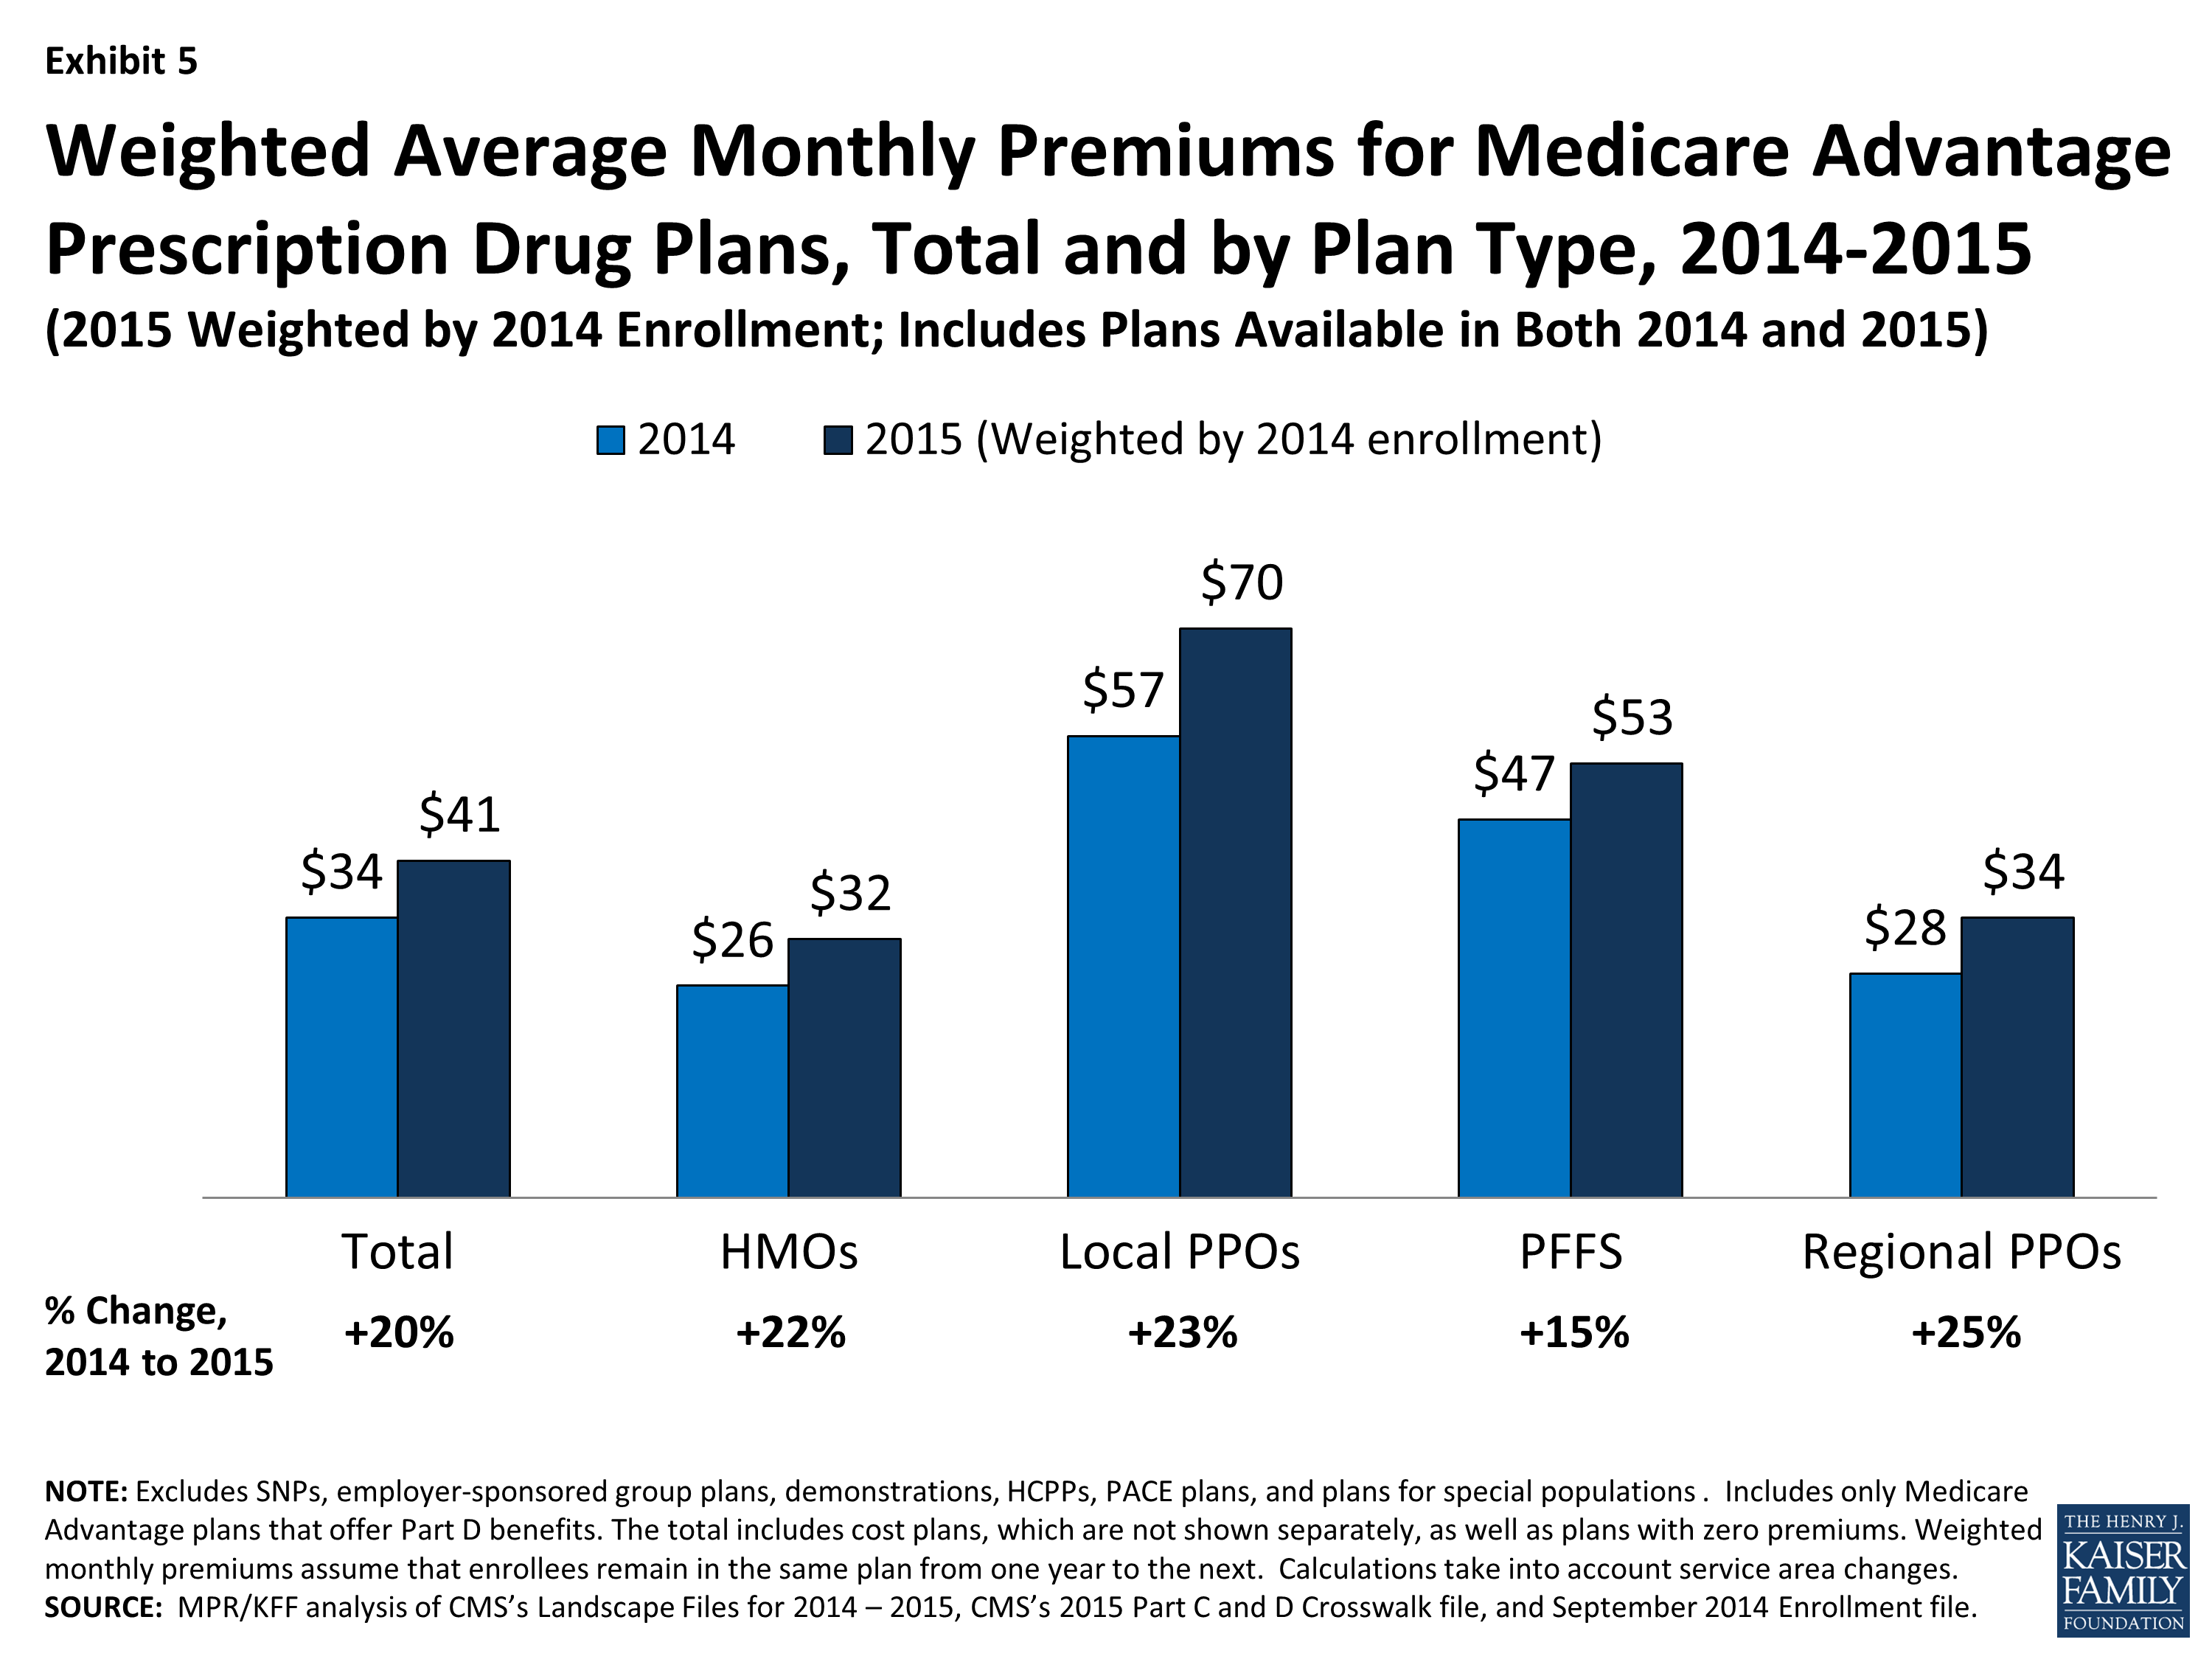
Exhibit 5: Weighted Average Monthly Premiums for Medicare Advantage Prescription Drug Plans, Total and by Plan Type, 2014-2015
In general, MA-PDs that will continue to be offered in 2014 had lower average premiums in 2014 (weighted by enrollment) than plans that are exiting the market in 2014 (Table A1). Plans remaining in the market had average premiums of $34 per month whereas plans exiting the market had average premiums of $52 per month. This pattern is true both in the aggregate and for most plan types, and suggests that these higher premium plans that are exiting the market were less competitive than the plans with lower premiums. As was true last year, PFFS plans are an exception to this pattern; the average premium for PFFS departing plans was slightly lower than the average premium for continuing plans in 2014 ($45 versus $47). Since plan premiums are a function of many factors (including benefits, cost-sharing, provider networks, local practice patterns, and payments from the Medicare program), interpreting differences in premiums by plan type is complex.9
Access to Plans with No Premium
Medicare Advantage plans with no additional premium other than the Medicare Part B premium – so called “zero premium plans” – have been a feature of the Medicare Advantage landscape for many years. Slightly more than three-quarters (78%) of all beneficiaries will have access to a zero-premium MA-PD in 2015 (Exhibit 6). This is a decline from 84 percent in 2014, and a high of 94 percent in 2009. However, despite declines in the availability of zero premium plans, our analysis has shown that historically the share of beneficiaries enrolled in zero-premium plans has remained relatively steady; since 2011, about half of all Medicare Advantage enrollees have been enrolled in a zero-premium MA-PD.10
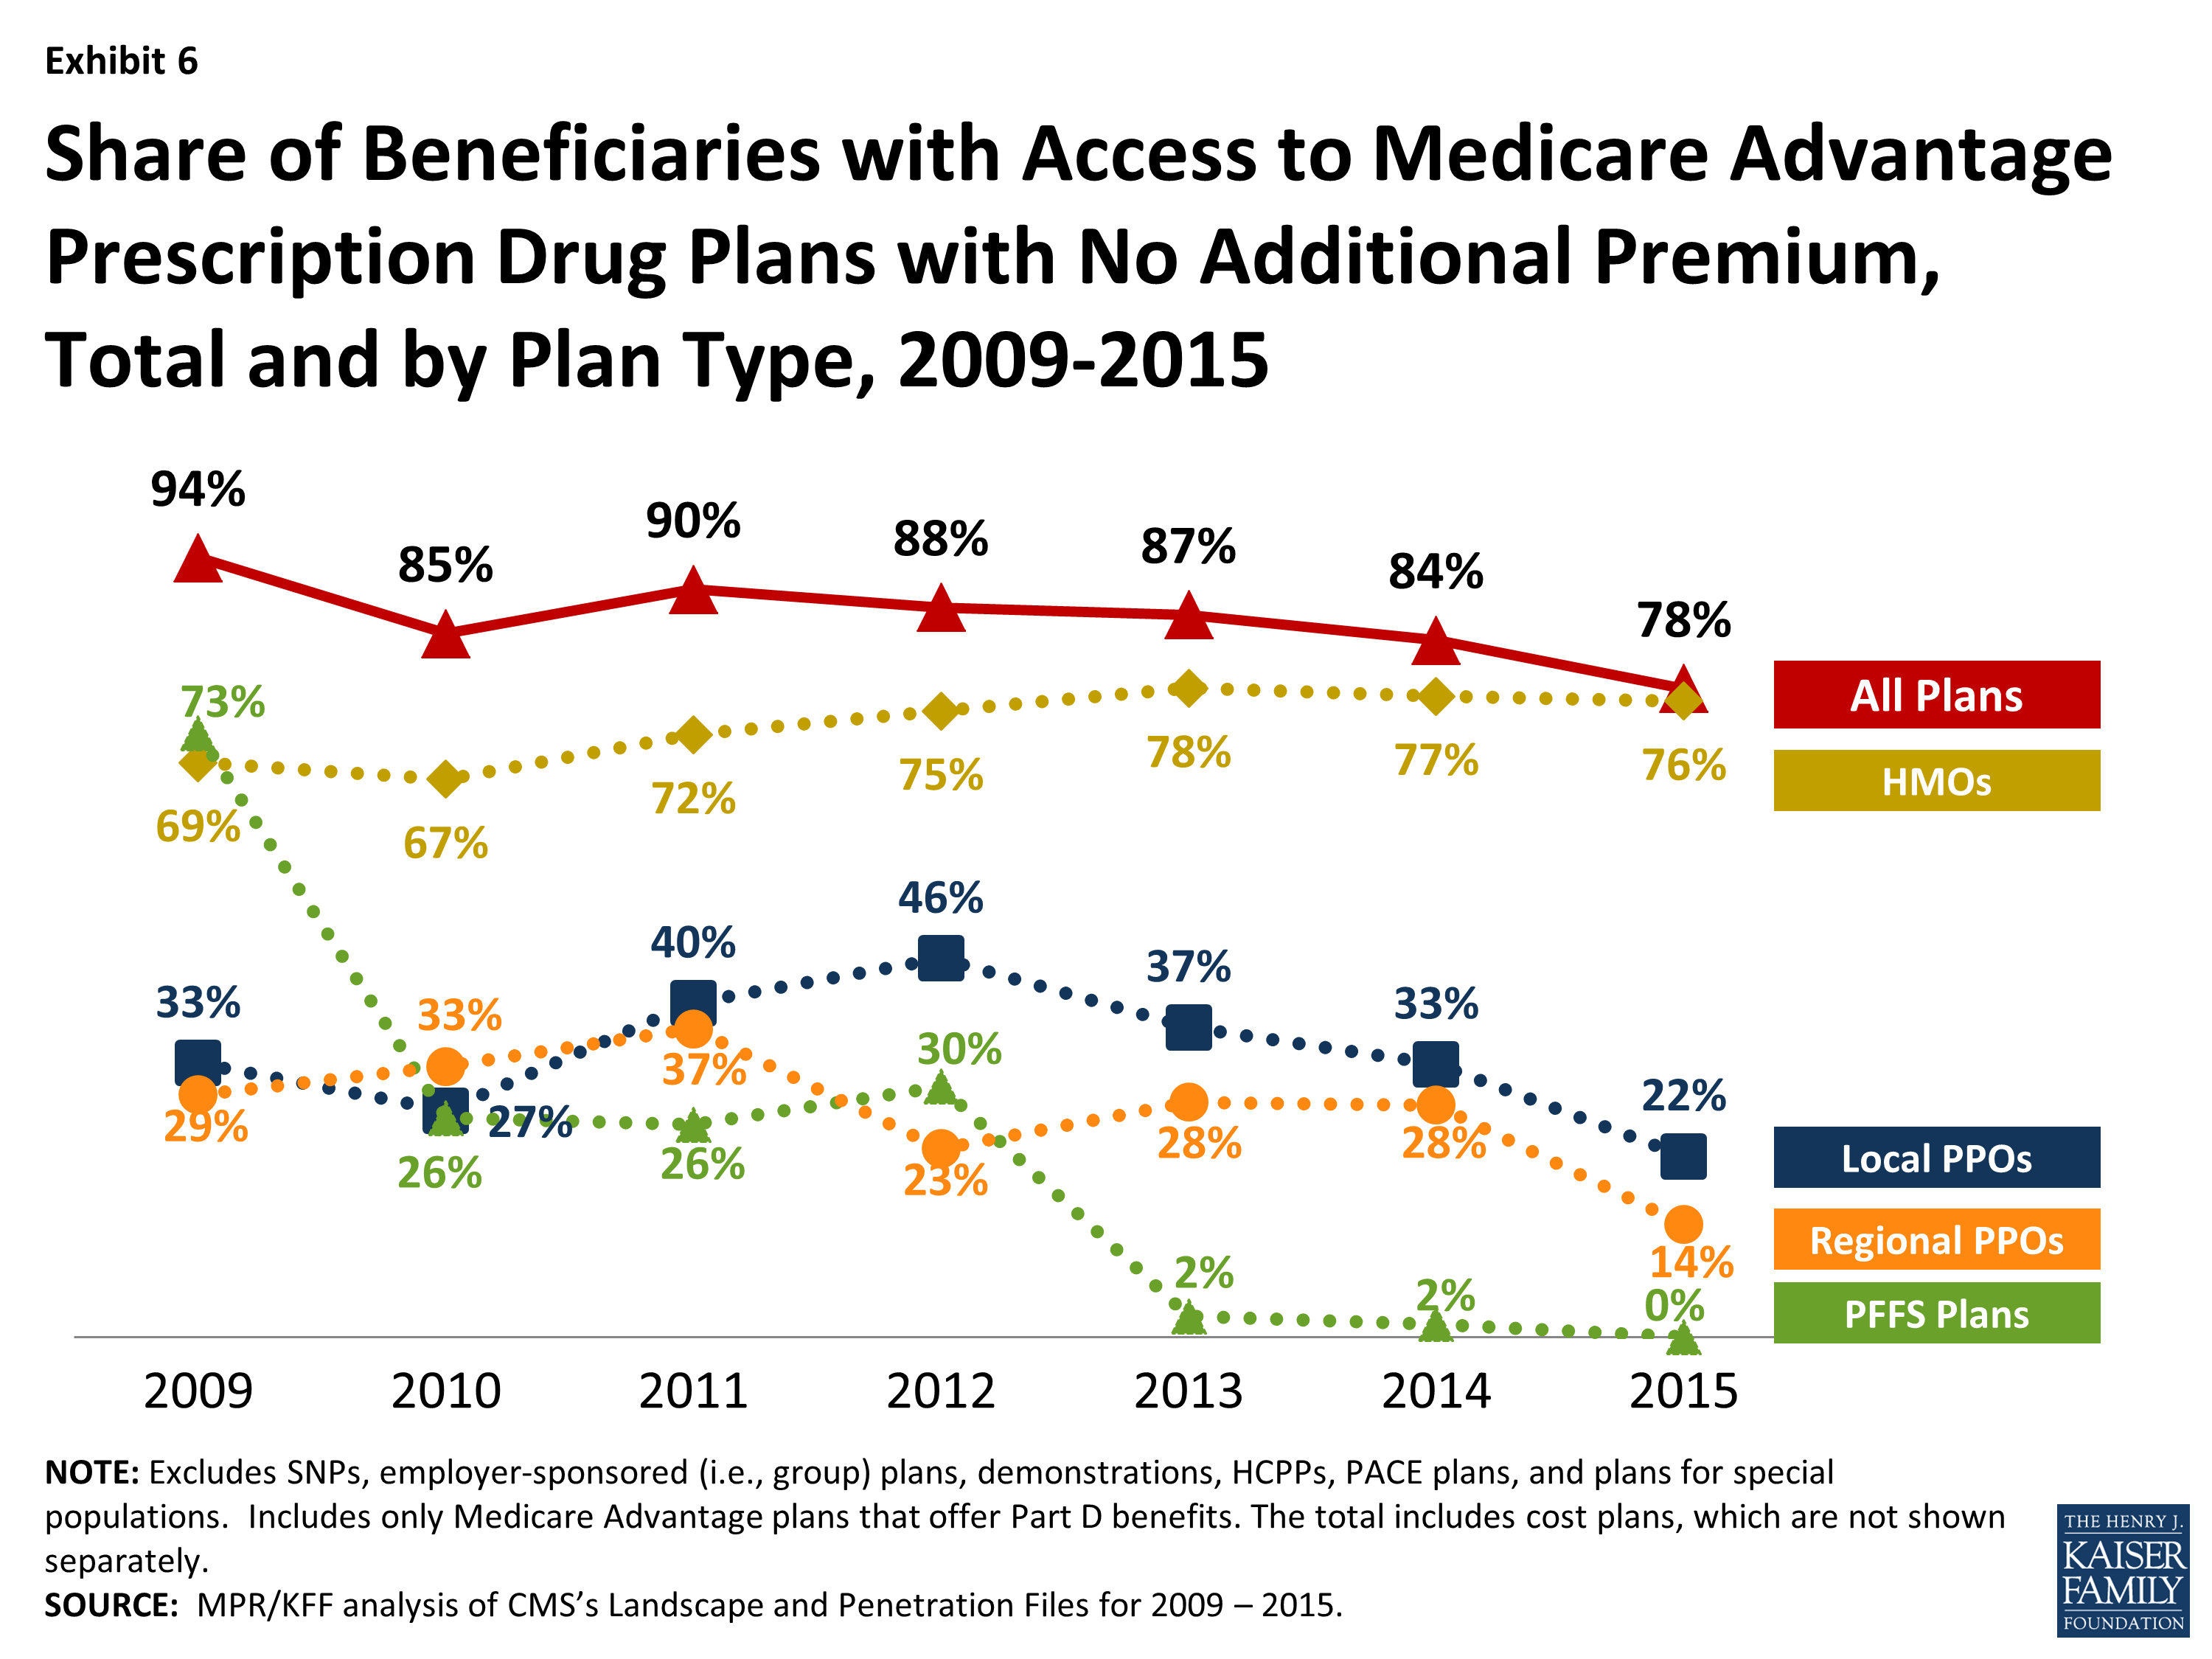
Exhibit 6: Share of Beneficiaries with Access to Medicare Advantage Prescription Drug Plans with No Additional Premium, Total and by Plan Type, 2009-2015
As in past years, beneficiaries are most likely to have zero premium HMOs available. In 2015, 76 percent of beneficiaries will have access to at least one zero premium HMO, while a minority of beneficiaries will have access to zero-premium local PPOs (22%) and regional PPOs (14%); no zero-premium PFFS plans will be available.
| Box 1: Availability of Special Needs Plans in 2015 |
|
Special Needs Plans (SNPs) are a type of Medicare Advantage plan that was authorized in 2003 as part of the Medicare Prescription Drug, Improvement and Modernization Act (MMA) to provide a managed care option for beneficiaries with significant or relatively specialized health care needs. Medicare beneficiaries can enroll in a SNP if they are dually eligible for Medicare and Medicaid (D-SNPs), require an institutional-level of care (I-SNPs), or have a severe or chronic condition (C-SNP). Most SNPs are HMOs, but they can also be PPOs.
–
When SNPs were authorized, there were few requirements beyond those otherwise required of other Medicare Advantage plans. The Medicare Improvements for Patients and Providers Act (MIPPA) of 2008 established additional requirements for SNPs, including requiring all SNPs to provide a care management plan to document how care would be provided for enrollees and requiring C-SNPs to limit enrollment to beneficiaries with specific diagnoses or conditions. As a result of the new MIPPA requirements, the number of SNPs declined in 2010. The ACA required D-SNPs to have a contract with the Medicaid agency for every state in which the plan operates, beginning in 2013. Additionally, in 2013, joint federal-state financial alignment demonstrations to improve the coordination of Medicare and Medicaid for dually eligible beneficiaries began to enroll beneficiaries. Today, financial alignment demonstrations are underway in 12 states: California, Colorado, Illinois, Massachusetts, Michigan, Minnesota, New York, Ohio, South Carolina, Texas, Virginia, and Washington. The financial alignment demonstrations could influence the availability of D-SNPs in these states, either increasing or decreasing the availability of SNPs, depending on the design of the demonstration. –
In 2015, 548 SNPs will be available, a slight decrease from the 560 plans available in 2014 (Exhibit 7; Table A7). The availability of SNPs will continue to vary across states in 2015, as it has in prior years. In 2015, at least one SNP of any type will be available in all states but seven (AK, MT, NH, ND, SD, VT, and WY); while Maine did not have SNPs available in 2014, 3 new D-SNPs will be available in Maine in 2015. As in 2014, SNPs will be most numerous in selected high population states, notably Florida (92 plans), California (69 plans), New York (56 plans), and Texas (31 plans). While the number of available SNPs declined in three (FL, NY, and TX) of these four highly populated states, Florida in particular will see a decline in the total number of available SNPs from 130 SNPs in 2014 to 92 SNPs in 2015. This decline partly reverses the growth in SNPs in Florida between 2013 and 2014 (from 112 plans in 2013 to 130 plans in 2014), and is proportionate across all plan types.
–
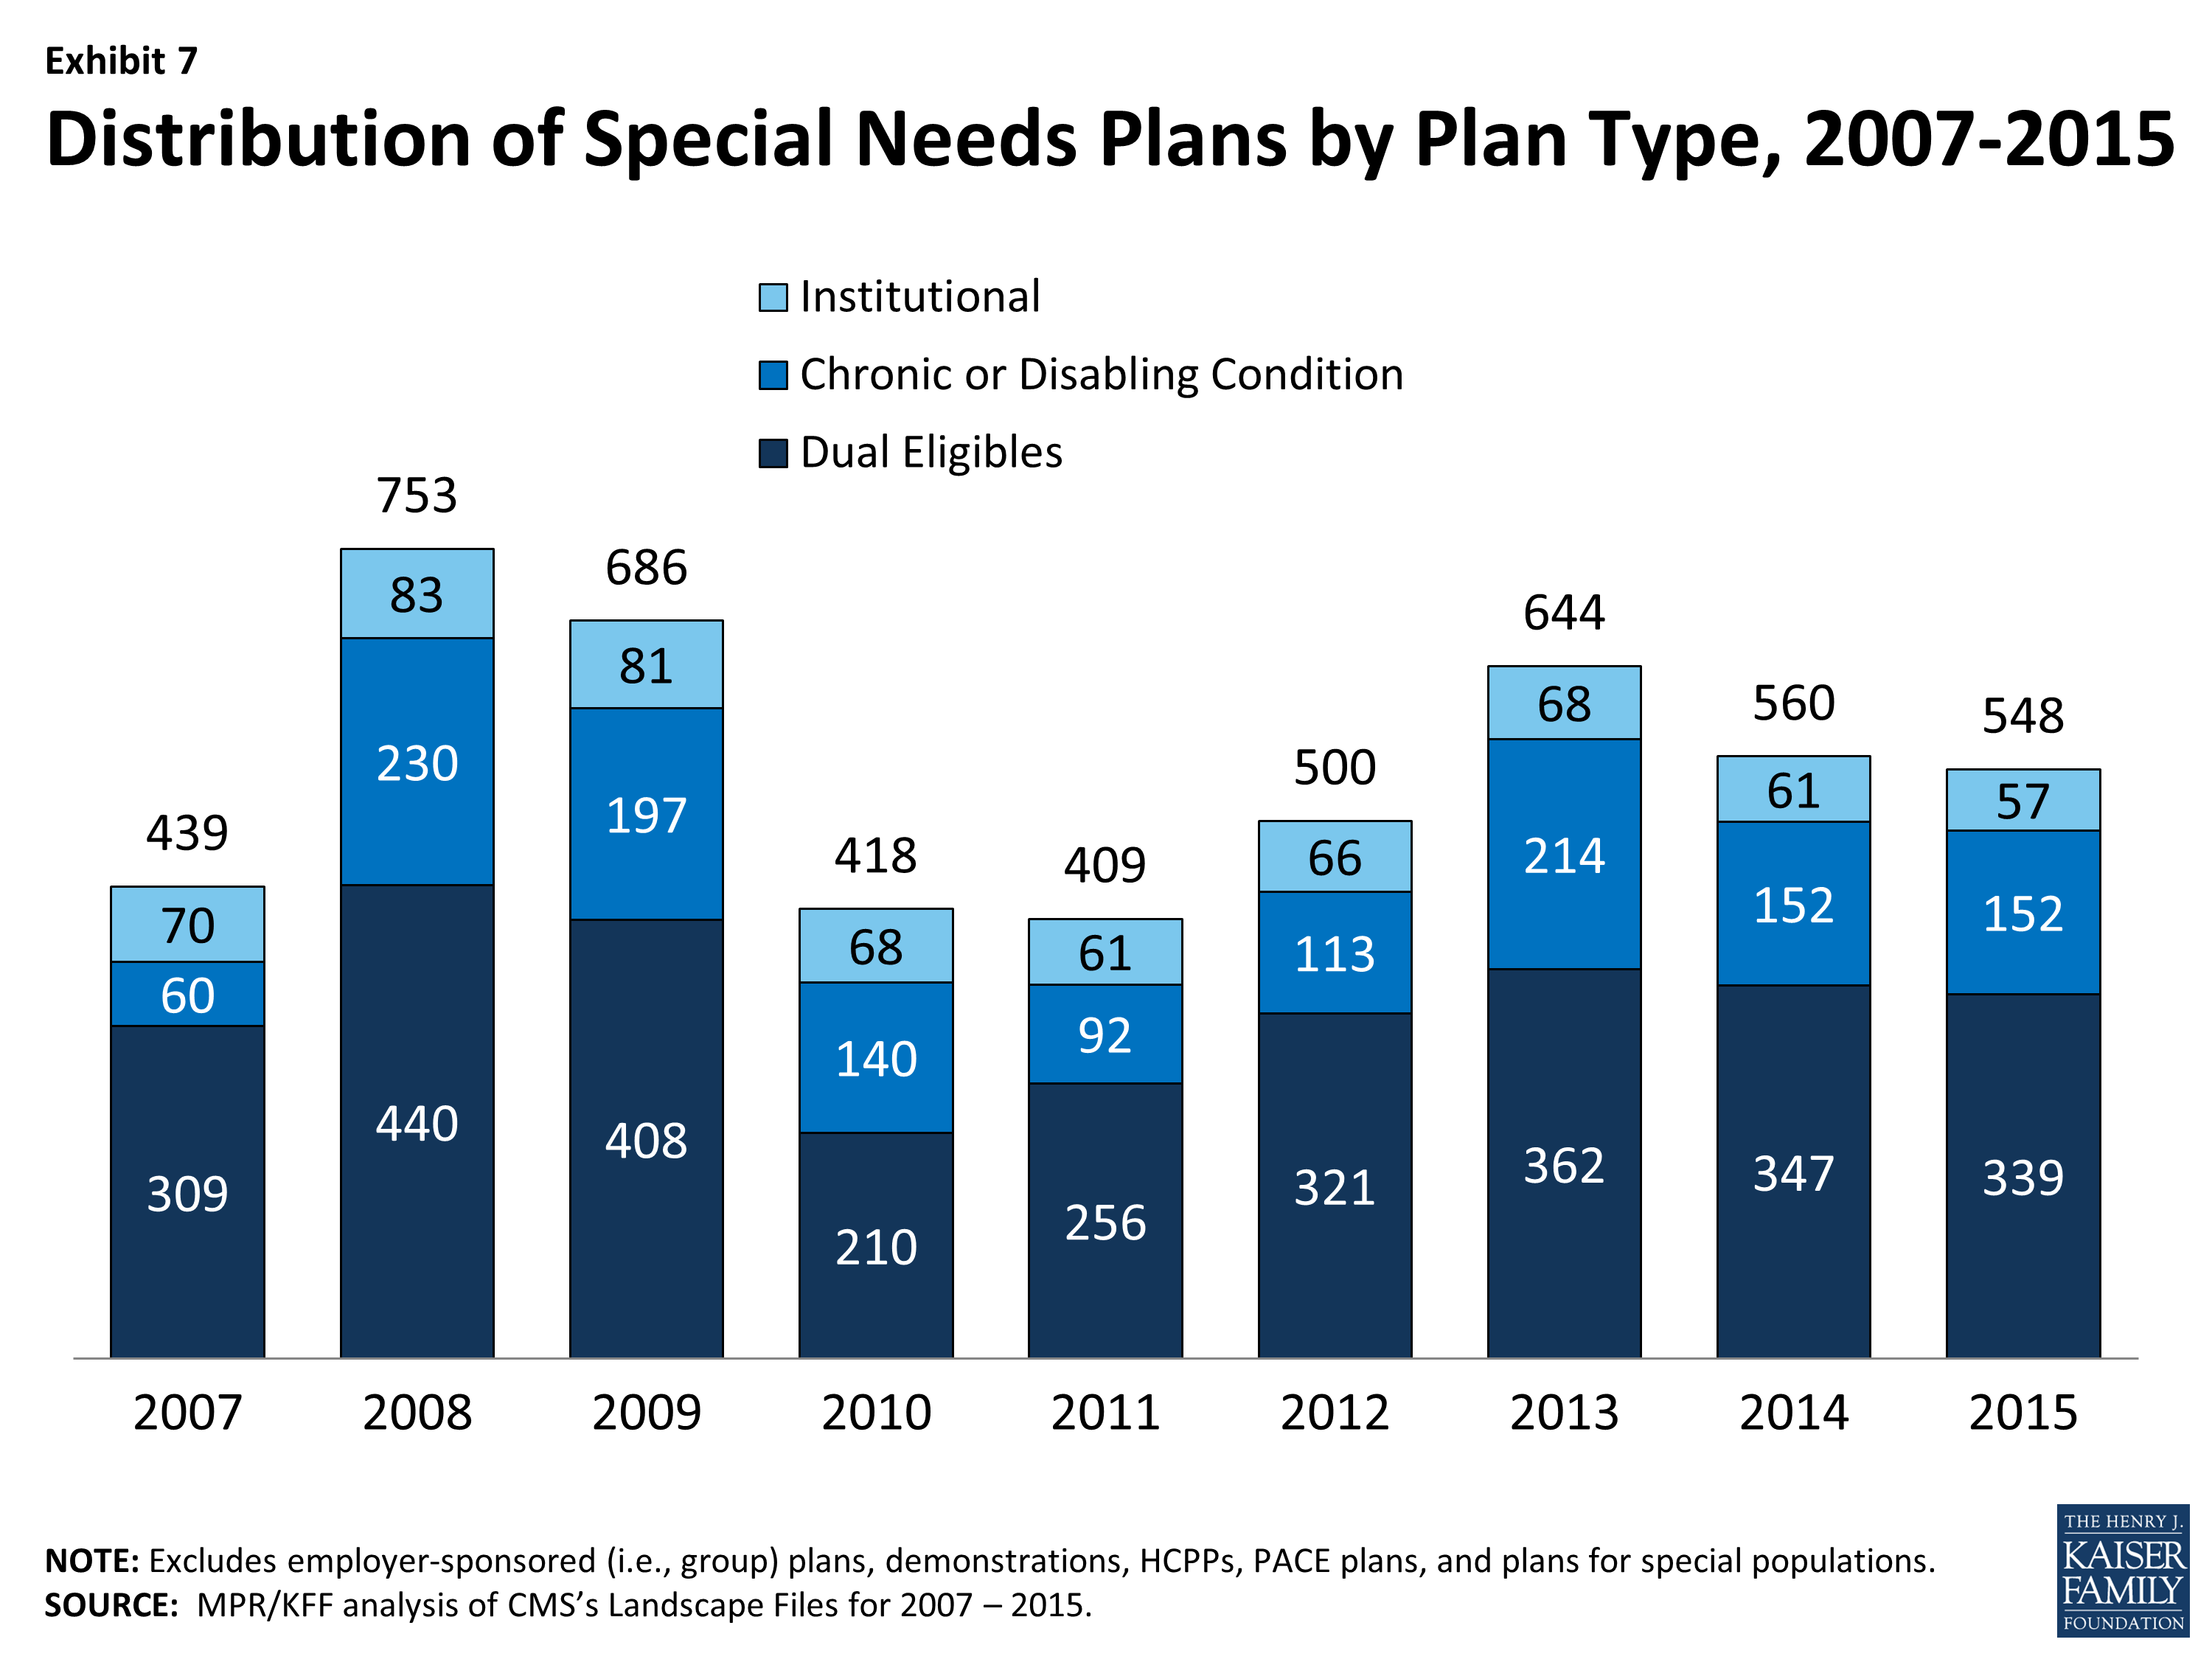 Exhibit 7: Distribution of Special Needs Plans by Plan Type, 2007-2015 –
The total number of D-SNPs will slightly decrease from 347 plans to 339 plans between 2014 and 2015, with some variation across states. The number of D-SNPs almost doubled in Arizona, from 12 plans in 2014 to 22 plans in 2015, while the number of D-SNPs in Florida declined from 71 plans in 2014 to 49 plans in 2015. Other states will experience smaller changes in the availability of D-SNPs. Notably, states with ongoing financial alignment demonstrations to improve the coordination of Medicare and Medicaid for dual eligibles will not see large changes, if any, in the number of available D-SNPs between 2014 and 2015. The total number of C-SNPs will remain the same in 2015 as in 2014 (152 plans), and the total number of I-SNPs will slightly decrease from 61 plans in 2014 to 57 plans in 2015. With the exception of Florida, no states will experience large changes in the availability of C-SNPs and I-SNPs.
|
Plan Availability and Premiums by Firm
While many organizations offer Medicare Advantage plans, a handful of firms and affiliates account for the majority of all Medicare Advantage enrollment in 2014.11 We examine trends among and across these firms and affiliates that account for large shares of Medicare Advantage enrollment nationally: UnitedHealthcare, Humana, Blue Cross and Blue Shield (BCBS) affiliated companies (including Wellpoint BCBS plans), Kaiser Permanente, Aetna, Wellcare, and Cigna. The analysis accounts for the merger between Coventry and Aetna in late 2013 as well as other previous mergers.
Change in Number and Availability of Plans Offered By Firm
Nationally, these firms and affiliates dominate the plan offerings, and 60 percent of available plans will be offered by one of these firms or affiliates in 2015 (Table A4). The types of plans offered vary across these firms and affiliates, due to different business strategies and different markets in which they offer plans. Plan strategies are reflected both in the types of plans they offer and, taking service area into account, the share of beneficiaries to whom they are available (Exhibit 8, Table A5).
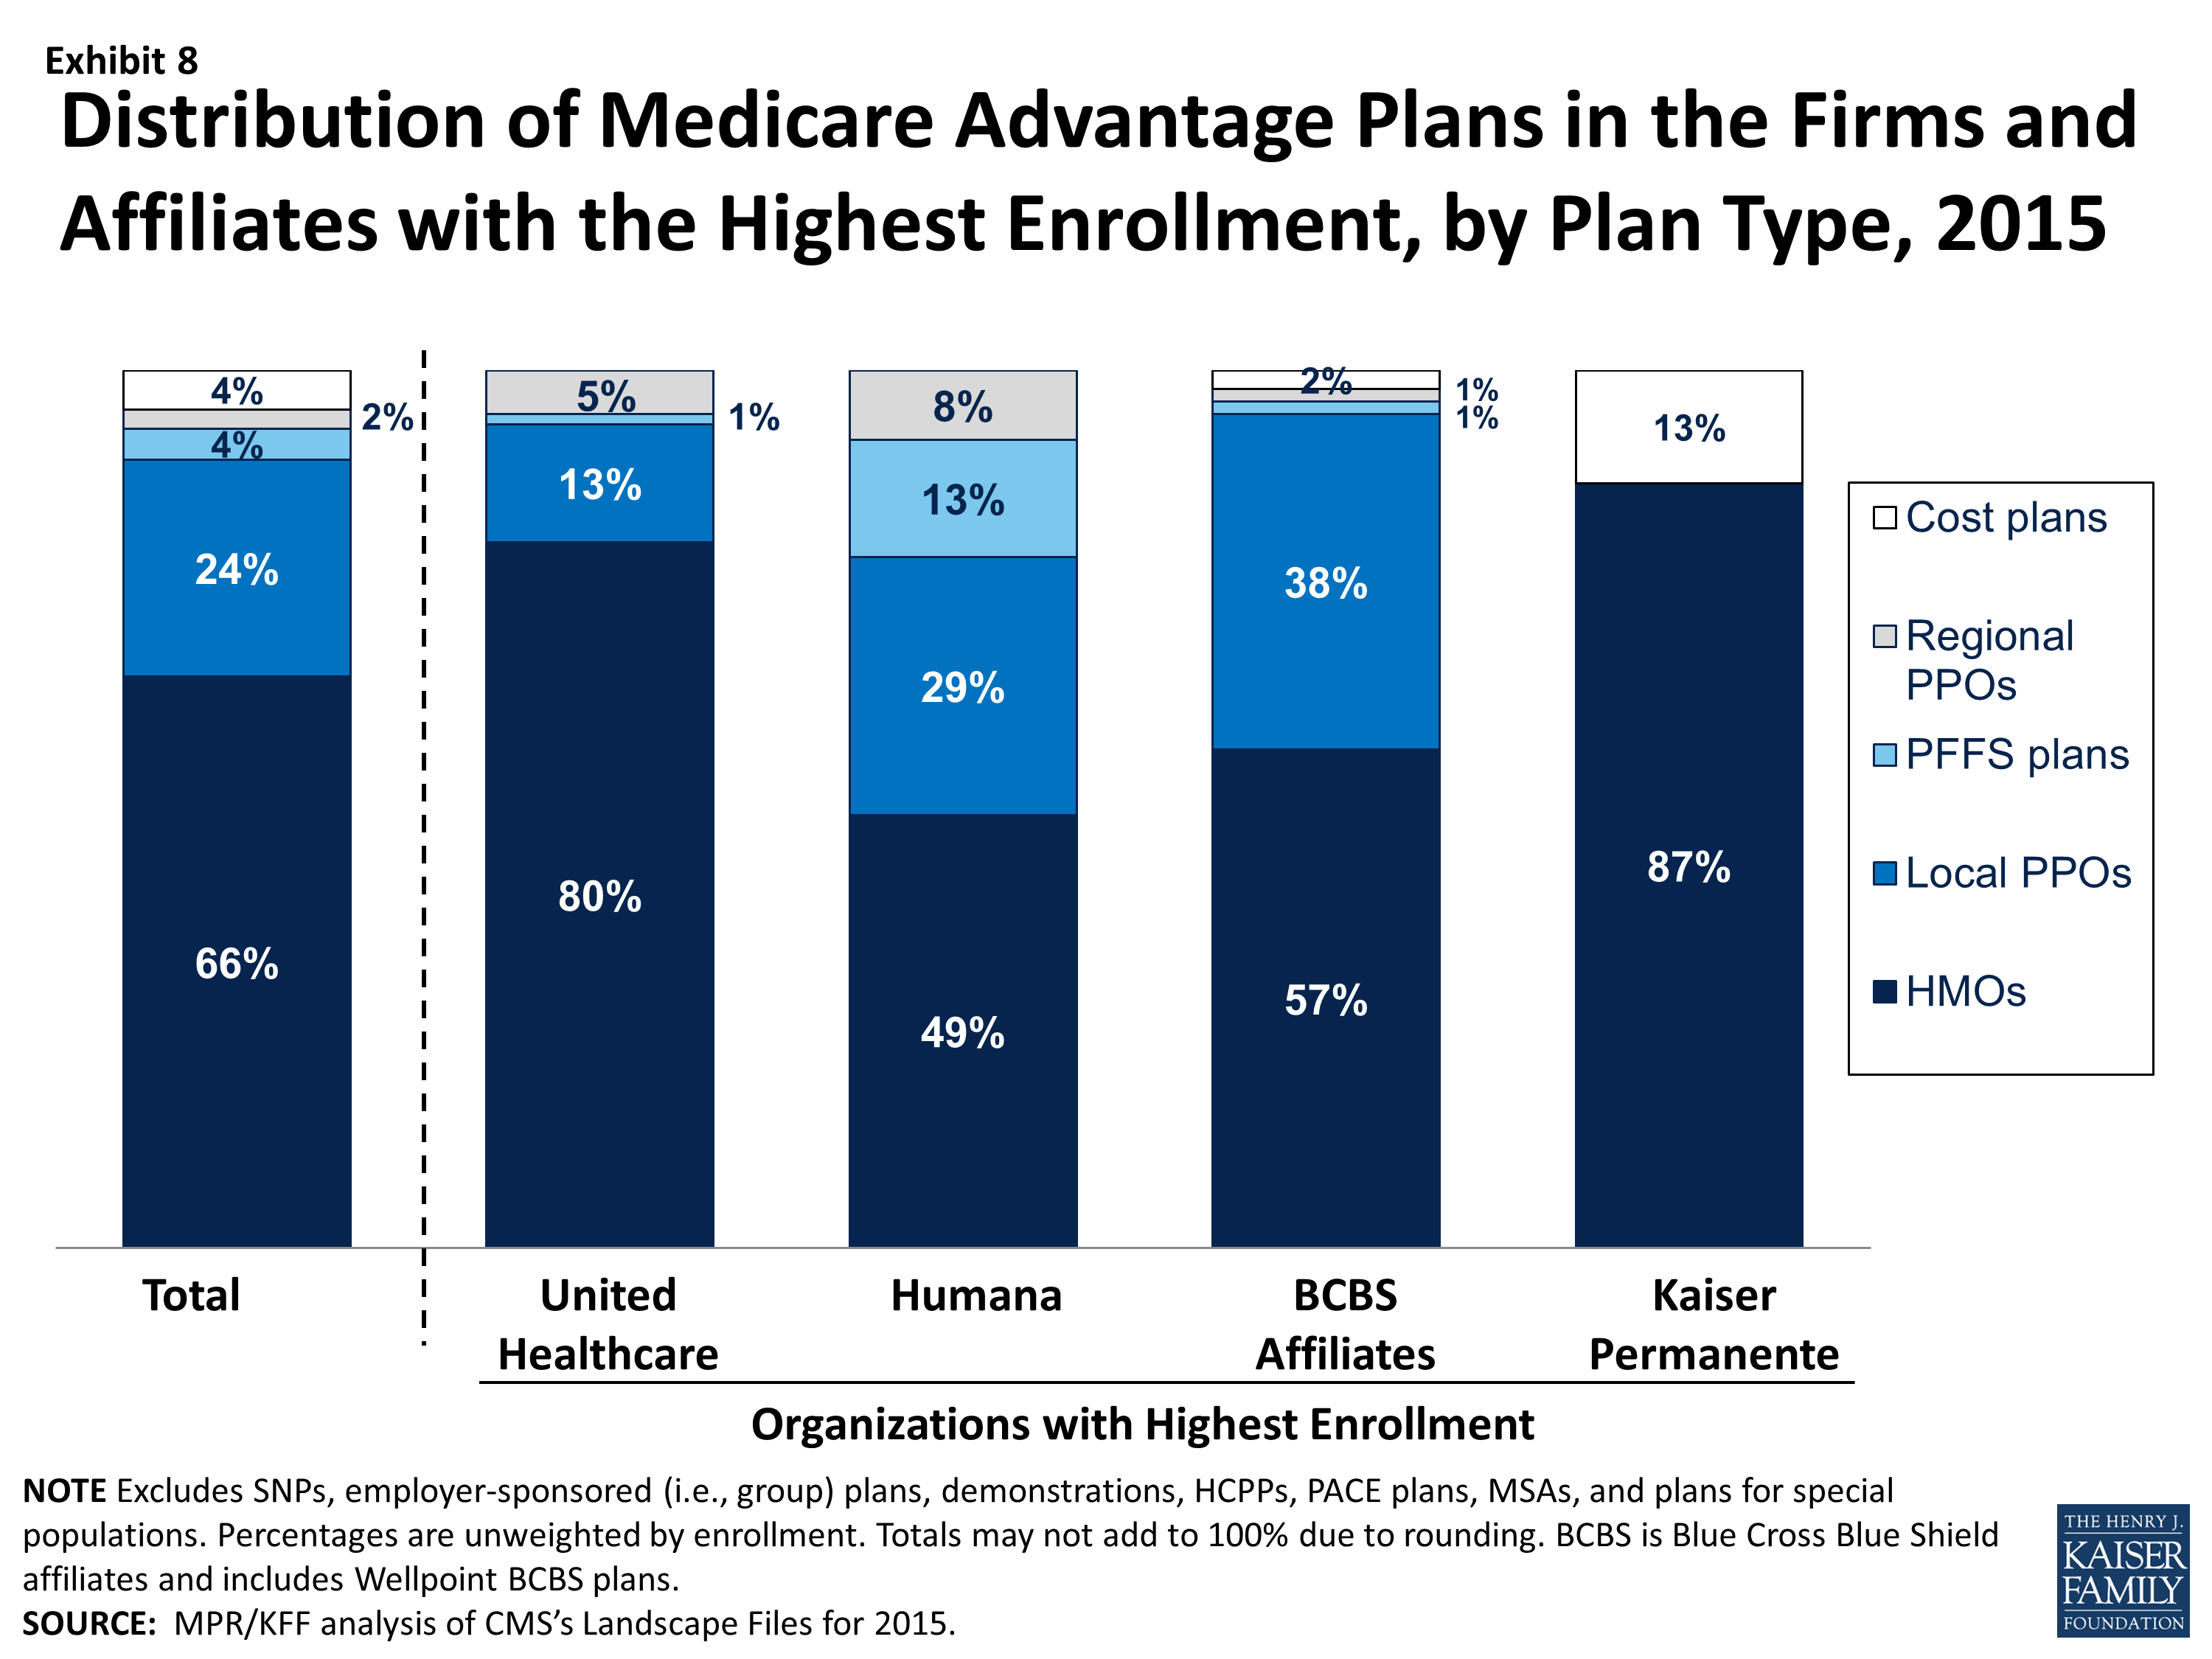
Exhibit 8: Distribution of Medicare Advantage Plans in the Firms and Affiliates with the Highest Enrollment, by Plan Type, 2015
Humana. As in recent prior years, in 2015, Humana will be offering plans to a larger share of Medicare beneficiaries nationwide (86%), and will be offering a broader mix of plan types, than any other firm or affiliated companies. About half of all Humana Medicare Advantage plans in 2015 will be HMOs (49%) and about three in ten will be local PPOs (29%); PFFS plans comprise a much larger proportion (13%) of Humana’s plan offerings than other large firms’ offerings. In 2015, Humana HMOs, local PPOs, and regional PPOs will be available to more than half of beneficiaries (56%, 54%, and 61%, respectively) and Humana PFFS plans will be available to more than four in ten beneficiaries (44%). This means that, in many markets, Humana will be offering competing plans of different plan types.
UnitedHealthcare. UnitedHealthcare also has historically had a large Medicare Advantage footprint and it will continue to do so in 2015. More than two-thirds (69%) of Medicare beneficiaries will have access to a UnitedHealthcare plan in 2015. Like Humana, UnitedHealthcare’s offerings also reflect a diversified mix of plan types, but the firm relies more heavily on HMOs than other plan types. Eighty percent of UnitedHealthcare’s plans will be HMOs, with smaller share of other plan types offered, including local PPOs (13%), regional PPOs (5%), and PFFS plans (1%).
Blue Cross and Blue Shield Affiliates (BCBS). In contrast to Humana and UnitedHealthcare that are single companies (or groups of companies), BCBS affiliates originally were separate companies in individual states that are affiliated nationally. Today, such affiliated companies may cover multiple states and some have converted from non-profit to for-profit status, most notably Wellpoint with its acquisition of Anthem BCBS.12 We analyze the BCBS affiliates together because the affiliation results in some similarities in approach. In 2015, more than half of their Medicare Advantage offerings will be HMOs (57%) while 38 percent will be local PPOs. Nearly three out of four beneficiaries nationwide (71%) will have access to a BCBS affiliated plan, including 21 percent who will have with access to a Wellpoint BCBS plan and 58 percent who will have access to plans offered by other companies under the BCBS trademark. UnitedHealthcare, Humana, and BCBS affiliates are the only firms and affiliates that offer regional PPOs in 2015, as was also true in 2014.
Kaiser Permanente. Fewer beneficiaries (15%) will have access to a Kaiser Permanente plan than many other firms included in this analysis. Kaiser Permanente has historically been geographically concentrated but its plans tend to have many enrollees. In contrast to other firms that have diversified their Medicare Advantage offerings considerably since the mid-2000s, Kaiser Permanente only offers HMOs (87%) and cost plans, which are somewhat similarly structured. In 2015, Kaiser Permanente will offer fewer cost plans (5 plans in 2015 versus 14 plans in 2014), but the change will have relatively little impact on the total share of beneficiaries with access to a Kaiser Permanente plan.
Aetna. With its acquisition of Coventry, Aetna’s footprint in the Medicare Advantage market has expanded. Aetna historically was strong in the group market and the Coventry acquisition has strengthened its presence in the individual market.13 In 2015, Aetna plans will be available to 45 percent of all beneficiaries, up from 33 percent in 2014 prior to the acquisition. In 2015, Aetna HMOs and local PPOs will be available to 42 percent and 33 percent of beneficiaries, respectively; both Coventry and Aetna have offered only HMOs or local PPOs since the start of 2011.
Other Firms. About one-quarter (25%) and one-fifth (19%) of beneficiaries will have access to a plan offered by Wellcare and Cigna, respectively. Both firms heavily emphasize HMOs, with Wellcare exclusively offering HMOs and Cigna offering predominantly HMOs. Many other firms participate in the Medicare Advantage. Such companies are particularly relevant to HMO offerings, where they provide one or more options to 79 percent of beneficiaries.
Change in Plan Premiums By Firm
The firms and affiliates with the most Medicare Advantage enrollees have historically differed in how aggressively they have priced their products, over time and across markets. For instance, some may offer wider provider networks in exchange for higher premiums. Others provide more limited benefit expansion (beyond traditional Medicare benefits) in exchange for lower premium plans. As with our other analyses of premiums, this analysis of premiums by firm includes only MA-PDs, and excludes the Medicare Advantage plans that do not cover prescription drugs, in order to better approximate apples-to-apples comparisons.
As part of its strategy for retaining enrollment while reducing costs, UnitedHealthcare announced that for 2015 it introduced premiums across most of its plans that previously had zero-premiums. As premiums in these plans increased, UnitedHealthcare also is introducing new zero-premium plans with less generous benefits and/or higher cost-sharing.14 UnitedHealthcare has also stated that it will introduce more plans with narrow provider networks consisting of one hospital or health system. Overall, average premiums increased across all plan types offered by UnitedHealthCare, increasing from an average of $11 in 2014 to $27 in 2015 (Table A6).
Other companies will also have sizeable premium increases for some plan offerings. Average premiums for local PPOs offered by BCBS affiliates increased from $89 per month to $109 per month between 2014 and 2015; these premium increases occurred for BCBS plans offered by Wellpoint as well as other BCBS affiliates.
Limits on Out-of-Pocket Spending
The traditional Medicare program does not include a limit on out-of-pocket spending for services covered under Parts A and B, which is one reason most beneficiaries have supplemental coverage to limit their financial liability. Historically, Medicare HMOs provided beneficiaries with an alternative way to obtain comprehensive coverage and early (circa 1980s) plans had relatively limited cost sharing. With the growth of cost sharing in Medicare Advantage and its predecessor programs, out-of-pocket limits became increasingly important as a way for health plans to demonstrate their value to beneficiaries who might also be considering traditional Medicare, with or without supplemental coverage.
In 2006, when they were first authorized, regional PPOs were required by law to have a limit on out-of-pocket spending for benefits under Parts A and B. In 2010, more than three-quarters of plans (79%) of any type provided out-of-pocket spending limits as an extra benefit for enrollees.15 Beginning in 2011, CMS required all Medicare Advantage plans to include a limit on enrollees’ out-of-pocket expenses for services covered under Parts A and B (no more than $6,700 each year,), with higher limits allowed for services received out-of-network. CMS encouraged plans to limit enrollees’ out-of-pocket expenses to no more than $3,400 per year by allowing plans with lower out-of-pocket limits to charge higher cost-sharing for some services. These out-of-pocket limits do not include expenses for prescription drugs covered under Part D, which have a separate catastrophic cap ($4,700 in 2015), nor do they include expenses for services not covered by the plan, such as dental care or over-the-counter medications.
In 2015, out-of-pocket limits for MA-PDs will be higher, on average, than in 2014, increasing by 5 percent, on average, from $4,797 in 2014 to $5,037 in 2015, continuing the trend in rising out-of-pocket limits observed over the past few years (Exhibit 9). The share of MA-PDs that limit out-of-pocket expenses to $3,400 or less has decreased from 51 percent in 2011 to 9 percent in 2015. In contrast, almost half (48%) of plans will have limits above $5,000 in 2015, up from 24 percent in 2011.
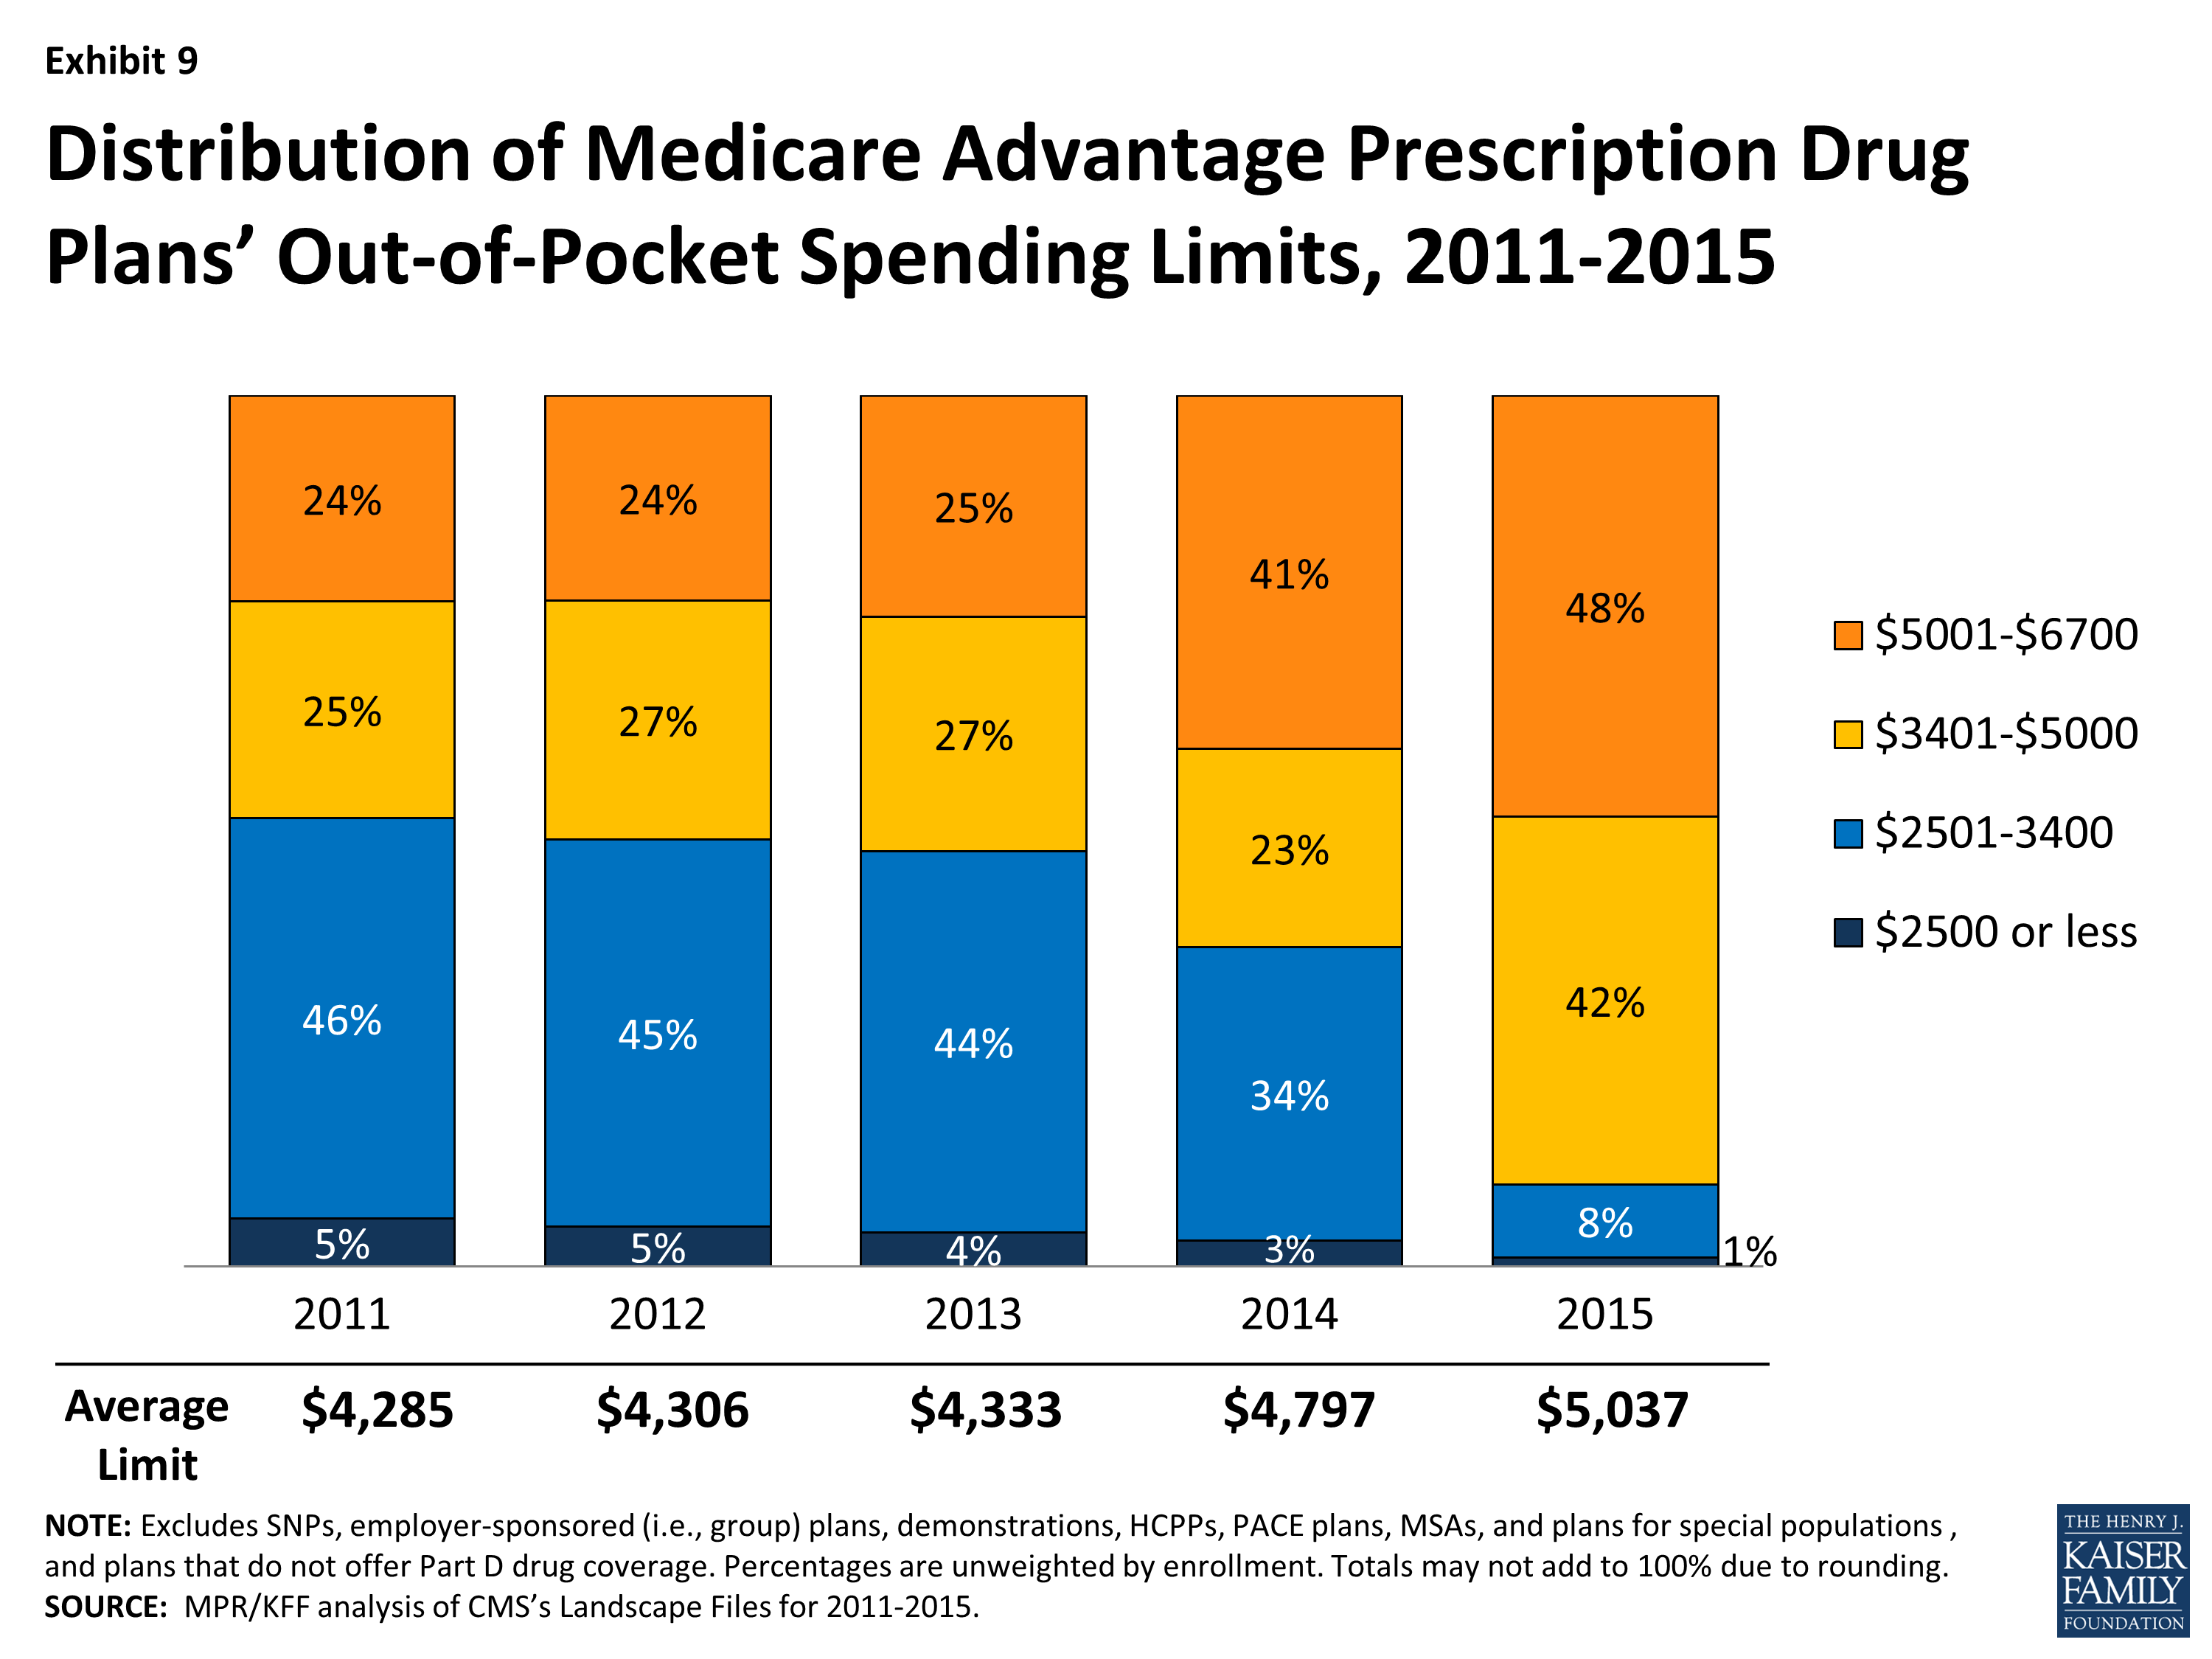
Exhibit 9: Distribution of Medicare Advantage Prescription Drug Plans’ Out-of-Pocket Spending Limits, 2011-2015
Average out-of-pocket limits vary by plan type, but across all plan types, out-of-pocket limits have increased over the past few years (Exhibit 10). Out-of-pocket spending limits exceed $5,000 for virtually all regional PPOs (96%), 61 percent of local PPOs, and a smaller share of HMOs (44%). However, most HMOs (92%) will have limits above $3,400 in 2015, up from 60 percent in 2014. Similarly, 90 percent of local PPOs and 100 percent of regional PPOs will have limits above $3,400 in 2015 (up from 69% and 90%, respectively, in 2014).
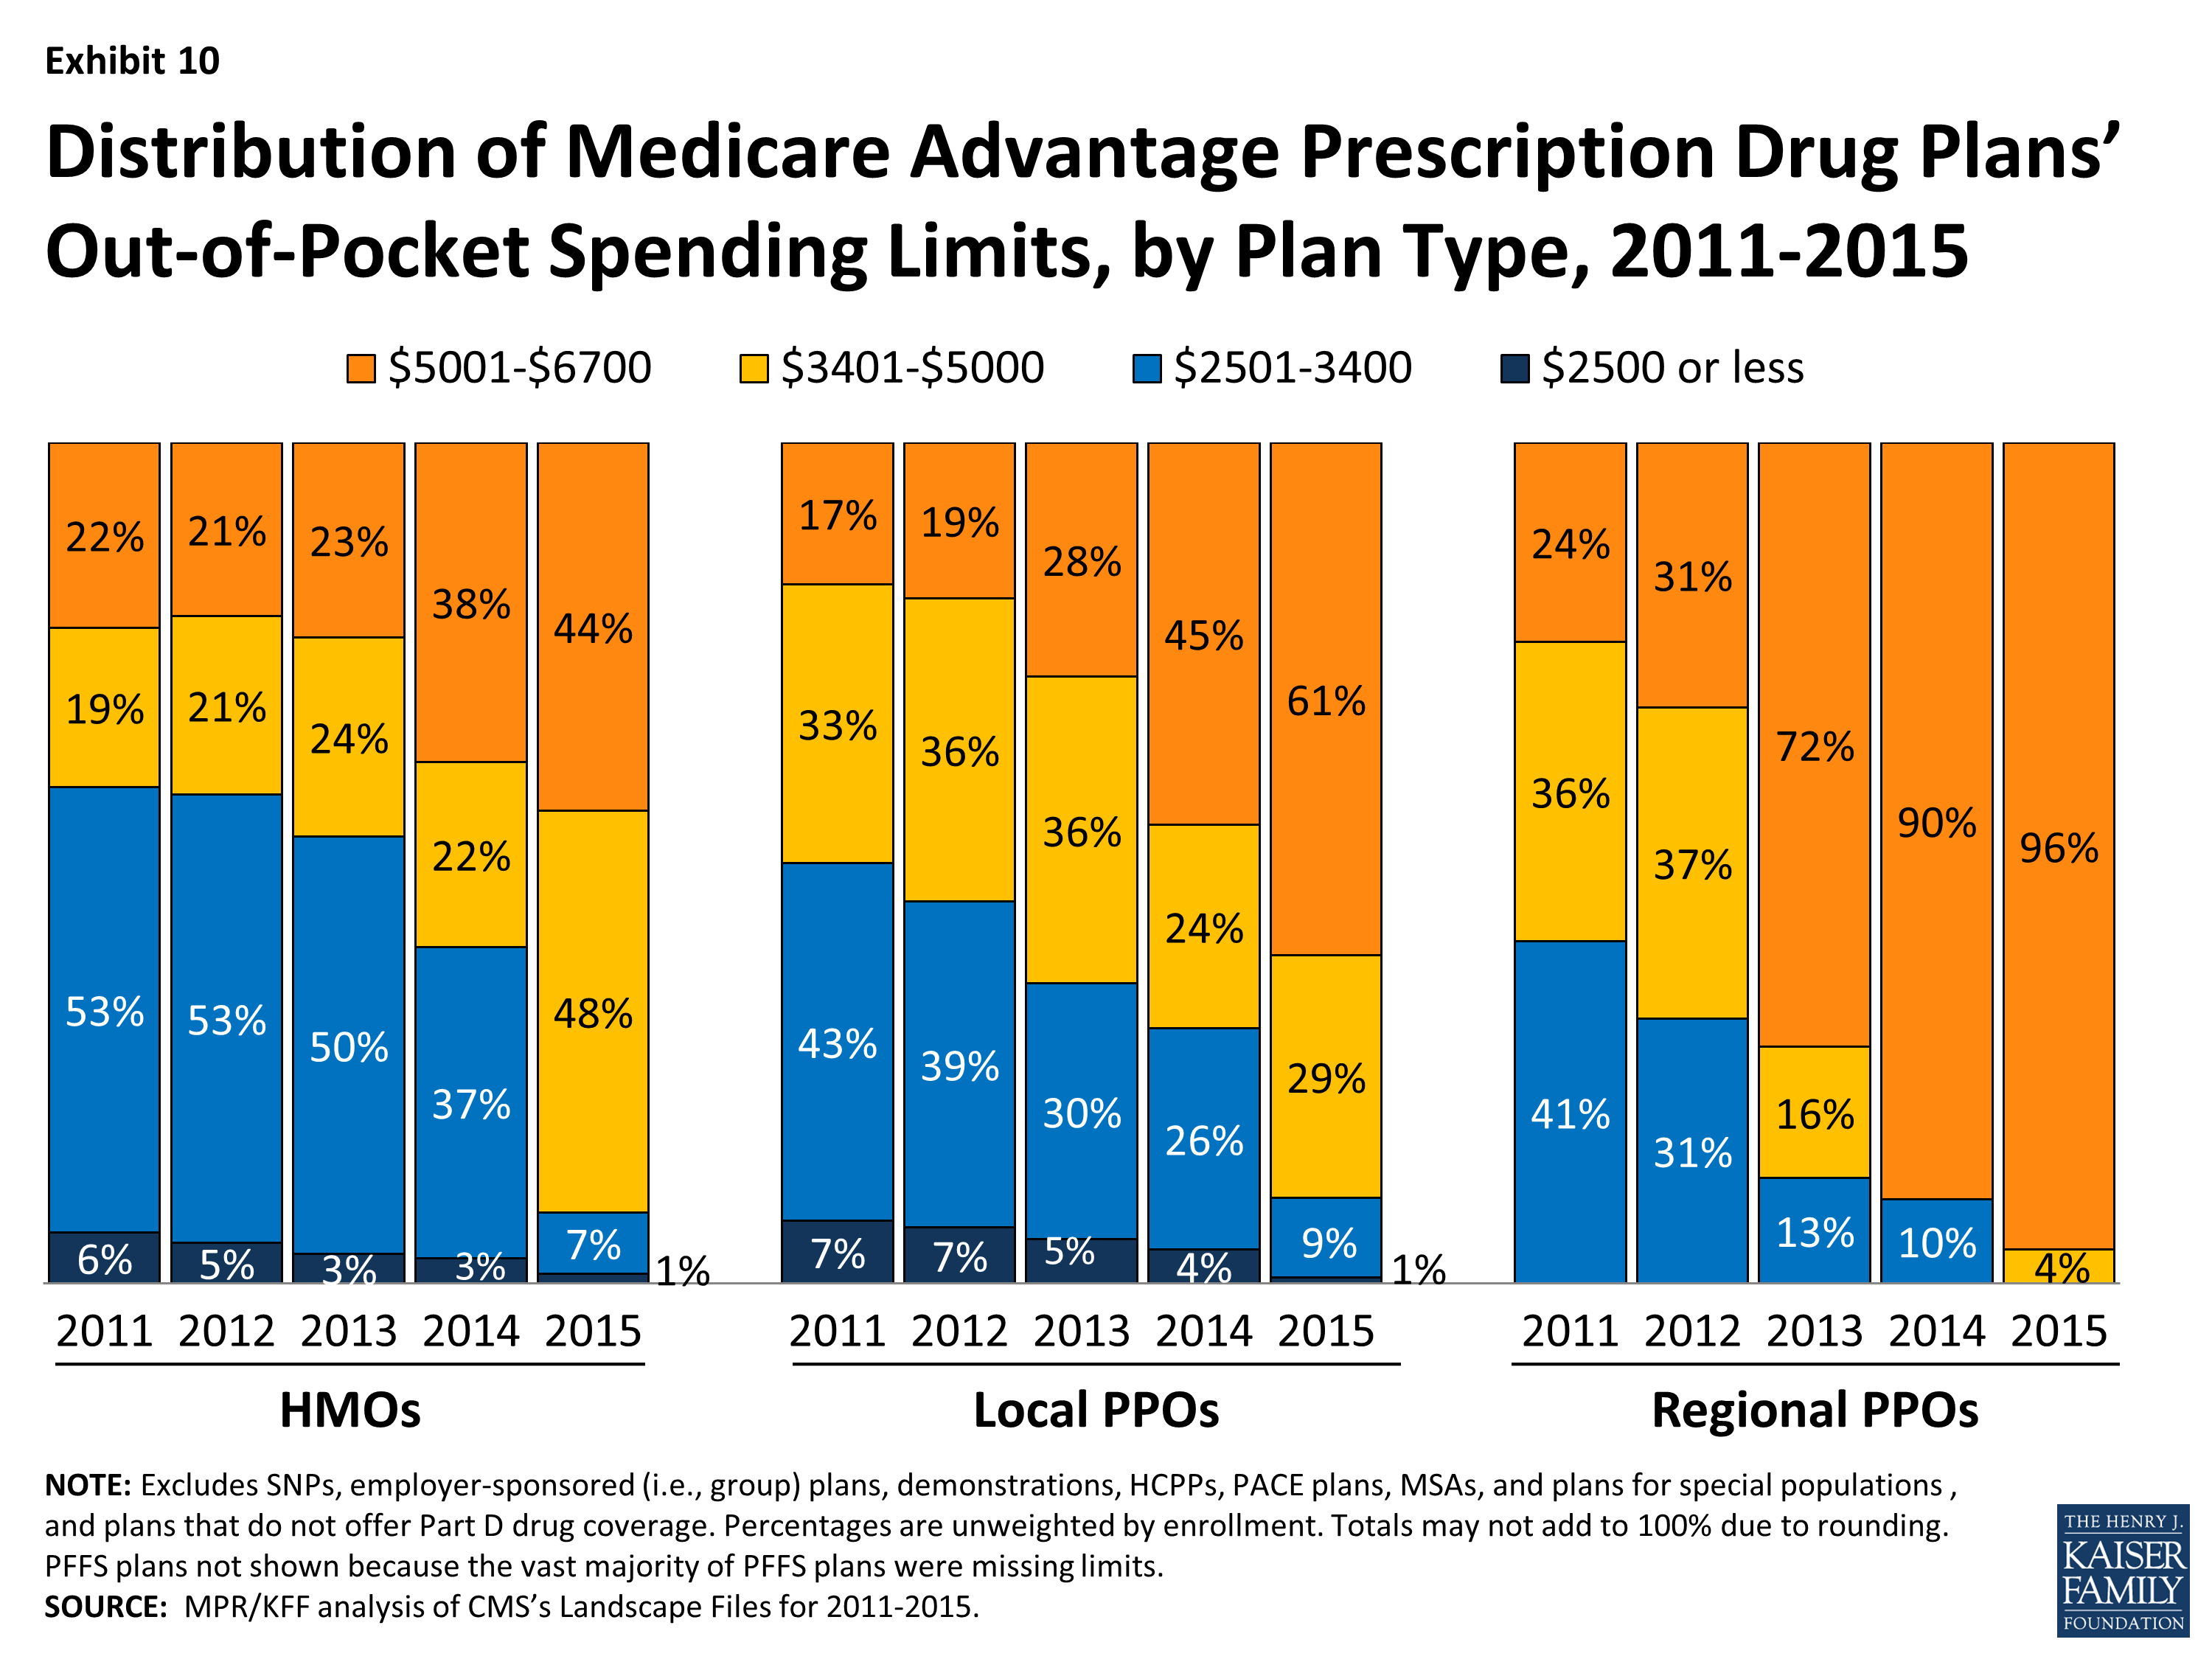
Exhibit 10: Distribution of Medicare Advantage Prescription Drug Plans’ Out-of-Pocket Spending Limits, by Plan Type, 2011-2015
If MA-PD enrollees stay in the same plan in 2014, out-of-pocket limits will increase an average of $170 (from $4,898 in 2014 to $5,068 in 2015). Enrollees in local PPOs will see the largest increase in out-of-pocket limits if they don’t switch plans ($323, on average), followed by regional PPO enrollees ($261, on average) with smaller average increases in out-of-pocket limits for HMO enrollees ($162, on average; Table A1). While the average out-of-pocket limit among Medicare Advantage plans has increased, it still is somewhat lower in 2015 than the limit that has been proposed for traditional Medicare under many Medicare reform proposals ($5,500).16 However, increases in out-of-pocket limits over time mean that beneficiaries enrolled in Medicare Advantage plans have less protection against high out-of-pocket costs than beneficiaries with Medigap plans.17
Prescription Drug Coverage
Traditional Medicare did not offer an outpatient prescription drug benefit prior to 2006, and Medicare Advantage plans were an important source of prescription drug coverage for Medicare beneficiaries. While many plans offered some coverage for prescription drugs prior to 2006, beginning in 2006, all beneficiaries had access to a prescription drug plan, either through free-standing prescription drug plans (PDPs) or a Medicare Advantage plan that included drug coverage (MA-PD).
The initial design of the Medicare drug benefit included a coverage gap, or “doughnut hole,” which required beneficiaries with relatively high drug costs to pay 100 percent of their expenses in the coverage gap until they qualified for catastrophic protection. The ACA gradually closes the doughnut hole and eliminates the gap by 2020. In 2015, beneficiaries will be responsible for no more than 45 percent of the cost of brand-name drugs and 75 percent of the cost of generic drugs in the gap.
In 2015, eighty-six percent of Medicare Advantage plans will offer prescription drug coverage, up from 83 percent in 2014 and 75 percent in 2007 (Exhibit 11). Historically, Medicare Advantage plans without a drug benefit were developed to meet the needs of beneficiaries who may have access to other sources of prescription drug coverage, as well as those who for any other reason do not want to purchase such coverage.
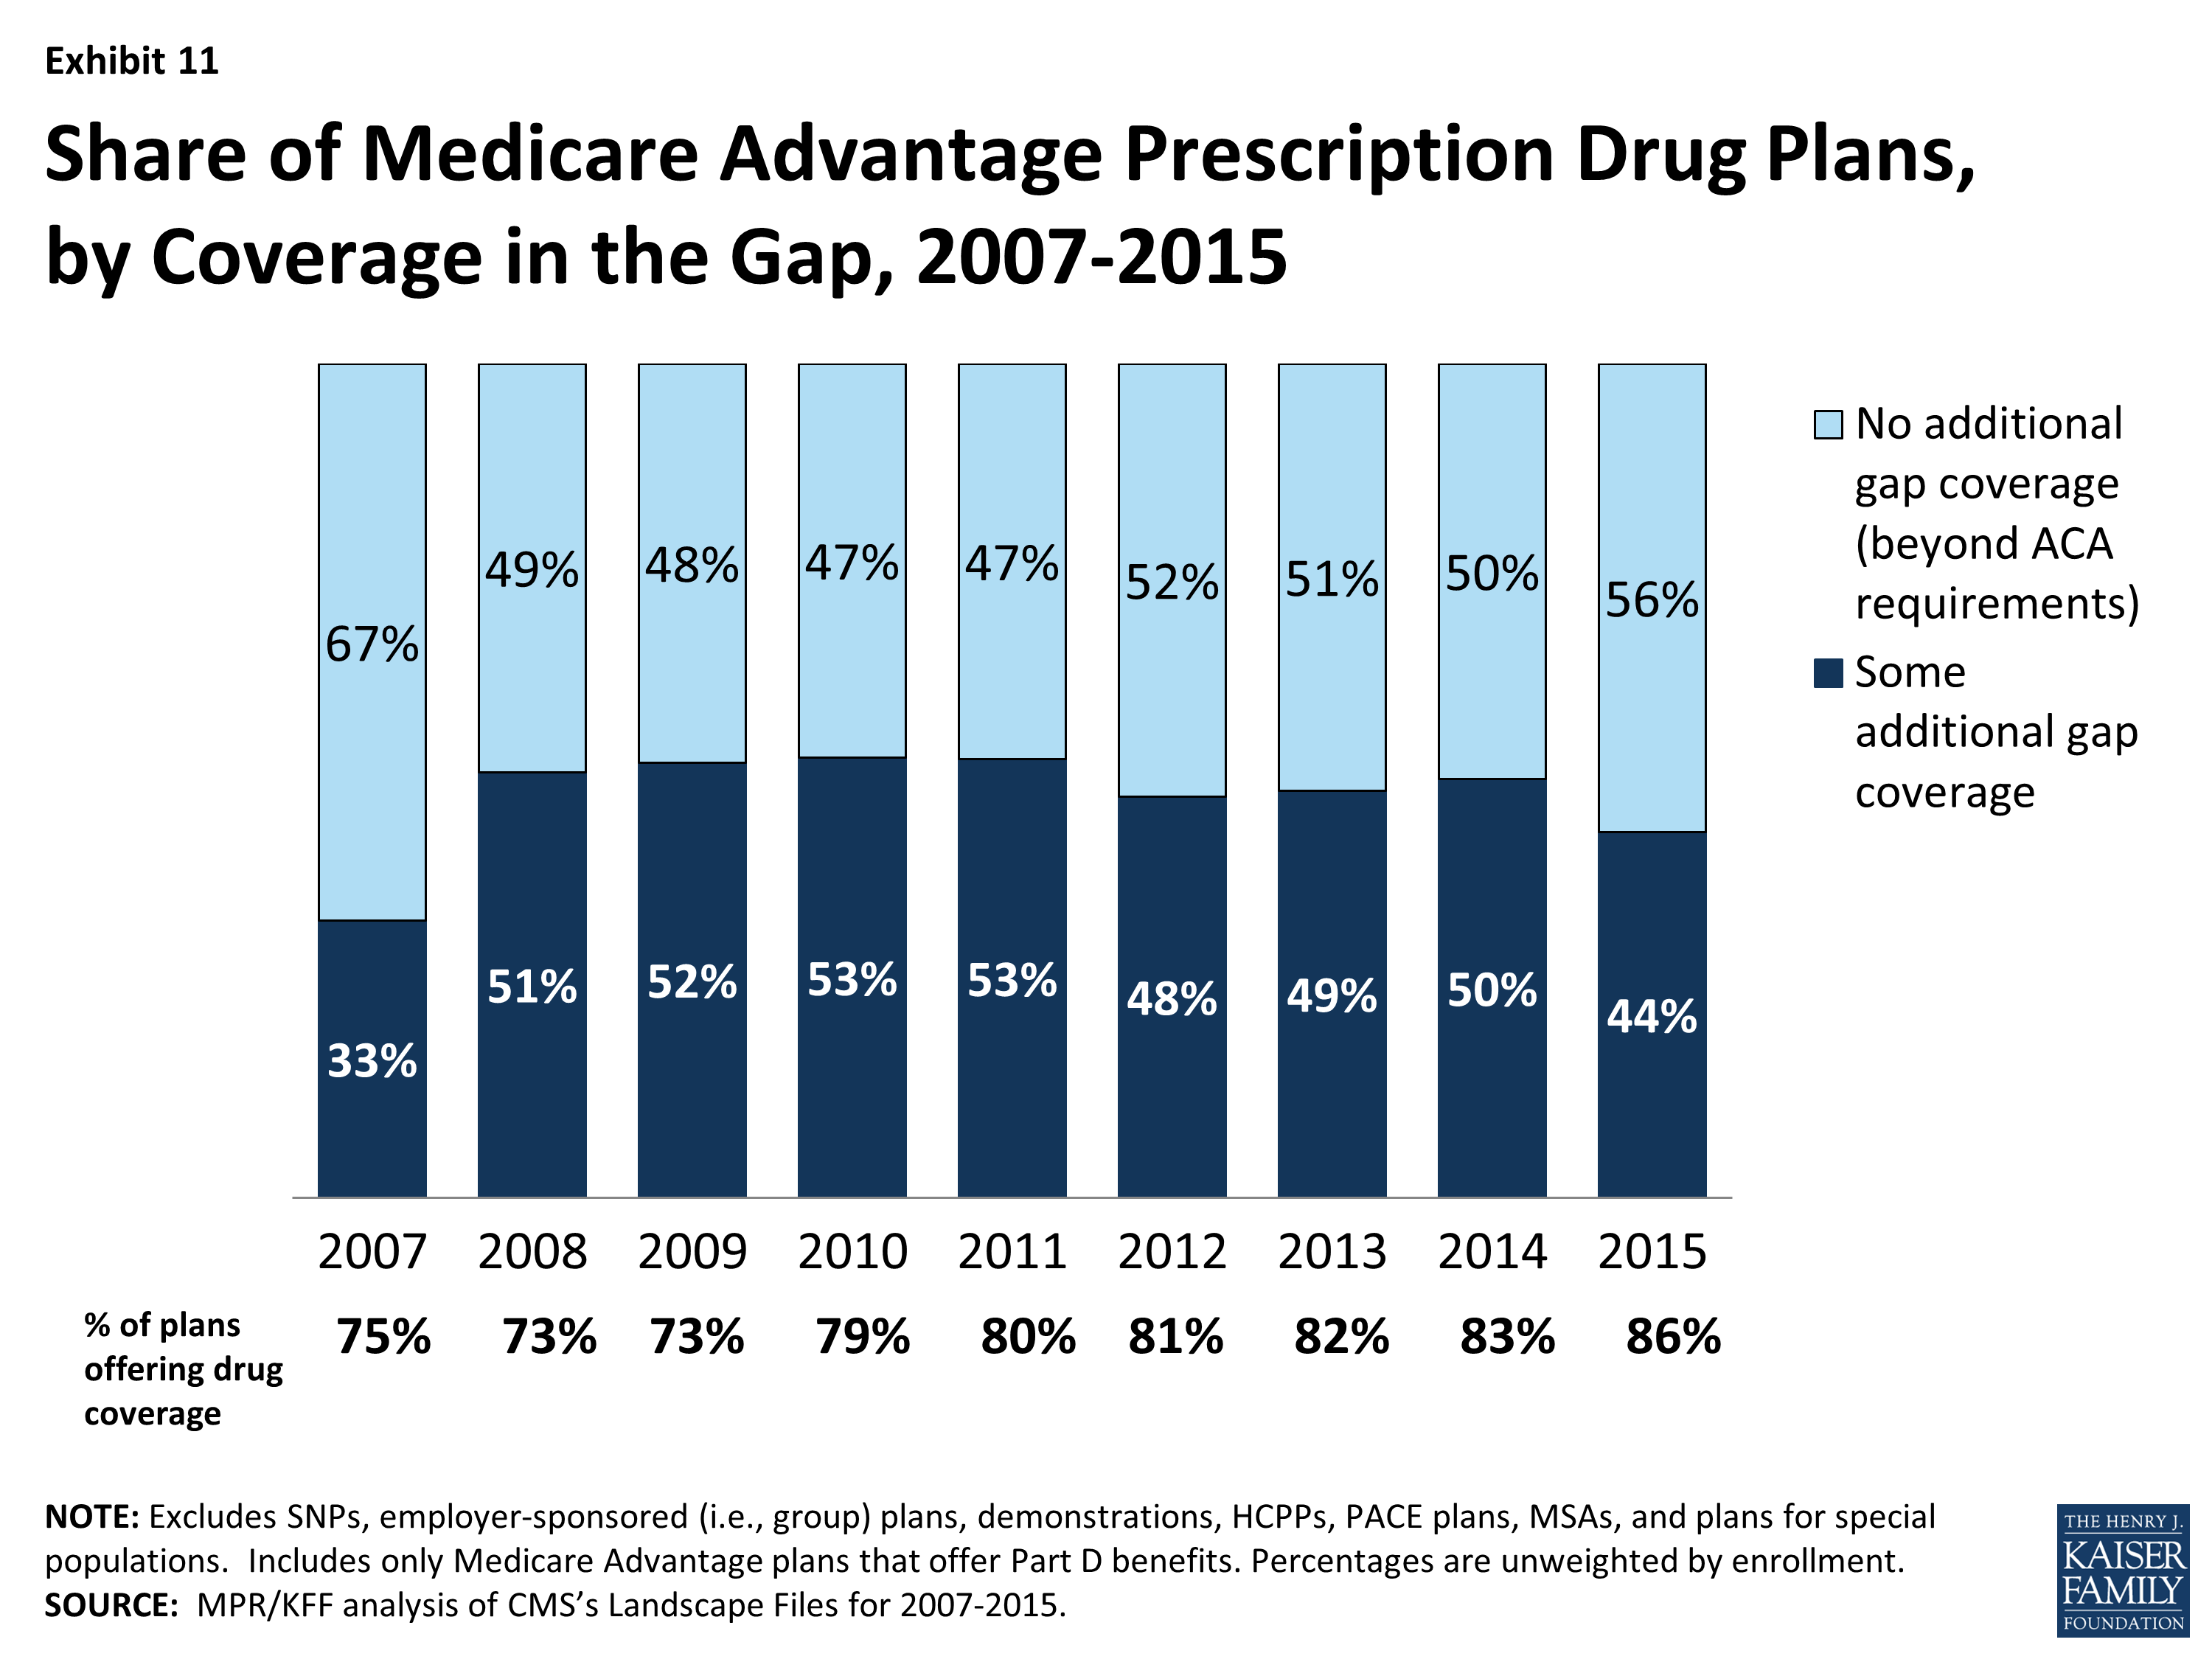
Exhibit 11: Share of Medicare Advantage Prescription Drug Plans, by Coverage in the Gap, 2007-2015
The standard design of the drug benefit also includes an initial coverage deductible of $320 in 2015. Plans can vary the benefit design as long as they provide cost-sharing that is at least actuarially equivalent to the standard benefit, and MA-PDs have historically had lower cost-sharing that may have helped to attract enrollees. In 2015, fewer plans in Medicare Advantage are designed to eliminate the deductible entirely (63% in 2015 versus 82% in 2014; Exhibit 12). This mirrors the trend in PDPs, although no deductible plans are still more common in Medicare Advantage plans than PDPs; 47 percent of PDPs have no deductible.18 In 2015, the average deductible for MA-PDs will be $89.72, up from $38.24 in 2014. Almost one-quarter (24%) of MA-PDs will have deductibles greater than $200 in 2015, an increase from 9 percent of MA-PDs in 2014. This increase in prescription drug deductibles could indicate that MA-PDs may be increasing cost-sharing for prescription drugs, since the deductible is the most visible part of cost-sharing; however, cost-sharing for plans needs to be analyzed in its totality, including cost-sharing for drugs as well as medical services, in order to draw conclusions.
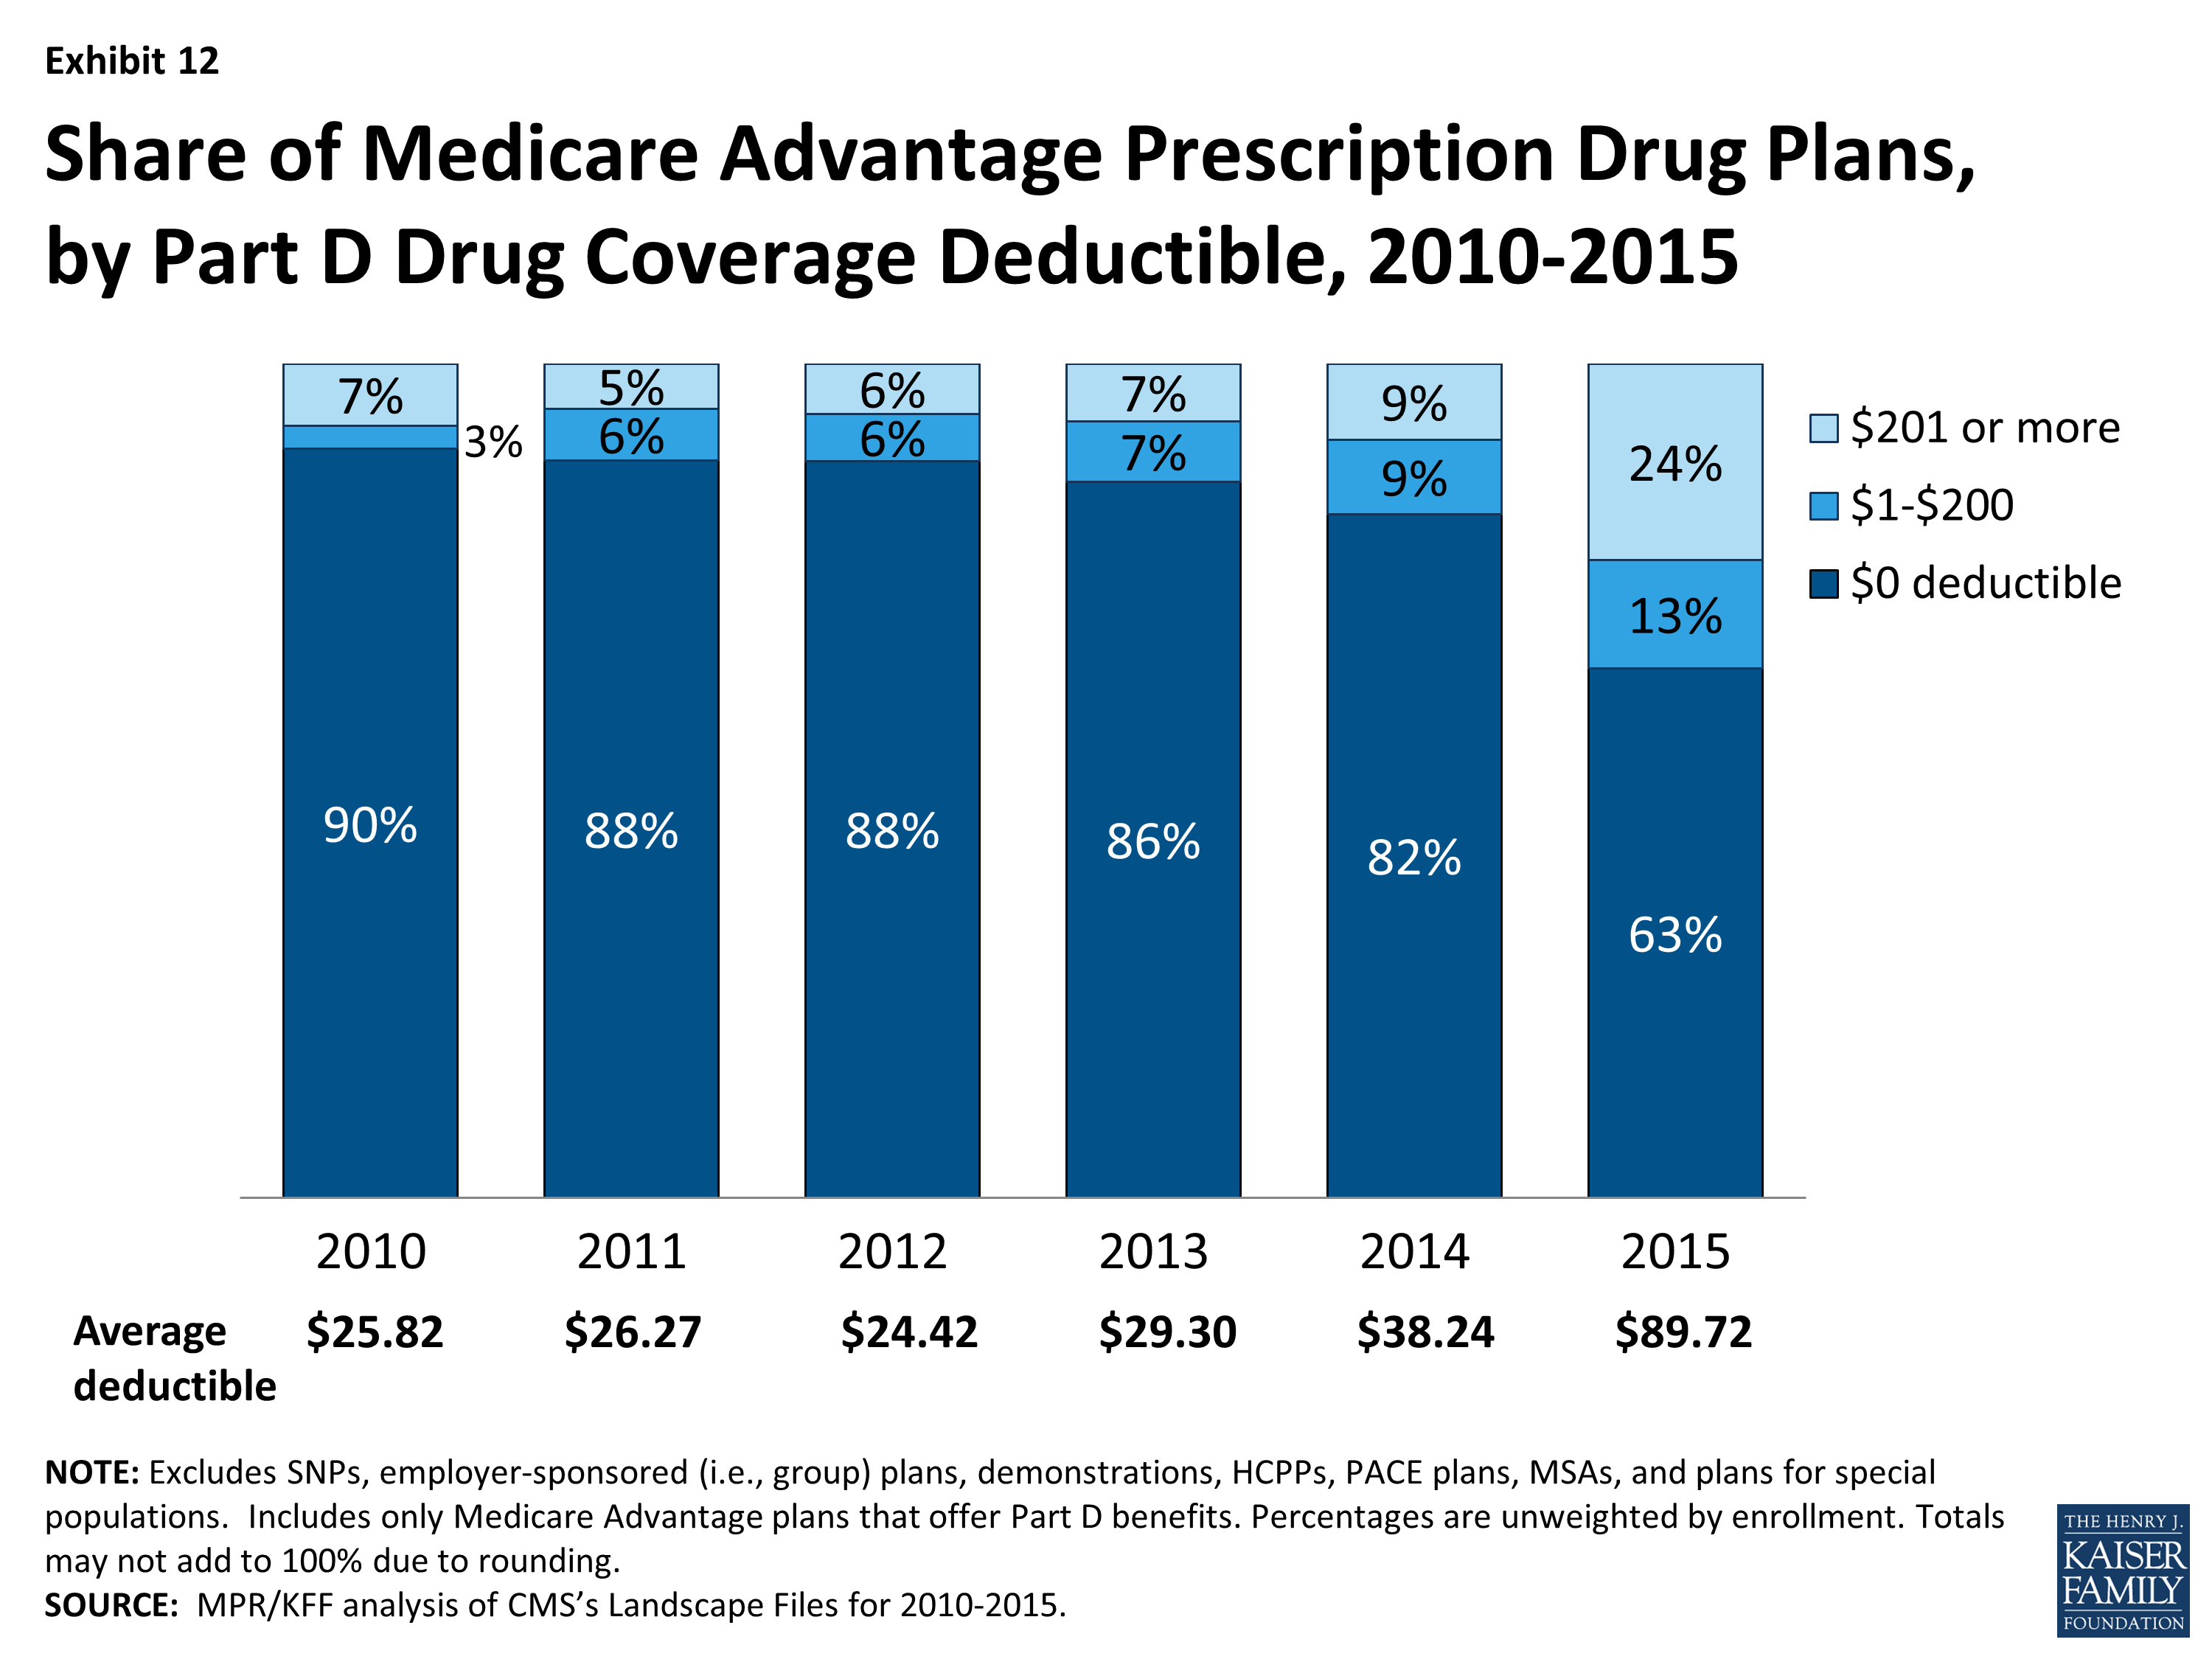
Exhibit 12: Share of Medicare Advantage Prescription Drug Plans, by Part D Drug Coverage Deductible, 2010-2015
Less than half (44%) of MA-PDs will provide additional coverage in the Part D coverage gap in 2015, beyond that which is required by the ACA, down from 50 percent in 2014 (Exhibit 11). As in prior years, coverage in the Part D doughnut hole will vary by plan type, with a larger than average share of PFFS plans (62%), and a smaller than average share of HMOs (46%), local PPOs (39%), and regional PPOs (12%), providing additional coverage in the gap, beyond that which is required by the ACA (data not shown).
Quality Ratings
For many years, the CMS has posted quality ratings of Medicare Advantage plans to provide Medicare beneficiaries with additional information about plans offered in their area. All Medicare Advantage plans are rated on a 1 to 5 star scale, with 1 star representing poor performance, 3 stars representing average performance, and 5 stars representing excellent performance. The quality scores for Medicare Advantage plans are derived from plan and beneficiary information collected in three surveys – HEDIS®, CAHPS®, and HOS – and administrative data. For example, the performance measures include whether the plans’ enrollees received the appropriate screening tests, the number of complaints CMS received about the plan, and how enrollees rated the communication skills of the plans’ physicians. CMS assigns quality ratings at the contract level, rather than for each individual plan. This means that every Medicare Advantage plan covered under the same contract receives the same quality rating (and most contracts cover multiple plans).
In 2012, Medicare Advantage plans began receiving bonus payments based on quality ratings. These payments were initially established in the ACA and provided for bonus payments to plans that receive 4 or more stars and to unrated plans beginning in 2012. In addition to the bonus payments established by the ACA, CMS launched a demonstration for 2012 through 2014 that increased the size of bonuses for these plans, and also provided bonuses to plans rated as average (receiving 3 or 3.5 stars), using the same 1 to 5 star scale. In 2015, the bonus payments will revert back to those that were authorized under the ACA, and plans with 3 or 3.5 stars will not receive bonus payments. Beneficiaries can enroll in a plan with 5 stars at any time during the year, not just during the annual open enrollment period.
In 2015, one-third (33%) of Medicare Advantage contracts will have ratings of four or more stars, though just 2 percent of contracts attained the highest star rating – five stars (Exhibit 13). All of these Medicare Advantage contracts will qualify for bonus payments in 2015. Almost four in ten contracts (39%) will have average ratings (3 or 3.5 stars), and 4 percent of contracts will have below average ratings (2 or 2.5 stars) in 2015; almost one-quarter (24%) of contracts will be too new or have too few enrollees to be rated.
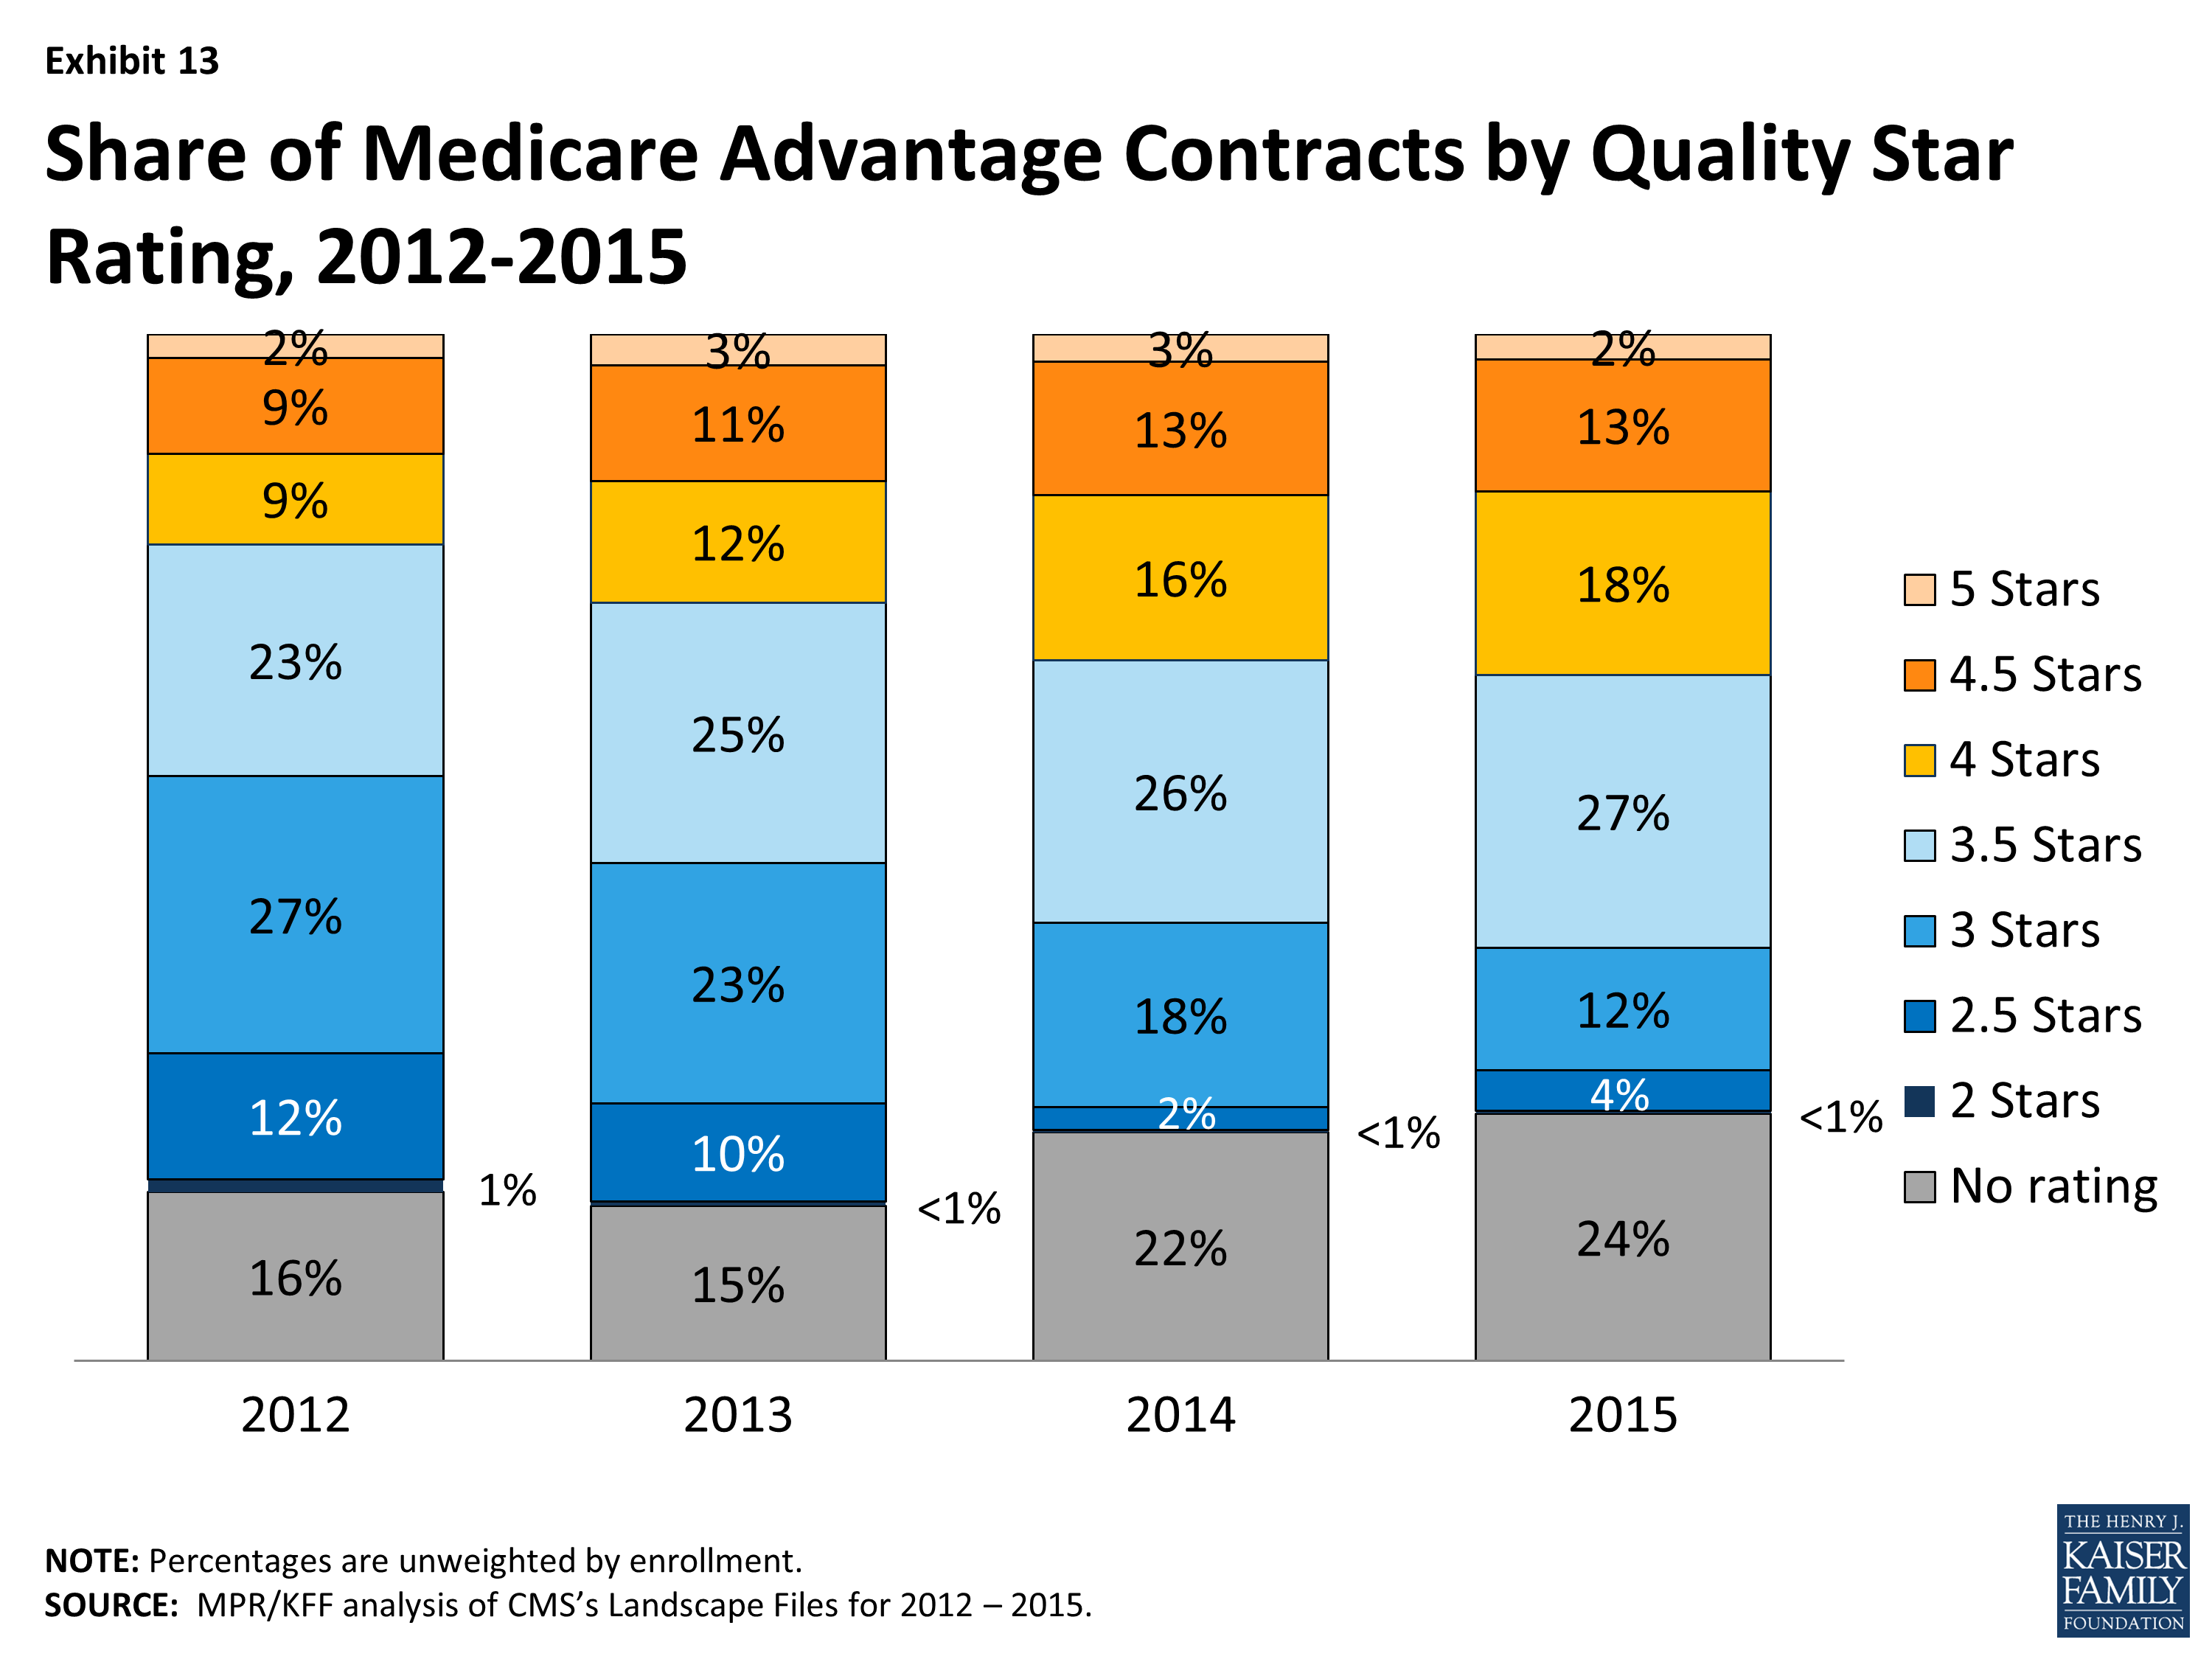
Exhibit 13: Share of Medicare Advantage Contracts by Quality Star Rating, 2012-2015
From the beneficiary perspective, the vast majority of Medicare beneficiaries (97%) will have access to at least one plan with four or more stars in 2015, an increase from about half (51%) in 2012 . This significant increase in access to plans with four or more stars is primarily due to Humana offering a regional PPO with four stars in most parts of the country.
The share of Medicare Advantage contracts with four or more stars has steadily grown since 2012, when the CMS bonus payment demonstration began, and has increased from one-fifth (20%) of plans in 2012. The increase in star quality ratings for plans during the CMS bonus demonstration could be attributed to many factors. Plans clearly responded to the financial incentives pertaining to quality-based ratings and bonuses in the ACA and demonstration, and over time, appear to have learned to modify their practices to maximize quality bonus payments. In addition, CMS has modified the methodology used for determining quality-based ratings; for example, they eliminated the normal distribution of ratings across plans, which had the effect of limiting the number of highly rated plans. It remains to be seen whether quality ratings will continue to improve.
Discussion
Medicare beneficiaries will continue to be able to choose from numerous Medicare Advantage plans and 95 percent of beneficiaries enrolled in Medicare Advantage in 2014 will be able to stay with the same plan unless they choose to switch to another. Markets are by nature unstable as they transition in response to competition. Over the past several years, the Medicare Advantage marketplace has been relatively stable, with relatively few plan exits that could cause disruption in coverage. Firms continue to offer diverse products and most beneficiaries have a choice of HMOs and PPOs, while fewer beneficiaries have access to PFFS plans. Medicare Advantage plans’ low premiums (relative to Medigap) and their ability to package traditional Part A and B benefits, prescription drugs, and some aspects of supplemental coverage into a single offering have proven popular both with insurers and a sizeable subgroup of Medicare beneficiaries.
Consistent with trends elsewhere in the health insurance market, premiums for Medicare Advantage plans are increasing. This change is greater when viewed in percentage terms than absolute dollar terms and is best viewed in conjunction with an analysis of benefits and out of pocket costs for services. While this brief does not examine details on the benefit and cost sharing requirements of Medicare Advantage plans, it documents the increase in out-of-pocket limits across plans, which exposes Medicare beneficiaries with relatively high costs to greater financial risk. Further work is needed to determine the changes in Medicare Advantage plan benefits in response to the ACA and their impact on enrollees’ actual out-of-pocket costs. The reality is that both traditional Medicare and Medicare Advantage plans face challenges in providing financial protection to beneficiaries.
This issue brief was prepared by Gretchen Jacobson and Tricia Neuman from the Kaiser Family Foundation, Anthony Damico (Independent Consultant), and Marsha Gold, Senior Fellow Emeritus of Mathematica Policy Research.