Medicare Advantage 2014 Spotlight: Plan Availability and Premiums
Issue Brief: Issue Brief
- Summary of Findings
- Change in Overall Plan Availability in 2014
- 2014 Plan Choices and Geographic Variation
- Availability by Level of Traditional Medicare Spending
- Availability of Special Needs Plans in 2014
- Market Dynamics and Turnover
- Premiums and Benefits in 2014
- Limits on Out-of-Pocket Spending
- Prescription Drug Coverage
- Discussion
- Recent Legislative and Regulatory Changes for Medicare Advantage
Under the current Medicare program, beneficiaries may enroll in either the traditional Medicare fee-for-service program, or in a private plan, such as an HMO or preferred provider organization (PPO), in what is now known as the Medicare Advantage program. Medicare Advantage plans receive funds from the federal government (Medicare) to provide Medicare-covered benefits to enrollees. As of September 2013, 15 million Medicare beneficiaries (29%) were enrolled in a Medicare Advantage plan. The Affordable Care Act of 2010 (ACA) enacted reductions in payments to Medicare Advantage plans with the goal of creating greater parity in payments between the traditional Medicare program and Medicare Advantage.1
Beneficiaries will see limited changes in the number of plans offered in 2014. Our analysis finds that beneficiaries will be able to choose from 18 plans, on average, in 2014, down from an average of 20 plans in 2013. While some plans will leave the market in 2014, others are coming in or expanding. A small share of enrollees will have to find new plans because their 2013 plan will no longer be available to them in 2014. Almost all will be able to stay in a similar type plan, often with the same company. Beneficiaries will continue to have access to plans with relatively low premiums. Beneficiaries who remain in the same Medicare Advantage plan in 2013 and 2014 are likely to see modest increases in premiums, on average, but could avoid higher premiums by changing plans, although there are other tradeoffs to consider when switching plans. Of note, out-of-pocket limits are expected to be higher in 2014 than in 2013, on average, providing less financial protection to enrollees.
This Data Spotlight, like those prepared by us in previous years, reviews trends in Medicare Advantage plan choices available to beneficiaries, premiums and other plan characteristics in 2014. The brief does not, however, analyze changes in benefits or cost sharing requirements for individual services, which could be major factors in an enrollee’s out of pocket expenses,2 nor does it examine changes in provider networks that could affect beneficiaries’ access to preferred physicians and other health care providers.3 This spotlight is part of a series of spotlights tracking key changes in the Medicare Advantage program. The analysis is based on publicly available data from the Centers for Medicare and Medicaid Services (CMS).4
.
Summary of Findings
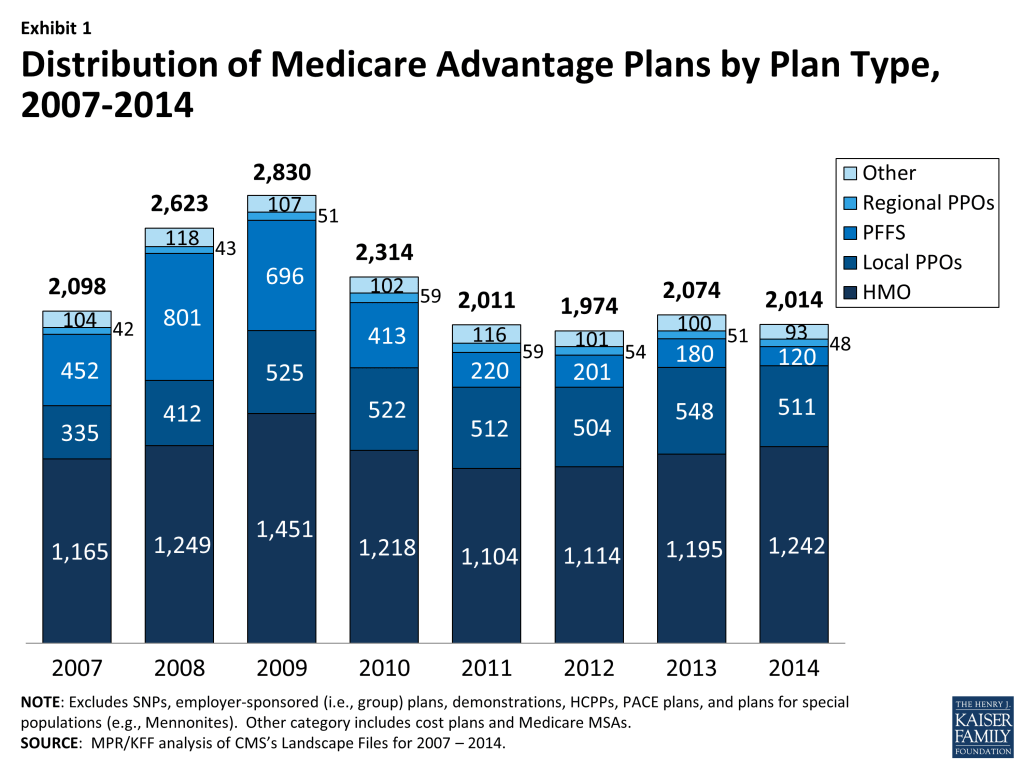
A total of 2014 Medicare Advantage plans will be available nationwide for general enrollment in 2014, down 60 plans from 2013, taking into account new entrants, consolidations, and departures.5 On average, Medicare beneficiaries will be able to choose from among 18 plans in 2014, two fewer than in 2013. As in prior years, choice will be more extensive in metro than non-metro areas (on average 20 versus 11 plans, respectively). About 526,000 of current 2013 Medicare Advantage enrollees (5%) will have to make some change because their plan is not available in 2014. However, almost all of these enrollees (91%) will still be able to choose a plan of the same type, and often a plan that is offered by the same company. Virtually all (99%) beneficiaries in plans that are withdrawing from their area will continue to have access to one or more Medicare Advantage plans.
Medicare Advantage choices available to beneficiaries in 2014 generally are similar to those in the past. Average unweighted monthly plan premiums in 2014 are $49, down from $51 in 2013. Most beneficiaries (84%) will have access to a Medicare Advantage plan offered in their area for no additional premium. Enrollees who stay with their current plan (if available) will find that, on average, their premiums will increase by almost $5, from $35 to $39.
As required by CMS, all Medicare Advantage plans will include an annual limit on out-of-pocket costs. However, the average out-of-pocket limit will increase from $4,333 in 2013 to $4,797 in 2014; 41 percent of plans will have out-of-pocket limits of $5,000 or more. As a result, beneficiaries may want to carefully consider their choices in 2014 to understand how change will affect them and how they might want to respond.
.
Change in Overall Plan Availability in 2014
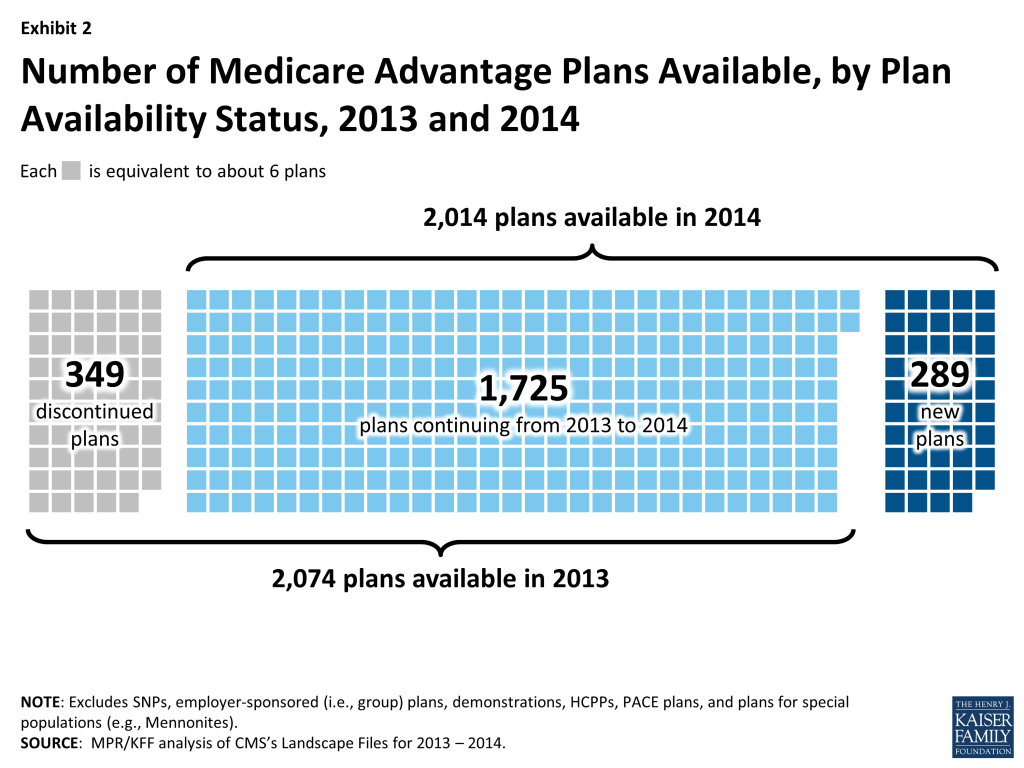
In total, there will be 2014 Medicare Advantage plans nationwide available for individual enrollment in 2014 (Exhibit 1). In aggregate, 60 fewer plans will be available in 2014 than in 2013, a relatively small change that reflects offsets of plan expansion and contraction (discussed below). The average Medicare beneficiary will have 18 plans available from which to choose in 2014, with beneficiaries in metro areas having an average of 20 choices and those in non-metro areas having an average of 11 choices, each down by two since 2013 (Table A1). Conceptually, the number of choices in 2014 is a combination of the number offered in 2013 that remain in the market in 2014 and any new plans that enter. Table A2 provides additional detail on the dynamics of change in available plans between 2013 and 2014 and the effects on current enrollees.
Staying Plans. Of the 2074 plans offered in 2013, 1725 (83%) will continue to be available in 2014, including 1,221 plans that will continue with the same service area, 219 plans that will have an expanded service area, and 194 plans that will have a reduced service area (Exhibit 2). These plans account for five percent of total 2013 enrollment. Plan service areas are defined by counties, except for regional PPOs which serve one or more states. Generally, a beneficiary must live in the service area of a plan to enroll.
New Entrants. Among the 289 new plans offered in 2014, 80 percent are HMOs, the historically dominant plan type, 19 percent are local Preferred Provider Organizations (PPOs), and the remainders are Private Fee-for-Service (PFFS) plans and regional PPOs.
Departing Plans. In general, firms with a plan departing are not leaving areas but instead are making changes to the selection of plans available to beneficiaries in the area. Of the 349 plans that will no longer be offered in 2014, PFFS plans are disproportionately represented, and account for over half (34 out of 66 plans) of the contract terminations. The role of PFFS plans in the Medicare Advantage marketplace has been declining substantially since the Medicare Improvements for Patients and Providers Act (MIPPA) of 2008 required most PFFS plans to adopt provider networks, and this historical trend will continue in 2014.
As a result of firm consolidations, 208 of all Medicare Advantage plans in 2013 will be consolidated into 91 plans, resulting in the departure of 117 plans. Reasons for such consolidation include acquisitions or mergers of firms with similar plans, firms consolidating plans in response to market forces, and CMS’s push to have firms eliminate plans with few enrollees or that are very similar to others offered by the firm in the same service area.
Effects on Beneficiaries. The overall effect of plan departures on beneficiaries will be mitigated because new plans are entering the market and other plans are expanding their service areas. As a result, the average beneficiary will see only a small change in the number of plans available. However, some beneficiaries (526,127 beneficiaries or 5 percent of all those enrolled in Medicare Advantage plans) will be required to either switch to another Medicare Advantage plan or return to the traditional Medicare program.
Given the pattern of departures, most enrollees affected by departures will find that their choices will not change dramatically between 2013 and 2014. Beneficiaries in some types of plans, particularly PFFS plans, will be more affected by plan withdrawals. Overall, half of enrollees in departing plans will be able to choose a plan of the same plan type (e.g., HMO, local PPO) from the same company and 62 percent will be able to stay with the same company if they enroll in a different type of plan. Overall, less than one percent of beneficiaries enrolled in a Medicare Advantage plan in 2013 will not be able to enroll in a Medicare Advantage plan in 2014.
2014 Plan Choices and Geographic Variation
In 2014, as in recent years, virtually all Medicare beneficiaries will have access to a Medicare Advantage plan as an alternative to traditional Medicare (Exhibit 3). Nationwide 99 percent of all beneficiaries (100 percent in metro areas and 98 percent in non-metro areas) have one or more Medicare Advantage choices, and most have a wide range of plans available to them. The largest difference in 2014 is that fewer beneficiaries—but still a majority – will have a choice of a PFFS plan.
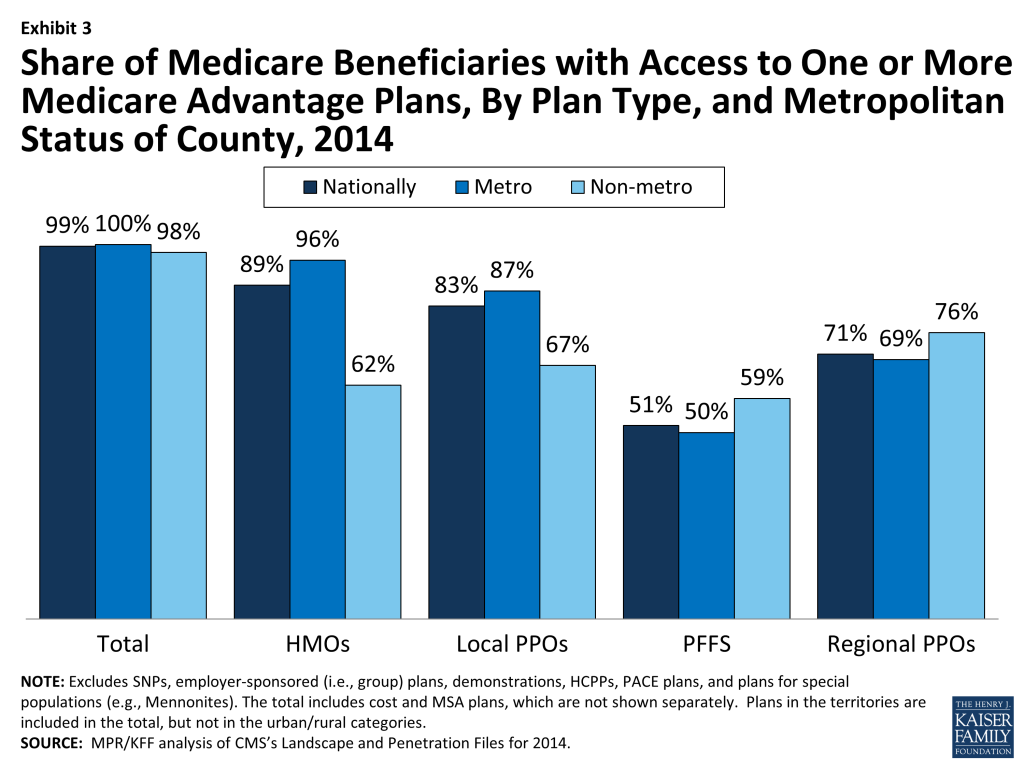
In 2014, 89 percent of Medicare beneficiaries will have access to an HMO and 83 percent to a local PPO. Among beneficiaries in non-metro areas, 62 percent will have access to an HMO and 67 percent will have access to a local PPO. In metro areas, 96 percent and 87 percent of beneficiaries, respectively, will have access to an HMO or local PPO. Regional PPOs will be somewhat less commonly available, but such plans will be available to 69 percent of metro beneficiaries and 76 percent of non-metro beneficiaries.
Consistent with recent trends, the availability of PFFS plans nationwide continues to decrease, and 51 percent of beneficiaries (50% of beneficiaries in metro areas and 59% of beneficiaries in non-metro areas) will have access to a PFFS plan in 2014, down from 59 percent in 2013.
Availability by Level of Traditional Medicare Spending
Historically, beneficiaries in counties with the highest per capita spending for traditional Medicare (top quartile) have had more Medicare Advantage plans available to them than have beneficiaries in lower cost counties (Table A1). In 2012, the first year of Medicare Advantage payment reform under the ACA (See Box on Recent Legislative and Regulatory Changes), the number of plans available to beneficiaries decreased within each quartile, with the largest decreases in the highest cost counties. In 2014, the average number of plan choices within the highest cost counties will decline to 21 in 2014, down from 24 in both 2013 and 2012. Beneficiaries in the lowest cost counties will continue to have an average of 17 plan options, the same number available, on average, for the past two years.
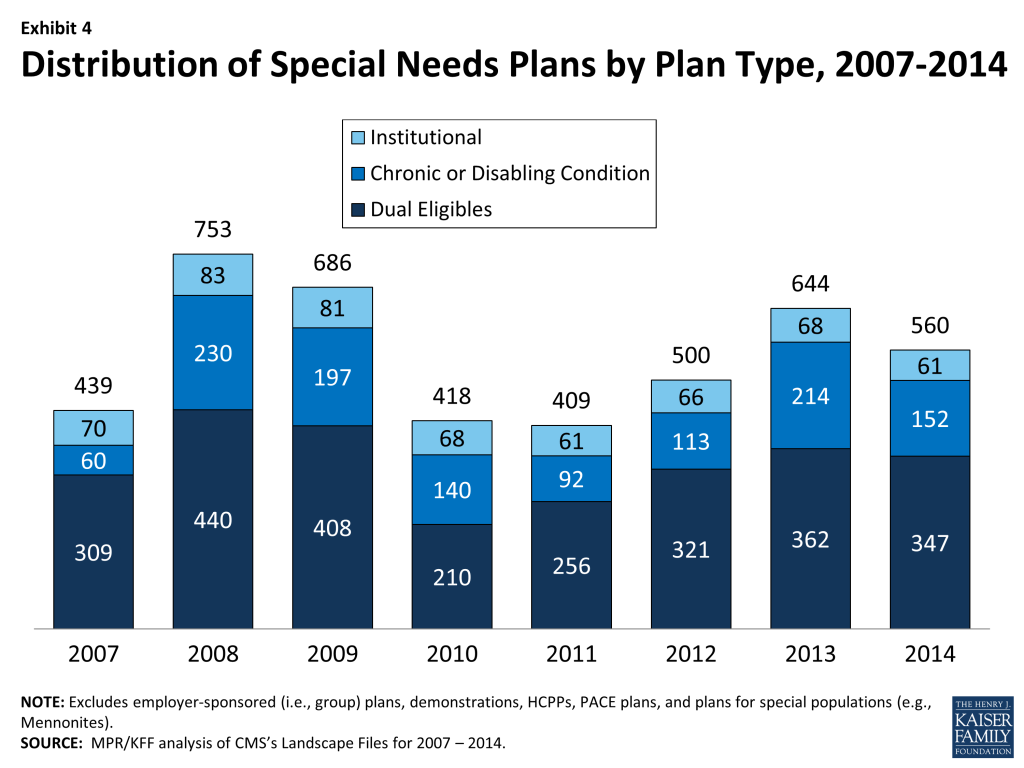
Availability of Special Needs Plans in 2014Special Needs Plans (SNPs), a type of Medicare Advantage plan, were authorized in 2003 to provide a managed care option for beneficiaries with significant or relatively specialized health care needs, including Medicare beneficiaries who are dually eligible for Medicare and Medicaid (“dual eligibles”), beneficiaries requiring an institutional-level of care (e.g., nursing home residents), and beneficiaries with severe or chronic disabling conditions. Most SNPs are HMOs, but they can also be local PPOs or regional PPOs. When SNPs were authorized, there were few requirements beyond those otherwise required of other Medicare Advantage plans. The Medicare Improvements for Patients and Providers Act (MIPPA) of 2008 required SNPs to conform to the specialized enrollment role originally set for them. For example, authority for chronic or disabling conditions was limited to specific diagnoses or conditions and all SNPs were required to provide a care management plan to document how care would be provided for the unique subgroups covered by the plan. The number of SNPs declined in 2010 in response to the additional requirements placed upon SNPs in MIPPA. As part of the ACA, SNPs for dual eligibles are required to have a contract with the Medicaid agency for every state in which the plan operates, beginning in 2013; CMS was flexible about the scope of agreement required. In 2014, the availability of special needs plans for those dually eligible for Medicare and Medicaid in some states also may be influenced by activity to improve the financial alignment between these two programs and better integrate care for this vulnerable subgroup of Medicare beneficiaries.6 In 2014, 560 SNPs in total will be available nationwide to those eligible for enrollment, down from 644 plans in 2013 (Exhibit 4; Table A3). Most of the decline between 2013 and 2014 reflects a drop in chronic care SNPs, from 214 plans in 2013 to 152 plans in 2014. Institutional SNPs, always limited in number, will decline from 68 plans in 2013 to 61 plans in 2014. SNPs for dually eligible beneficiaries will continue to be the most common type of SNP, though the number will decline from 362 plans in 2013 to 347 plans in 2014.
SNP availability will continue to vary across states in 2014 as in prior years. At least one SNP of any type will be available in all states but eight (AK, ME, MT, NH, ND, SD, VT, and WY). SNPs will be most numerous in selected high population states, notably Florida (130 plans), California (64 plans), New York (57 plans), and Texas (35 plans). From 2013 to 2014, Florida experienced a notable growth in SNPs (from 112 plans in 2013 to 130 plans in 2014), which reflects proportionate increases in all three types of SNPs. In most other states, change was more limited. There are no obvious geographical explanations for the overall decline in SNPs nationwide from 2013 to 2014. |
Market Dynamics and Turnover
While many organizations offer Medicare Advantage plans, a few – particularly Humana, United Healthcare, and the Blue Cross and Blue Shield (BCBS) affiliates – have particularly large geographic spread and these organizations historically account for a disproportionate share of enrollment. In 2014, 44 percent of available plans are being offered by one of these three firms or affiliates (Table A4). Plans offered by these firms are available to most beneficiaries. Nationwide, 83 percent of Medicare beneficiaries will have access to one or more Humana plans, 73 percent will have access to a BCBS affiliated plan (including BCBS plans offered by Wellpoint), and 68 percent will have access to a United Healthcare plan (Exhibit 5; Table A5). The general availability of these firms’ products has not noticeably changed from 2013 to 2014. However, the similarities in BCBS offerings from 2013 to 2014 obscure a decline in availability of BCBS branded Wellpoint plans (declining from 88 plans to 55 plans between 2013 and 2014), which is mostly offset by the growth in plans offered by other BCBS affiliates (growing from 205 plans to 233 plans between 2013 and 2014).
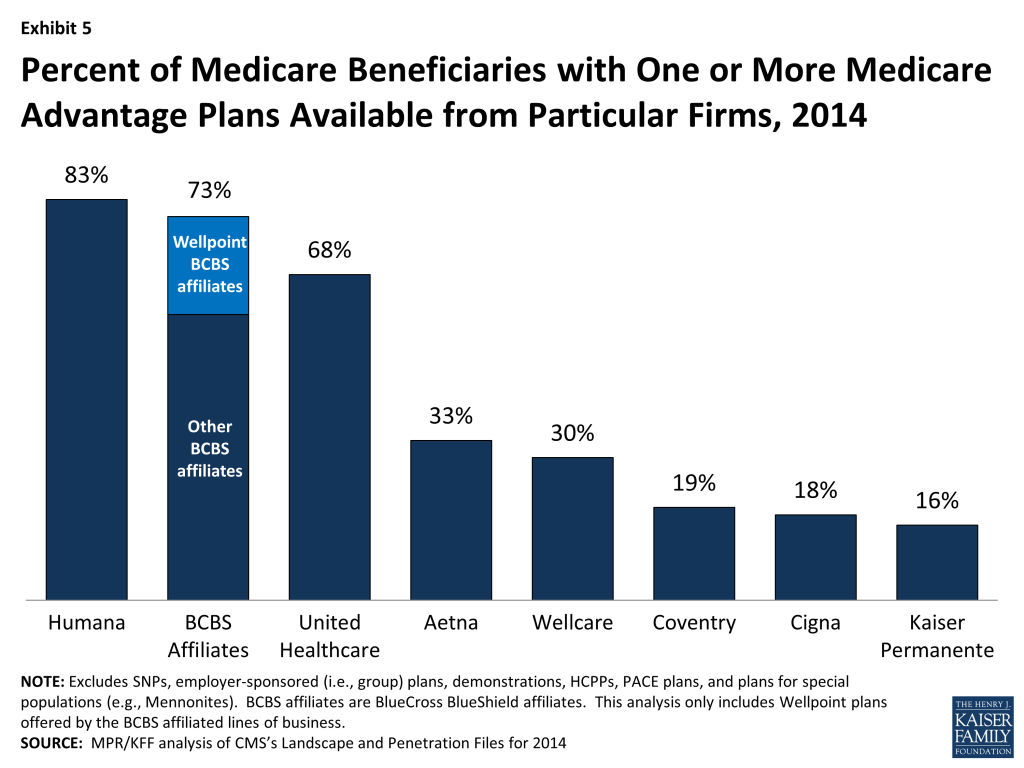
Aetna also has a large geographic spread. Aetna plans are available to 33 percent of all beneficiaries and 19 percent of beneficiaries will have access to a plan from Coventry, Aetna’s recent acquisition, in 2014; a total of 44 percent of beneficiaries will be access to a plan either from Coventry or Aetna. Other firms with plans available across a large share of the market include Wellcare, Cigna and Kaiser Permanente.
Humana and UnitedHealthcare, and to a lesser extent the BCBS affiliates, define the regional PPO market; no other company operates in this market now.
.
Premiums and Benefits in 2014
Premiums, benefits, cost sharing requirements and provider networks are important plan characteristics for beneficiaries to consider when choosing among Medicare Advantage plans, because of the potential effect on beneficiaries’ out-of-pocket costs and their access to preferred health care providers. This analysis focuses on national trends in premiums, out-of-pocket spending limits and Part D drug coverage, using data CMS released in September 2013. The analysis is based on Medicare Advantage plans that offer prescription drug coverage (and excludes the minority of Medicare Advantage plans that do not cover prescription drugs) because most Medicare Advantage plans (83%) offer drug coverage and holding drug coverage constant makes for clearer comparisons of premiums over time or by plan type.
This brief does not include information on cost sharing requirements for individual services, such as hospitalizations or physician visits, which could be a major factor in an enrollee’s out-of-pocket expenses. It also does not examine changes in provider networks, which some plans have reportedly changed for 2014. Thus, it is possible that plans are making changes in benefit design, supplemental benefits and networks that could have important implications for enrollees, but are beyond the scope of this paper. It also focuses on national averages, rather than a comparison of the specific plans available where an individual beneficiary lives and how they are changing over time.
Monthly Premiums (Unweighted). Medicare beneficiaries enrolled in Medicare Advantage plans pay the Part B premium like other beneficiaries (less any rebate provided by the Medicare Advantage plan), and any additional monthly premium charged by the Medicare Advantage plan for plan benefits and prescription drug coverage (Part D).7 The latter is paid directly to the Medicare Advantage plan. Premiums presented in this Spotlight are not weighted by enrollment. Such “unweighted” premiums show the change in premiums for plans available to beneficiaries. The “weighted” average Medicare Advantage premium, in contrast, reflects what beneficiaries currently in plans will pay in 2014 if they stay in the same plan and do not make any changes in the open enrollment period. Historically, average premiums are lower once beneficiaries respond to new plan choices;8 we will be providing this analysis for 2014 once enrollment stabilizes after the open enrollment period.
In 2014, the average unweighted monthly premium for Medicare Advantage Prescription Drug plans (MA-PDs) will be $49—a $2 decrease from 2013 and lower than the premium in 2011 or 2012 (Exhibit 6).
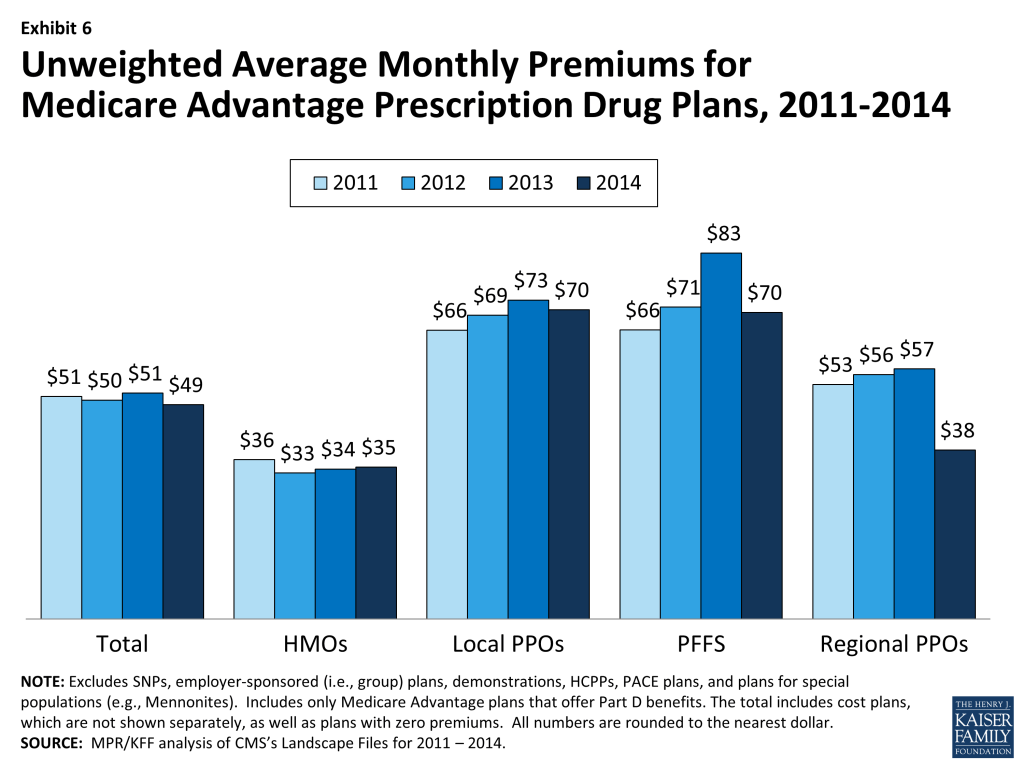
Premiums for HMOs will average $35 per month in 2014, up $1 from 2013 but still lower than the average monthly premium for regional PPOs ($38), and substantially lower than the average monthly premiums for local PPOs ($70) and PFFS plans ($70). In 2014, the only plan type with large changes in premiums is PFFS plans, where average premiums of $70 are down $13 from $83 in 2013.
Among large national firms, average premiums are similar for HMOs offered by UnitedHealthcare, Humana, and Wellpoint affiliated BCBS plans and are substantially lower than those for Kaiser or other Blue Cross and Blue Shield Affiliates. Among other plan types, UnitedHealthcare’s premiums are lower, on average, than those charged by these firms (where applicable) in 2014 (Table A6). However, comparisons among firms should be interpreted cautiously since the firms offer plans in different counties.
Monthly Premiums, Assuming Enrollees Remain in the Same Plan for 2013 and 2014. Although the average premium actually paid by Medicare Advantage enrollees in 2014 will not be known until after beneficiaries are enrolled in plans for 2014, we use MA-PD enrollment patterns in 2013 for plans that will also be offered in 2014 to estimate what the average current Medicare Advantage enrollee would pay for a plan in 2014. If enrollees in MA-PDs in 2013 remain in their plan in 2014 they will see their monthly premiums rise from $34.61 in 2013 to $39.46 in 2014 – a monthly increase of almost $5 or 14 percent (Exhibit 7; Table A7).
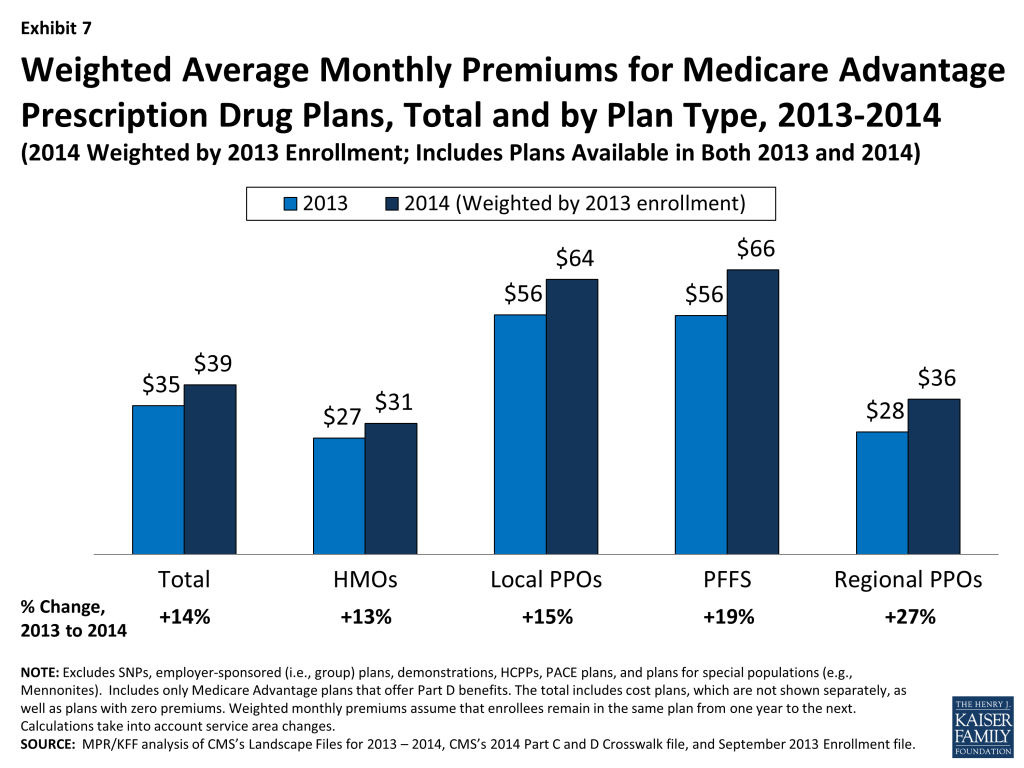
HMO enrollees will see the lowest premium increase, both in absolute terms (from an average of $27.09 in 2013 to $30.51 in 2014) and percentage terms (13%), if they stay in the same plan for 2014. Average monthly premiums for enrollees in local PPOs will increase from an average of $55.73 in 2013 to $63.96 in 2014 ($8.23 average increase), while monthly premiums for enrollees in PFFS plans will increase slightly more, from an average of $55.56 in 2013 to an average of $66.22 in 2014 ($10.65 average increase). Premiums for enrollees in regional PPOs will increase by $7.66 per month, on average, from $28.48 in 2013 to $36.14 in 2014.
After weighting premiums by 2013 enrollment, average premiums in 2013 are generally lower for the 2013 plans that will be offered in 2014 than for plans that are terminating at the end of 2013 ($34.61 versus $41.13). This is true both in the aggregate and for most plan types, which could mean higher premium plans departing were less competitive. PFFS plans are an exception to this pattern, as the average premium for departing plans ($37.07) in 2013 was much lower than the average premium for remaining plans ($55.56) in 2014. Since PFFS plan departures also are much more likely to reflect contract non-renewals, this could imply that PFFS plans in general were not competitive in those markets or were not competitive for specific firms.
Availability of “Zero Premium” MA-PDs. As in prior years, most Medicare beneficiaries nationwide (84%) will have access to at least one MA-PD that charges them no additional premium for coverage, other than the monthly Part B premium, also known as “zero premium plans” (Exhibit 8).
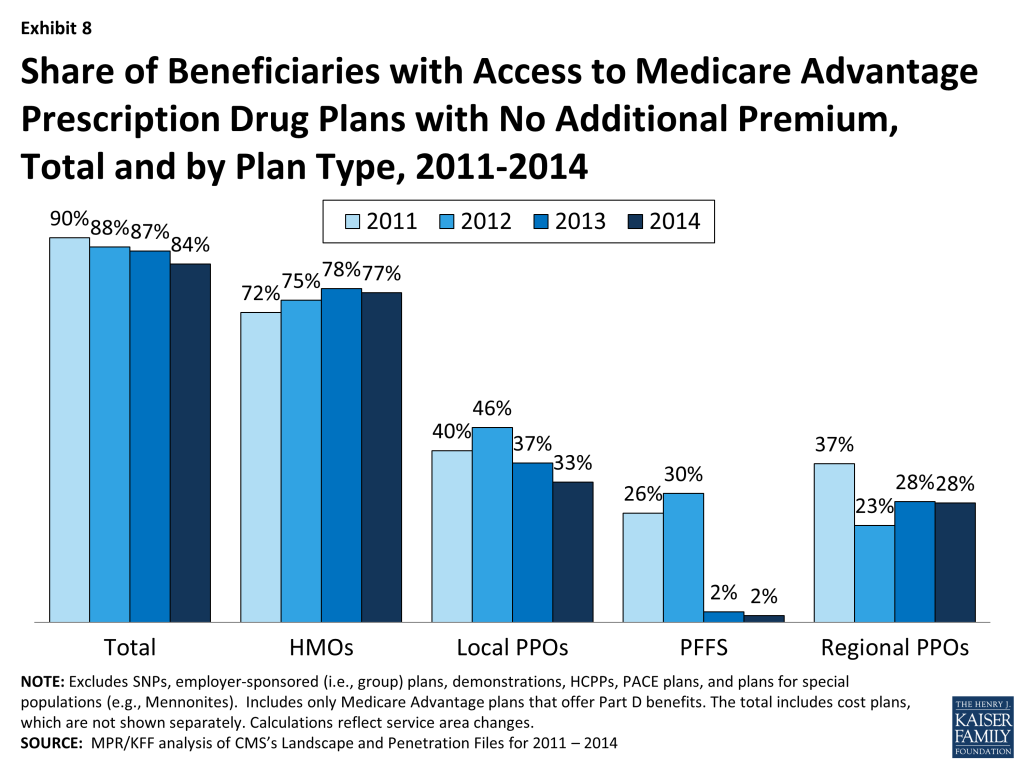
Beneficiaries are most likely to have zero premium HMOs available and least likely to have zero premium PFFS plan available. In 2014, 77 percent of beneficiaries will have at least one zero premium HMO available; in comparison, 28 percent of beneficiaries will have access to a zero premium regional PPO, 33 percent will have access to a zero premium local PPO, and 2 percent will have access to a zero premium PFFS plan.
.
Limits on Out-of-Pocket Spending
The traditional fee-for-service Medicare program does not include a limit on out-of-pocket spending for services covered under Parts A and B, which is one reason most beneficiaries have supplemental coverage to limit their financial liability. When HMOs were first offered under the risk contracting program in the mid-1980s, they covered most of Medicare’s cost sharing requirements, making out-of-pocket limits unnecessary. However cost sharing requirements have increased over time in Medicare Advantage plans, reflecting cost growth and other societal trends.9 In 2006, when they were first authorized, regional PPOs were required by law to have a limit on out-of-pocket spending for benefits under Parts A and B. Beginning with the 2011 plan year, CMS required all other Medicare Advantage plans to include a limit on enrollees’ out-of-pocket expenses, set to no more than $6,700. CMS encouraged plans to limit enrollees’ out-of-pocket expenses to no more than $3,400 per year.
Average out-of-pocket limits in 2014 will be higher than in 2013, providing less protection to enrollees with relatively high out-of-pocket costs ($4,797 versus $4,333). In 2014, about one-third (37%) of plans set limits at or below CMS’s recommended limit of $3,400, a decline from almost half in 2013 (48%), 2012 (50%) and 2011(51%). Conversely, the share of plans with a limit exceeding $5,000 is higher in 2014 than in 2013 (41% versus 25%, respectively; Exhibit 9).
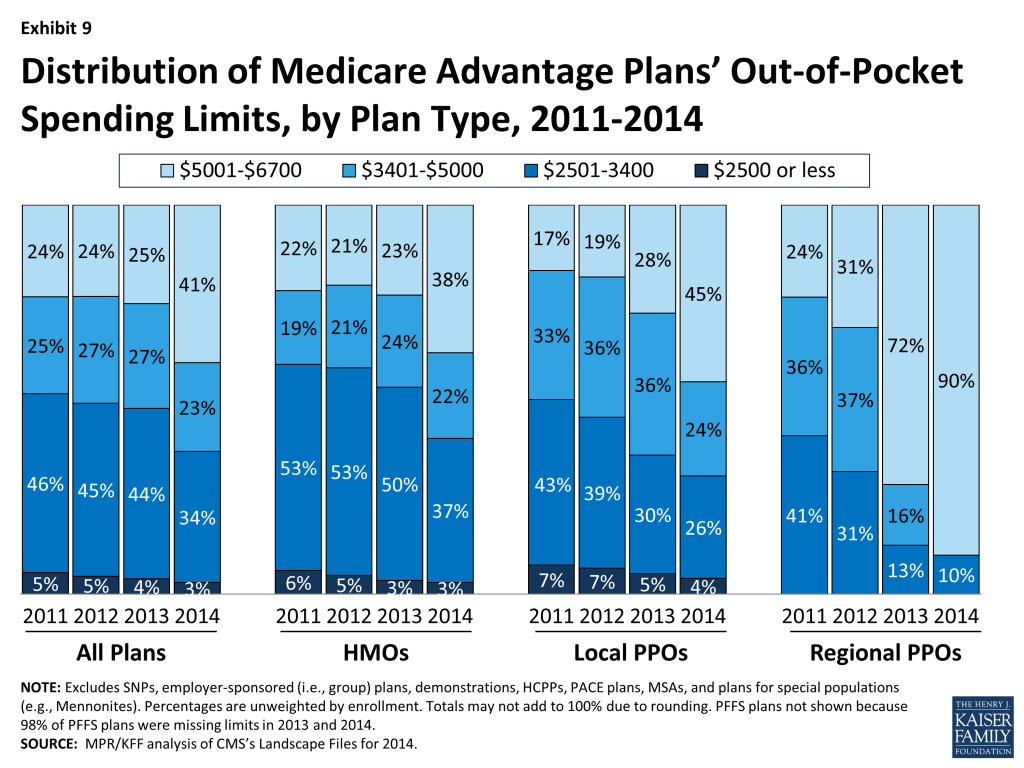
Average out-of-pocket limits vary by plan type in 2013, as they have historically. In 2014, the average limit on out-of-pocket spending is lower for HMOs ($4,707) than local PPOs ($4,927) – both of which are substantially lower than for regional PPOs ($6,137). Across all plan types, a fairly large share of plans have limits in excess of $5,000, including HMOs (38%), local PPOs (45%) and the vast majority (90%) of regional PPOs.
If MA-PD enrollees stay in the same plan in 2014, out of pocket limits will rise by about 15 percent, from an average of $4,294 in 2013 to $4,900 in 2014 (Table A7). Average limits will be higher by about the same dollar amount for each type of plan, although they will continue to be lower for those in HMOs ($4,705) and local PPOs ($4,980) than regional PPOs ($6,348).
In other work, we also have documented variation across plans and found that it persists even when Medicare Advantage payment rates are taken into consideration.10 From a beneficiary perspective, this variation, together with the increase in out-of-pocket limits, means that it is important to review the details of plan benefits each time they are choosing a plan and to review such choices annually.
.
Prescription Drug Coverage
Prior to 2006, traditional Medicare did not offer an outpatient prescription drug benefit, and Medicare Advantage plans were an important source of prescription drug coverage for people on Medicare. Many plans offered some coverage for prescription drugs, which they often financed in part with the net difference between Medicare Advantage payments for Part A and B benefits and the plan’s cost for such benefits. Beginning in 2006, all beneficiaries had access to a prescription drug plan, either through free-standing prescription drug plans (PDPs) or a Medicare Advantage plan that included drug coverage (MA-PD). With some limited exceptions, beneficiaries choosing to enroll in a Medicare Advantage plan who wish to get the Part D drug benefit must receive the drug coverage from the Medicare Advantage plan selected. Today, 83 percent of Medicare Advantage plans offer prescription drug coverage. Many of the plans that do not offer drug coverage are designed for beneficiaries who may have access to other sources of prescription drug coverage, including former employers such as the Department of Veterans Affairs.
The initial design of the Medicare drug benefit included a coverage gap, or “doughnut hole” that required beneficiaries with relatively high drug costs to pay 100 percent of their expenses in the gap until they qualified for catastrophic protection. The ACA phases in coverage in the gap, and eliminates the gap altogether by 2020. In 2014, beneficiaries will be responsible for no more than 47.5 percent of the cost of brand-name drugs and 72 percent of the cost of generic drugs in the gap.
Medicare Advantage Prescription Drug Plans. More than one third (37 percent) of all Medicare beneficiaries enrolled in Part D in late 2013 were in an MA-PD, with the remaining 63 percent in a freestanding PDP.11 Many MA-PDs provide prescription drug coverage and other supplemental benefits available for no additional premium.12
- Half (50 percent) of MA-PD plans will offer some additional prescription drug coverage in the Part D coverage gap, also known as the Part D “donut hole”, other than that required by the ACA (Exhibit 10).
- Among MA-PDs providing coverage in the gap beyond that which is required by current law, half increase coverage only for generic drugs and half also include some expanded brand coverage as well.
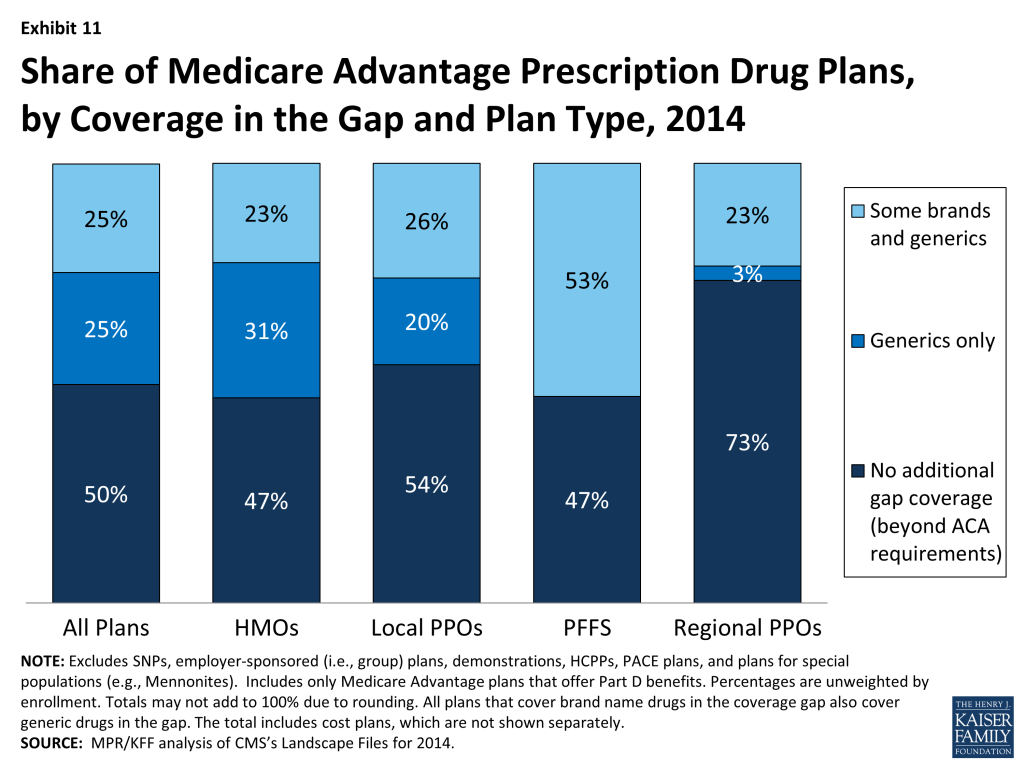
- In 2014, as in 2013, a smaller share of regional PPOs (26%) than other plan types will provide any additional gap coverage, including HMOs (53%), local PPOs (46%), and PFFS plans (53%) (Exhibit 11).
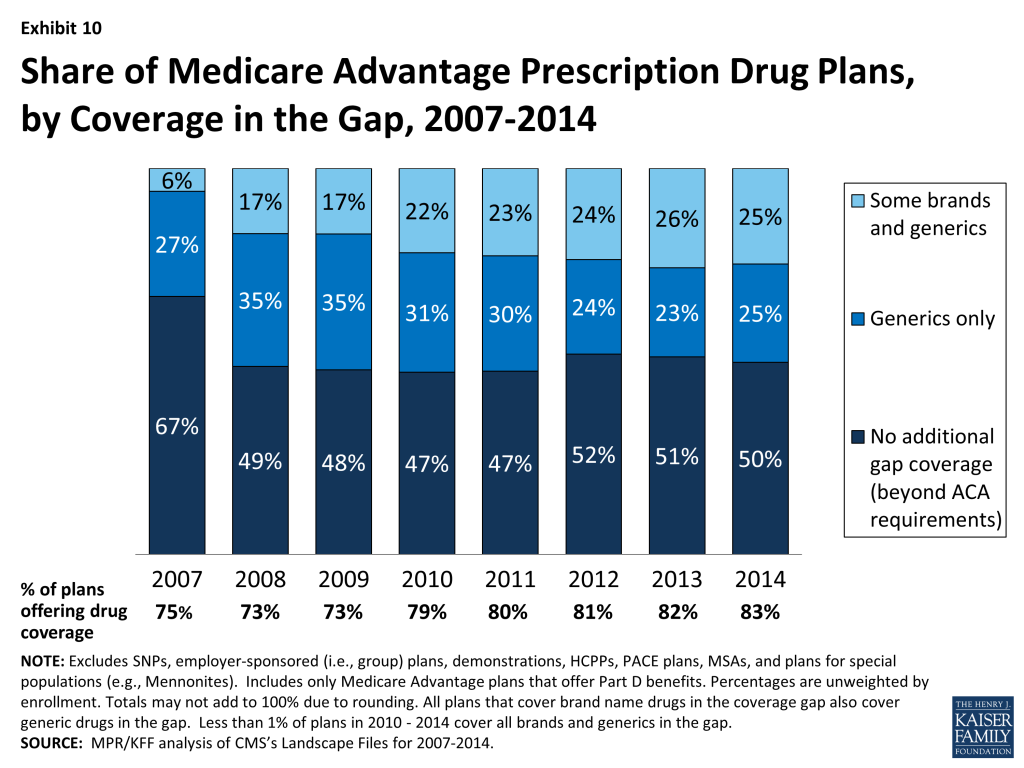
A larger share of MA-PDs than PDPs will provide some form of gap coverage. Fifty percent of MA-PDs will provide some form of gap coverage in 2013, as compared to 17 percent of PDPs, down from 30 percent in 2013.13 One reason for this difference is that the structure of MA-PDs allows plans to offset prescription drug costs using any savings in Part A and B services. These savings are declining because the ACA gradually reduces the Medicare Advantage benchmark payments, which currently are higher on average than the per capita costs of traditional Medicare in many counties.
.
Discussion
In 2014, Medicare beneficiaries will continue to be able to choose from among many Medicare Advantage plans, offered by many firms, in virtually all parts of the country. HMOs continue to be more numerous than other plan types, but the availability of local PPOs is growing. Regional PPOs also remain available to many Medicare beneficiaries, although a relatively small number of firms offer them. While PFFS plans were available in large numbers between 2006 and 2009, many fewer PFFS plans are now being offered and their role has been eclipsed by local and regional PPOs. The reduction in PFFS plans is generally consistent with the federal intent behind MIPPA that established network requirements for PFFS plans in order to enhance the value of these plans for beneficiaries and improve their ability to manage care. The dominance of a few large firms in the Medicare Advantage marketplace probably warrants ongoing monitoring to ensure that such concentration does not limit competition, particularly on value and quality of care.
While the 2014 Medicare Advantage marketplace will look much as it does in 2013, five percent of Medicare Advantage enrollees will need to change plans as their plan will no longer be available in 2014, most of whom should have little problem finding a substitute plan with similar characteristics, often from the same company. Current MA-PD enrollees who stay in the same plan in 2014 are expected to see average monthly premiums rise by nearly $5. Limits on out-of-pocket spending are also expected to rise, by just over $600, on average. The uptick in premiums for enrollees who do not switch plans, and the increase in average out-of-pocket limits, may be a response by insurers to the payment reforms included in the ACA. Additional research is needed to explore whether plans are making other changes in 2014 to constrain costs, for example, by increasing cost-sharing requirements for individual services or narrowing provider networks, which might have important implications for beneficiaries.
Beneficiaries who review the plans offered in their area may be able to find a plan that could lower their costs. Yet, a growing body of evidence suggests a high level of inertia, with few beneficiaries in Part D switching plans from one year to the next.14 As the Medicare program and Medicare Advantage continue to evolve, it will be important to continue to monitor change in the choices available to beneficiaries, including plan availability, premiums, benefits, cost sharing, and provider networks, to assess what this means for the financial protection of beneficiaries, and the ability of beneficiaries to access quality care in Medicare Advantage plans.
.
Recent Legislative and Regulatory Changes for Medicare AdvantageOver the years, Congress and various Administrations have made a number of changes to payments and participation rules for private risk-bearing plans that contract with the federal government to provide Medicare covered benefits, now called Medicare Advantage plans. In the past, for example, Congress expanded the range of plans that could be offered to beneficiaries (BBA 1997 and MMA 2003) and imposed new requirements for plans, such as requiring PFFS plans to have networks of providers in most counties (MIPPA 2008). The Administration also made changes to the rules for Medicare Advantage plans, including policies seeking to encourage the consolidation of low enrollment and duplicative (“look alike”) plans and limit the use of cost sharing features that might adversely affect high cost beneficiaries, beginning in 2010. In 2011, CMS began requiring plans to limit beneficiaries’ out-of-pocket expenditures to no more than $6,700 annually, with reduced scrutiny of beneficiary cost-sharing for plans that limited out-of-pocket expenses to $3,400 or less. With respect to payments, after years of increasing federal payments in order to encourage more plans to participate, Congress enacted changes in payment policy in 2010 in response to evidence that Medicare was paying more for Medicare beneficiaries enrolled in Medicare Advantage plans than it would have paid for such beneficiaries in the traditional Medicare program. The Affordable Care Act (ACA) of 2010 (the Patient Protection and Affordable Care Act of 2010 as amended by the Health Care Education Reconciliation Act of 2010) imposed a freeze on maximum payments to plans (benchmarks) through 2010 and 2011, with payment reductions phasing in beginning in 2012, based on relative per capita traditional Medicare costs in the county. Counties experiencing larger reductions will see them phased in over a longer period of time to minimize disruption. Also, beginning in 2012, plans’ quality ratings are being used to provide bonus payments and determine which plans can enroll beneficiaries throughout the calendar year. Payments to plans for 2014 will be adjusted for differences in diagnostic coding intensity between Medicare Advantage plans and traditional Medicare (i.e., “coding intensity adjustments”), as well as the possible sequestration of payments to plans as a result of the Budget Control Act. Plans in 2014 and subsequent years will be required to maintain a medical loss ratio (i.e., the share of federal payments and beneficiary premiums spent on medical services) of at least 85 percent, limiting the amount spent on administrative expenses, including profits, and a new tax on all insurance plans, including Medicare Advantage plans will go into effect beginning in 2014. For additional information on changes see Kaiser Family Foundation, “Explaining Health Reform: Key Changes in the Medicare Advantage Program,” May 2010; Kaiser Family Foundation, “Medicare Advantage Plan Star Ratings and Bonus Payments in 2012,” November 2011; and Kaiser Family Foundation, “The Budget Control Act of 2011: Implications for Medicare,” September 2011. |
Marsha Gold is with Mathematica Policy Research; Gretchen Jacobson, Anthony Damico, and Tricia Neuman are with the Kaiser Family Foundation.
Issue Brief: Appendix
Appendix
Endnotes
- See Kaiser Family Foundation “Explaining Health Reform: Key Changes in the Medicare Advantage Program, April 29, 2010 http://modern.kff.org/health-reform/issue-brief/explaining-health-reform-key-changes-in-the/. ↩︎
- Plan specific information about cost-sharing requirements and benefits is at www.medicare.gov on the “Find Health and Drug Plan” database. However, this database does not include summary statistics on the characteristics of plans available nationwide or in particular areas. Further research is needed to assess changes in benefits and cost sharing among Medicare Advantage plans over time. ↩︎
- There have been anecdotal reports of some plans making changes in provider networks in 2014. See, for example, Matthew Sturdevant, “Insurer’s Move Draws Attention of Delegation, AMA,” The Hartford Courant, October 10, 2013. However, data to assess broad-based trends is lacking, making it difficult to assess whether such phenomena reflect specific localized situations or more general trends. ↩︎
- Data for individual plans offered are contained in the MA and SNP Landscape Source files for 2014 and previous years. http://www.cms.gov/Medicare/Prescription-Drug-Coverage/PrescriptionDrugCovGenIn/index.html ↩︎
- Plan counts exclude group plans and SNPs since they are not available to all beneficiaries for individual enrollment. They also exclude plans with special eligibility or other requirements, including Health Care Prepayment Plans (HCPPs), the Program for All Inclusive Care for the Elderly (PACE), demonstrations, and plans offered by selected groups like the Mennonites. ↩︎
- For additional information see, https://modern.kff.org/medicaid/fact-sheet/state-demonstration-proposals-to-integrate-care-and-align-financing-for-dual-eligible-beneficiaries/ and M. Gold, W. Wang, and G. Jacobson. “Medicare Health Plans and Dually Eligible Beneficiaries: Industry Perspectives on the Current and Future Market, Kaiser Family Foundation, March 2013. ↩︎
- Medicare Advantage plans are required to cover all Part A and B Medicare benefits on an actuarially equivalent basis. While they are not precluded from charging beneficiaries an extra premium for those benefits if the plan’s costs exceed what Medicare pays for such benefits, this is not a very likely option in the current environment given current benchmarks used to set Medicare Advantage rates and the important role premiums play in competing for enrollment. ↩︎
- For 2013 enrollment weighted statistics, see M. Gold, G. Jacobson, A. Damico and T. Neuman. “Medicare Advantage 2013 Spotlight: Enrollment Market Update, June 2013. ↩︎
- M. Gold “Medicare+Choice: An Interim Report Card” Health Affairs 40(4): 120-138, July 2001. See also, M. Gold, M. Hudson, G. Jacobson, and T. Neuman “Medicare Advantage 2010 Data Spotlight: Benefits and Cost Sharing” Kaiser Family Foundation, February 2010. ↩︎
- M. Gold. “Making Sense of the Change in How Medicare Advantage Plans are Paid.” Issue Brief. New York: The Commonwealth Fund, May 2013; and M. Gold and M. Hudson, “Analysis of the Variation in Efficiency of Medicare Advantage Plans Relative to Medicare FFS.” Paper developed for the Commonwealth Fund. Washington, DC: Mathematica Policy Research, Research Brief, May 2013. ↩︎
- This statistic includes both those enrolled in individual and group plans because CMS does not breakdown MA-PD data this way; it only breaks down overall Medicare Advantage data and some of those enrollees are not in a Part D plan. Authors’ calculation from October 2013 data from the 10.17.13 Medicare Advantage, Cost, PACE, Demo and Prescription Drug Plan Organizations—Monthly Summary Report released by CMS on its website at: http: //www.cms.hhs.gov/MCARAdvPartDEnrolData/.) ↩︎
- In contrast, free-standing prescription drug plans all have some associated premium, with the average monthly PDP premium in 2013 at $39.90 (weighted by 2013 enrollment, assuming currently enrolled beneficiaries remain in their current plan). This is a 5 percent increase from the weighted average monthly premium of $38.14 in 2013 and a 54 percent increase from 2006, the first year of the Medicare Part D drug benefit. See J. Hoadley, et al. “Medicare Part D: A First Look at Plan Offerings in 2014” Kaiser Family Foundation Issue Brief, October 2013. ↩︎
- J. Hoadley, et al. op site. The paper indicates that 82 percent of PDPs will offer no or limited gap coverage, including 76 percent with nothing and an additional 6 percent with fewer than 10 percent of drugs on their formulary coverage. ↩︎
- J. Hoadley, et al. “To Switch or Not to Switch: Are Medicare Beneficiaries Switching Drug Plans to Save Money?” Kaiser Family Foundation, October 10, 2013. ↩︎