Medicare And Medicaid At 50
Introduction
Medicare and Medicaid were signed into law by President Lyndon Johnson on July 30, 1965 in a bipartisan effort to provide health insurance coverage for low-income, disabled, and elderly Americans. In their 50 year history, each of these programs has come to play a key role in providing health coverage to millions of Americans today and make up a significant component of federal and state budgets. Medicare, a federal government program, provides health insurance coverage for Americans age 65 and older, regardless of income, as well as those under age 65 with permanent disabilities. Medicaid provides coverage for medical care and long-term care services to low-income people and is jointly financed by federal and state governments, with each state deciding how to structure benefits, eligibility, and care delivery within guidelines set by the federal government. Medicaid is also one of the primary ways the Affordable Care Act expanded coverage to millions more low-income, uninsured adults. Today, both programs cover 111 million Americans and cost an estimated $1,035 billion this year.1
Over the past five decades, both programs have adapted to a changing health care landscape. As major programs both in size and scope, their role and the ways in which they operate are often debated by policymakers and the public alike. While the public generally values these programs, policymakers are faced with budget constraints as well as competing priorities and interests, and as a result, there are often debates about the effectiveness of the programs and the directions they should take. As the programs reach their 50th year, the Kaiser Family Foundation conducted a nationally representative survey of Americans to explore the public’s views of these programs, their experiences as beneficiaries, and their opinions on proposals for future changes.
Section 1: Views Of The Importance Of Medicare And Medicaid
Most View Medicare And Medicaid As Very Important Programs
Medicare and Medicaid are viewed by the public as important government programs. More than three-quarters (77 percent) say Medicare is a very important program, ranking just below Social Security (83 percent) and similar to the shares who say federal aid to public schools (75 percent), and the defense and military (73 percent) are very important. More than six in ten (63 percent) say Medicaid is very important, about the same as loans for college students (64 percent). Surveys dating back to 1999 have found that similar shares over time express the importance of Medicare and Medicaid as government programs.2
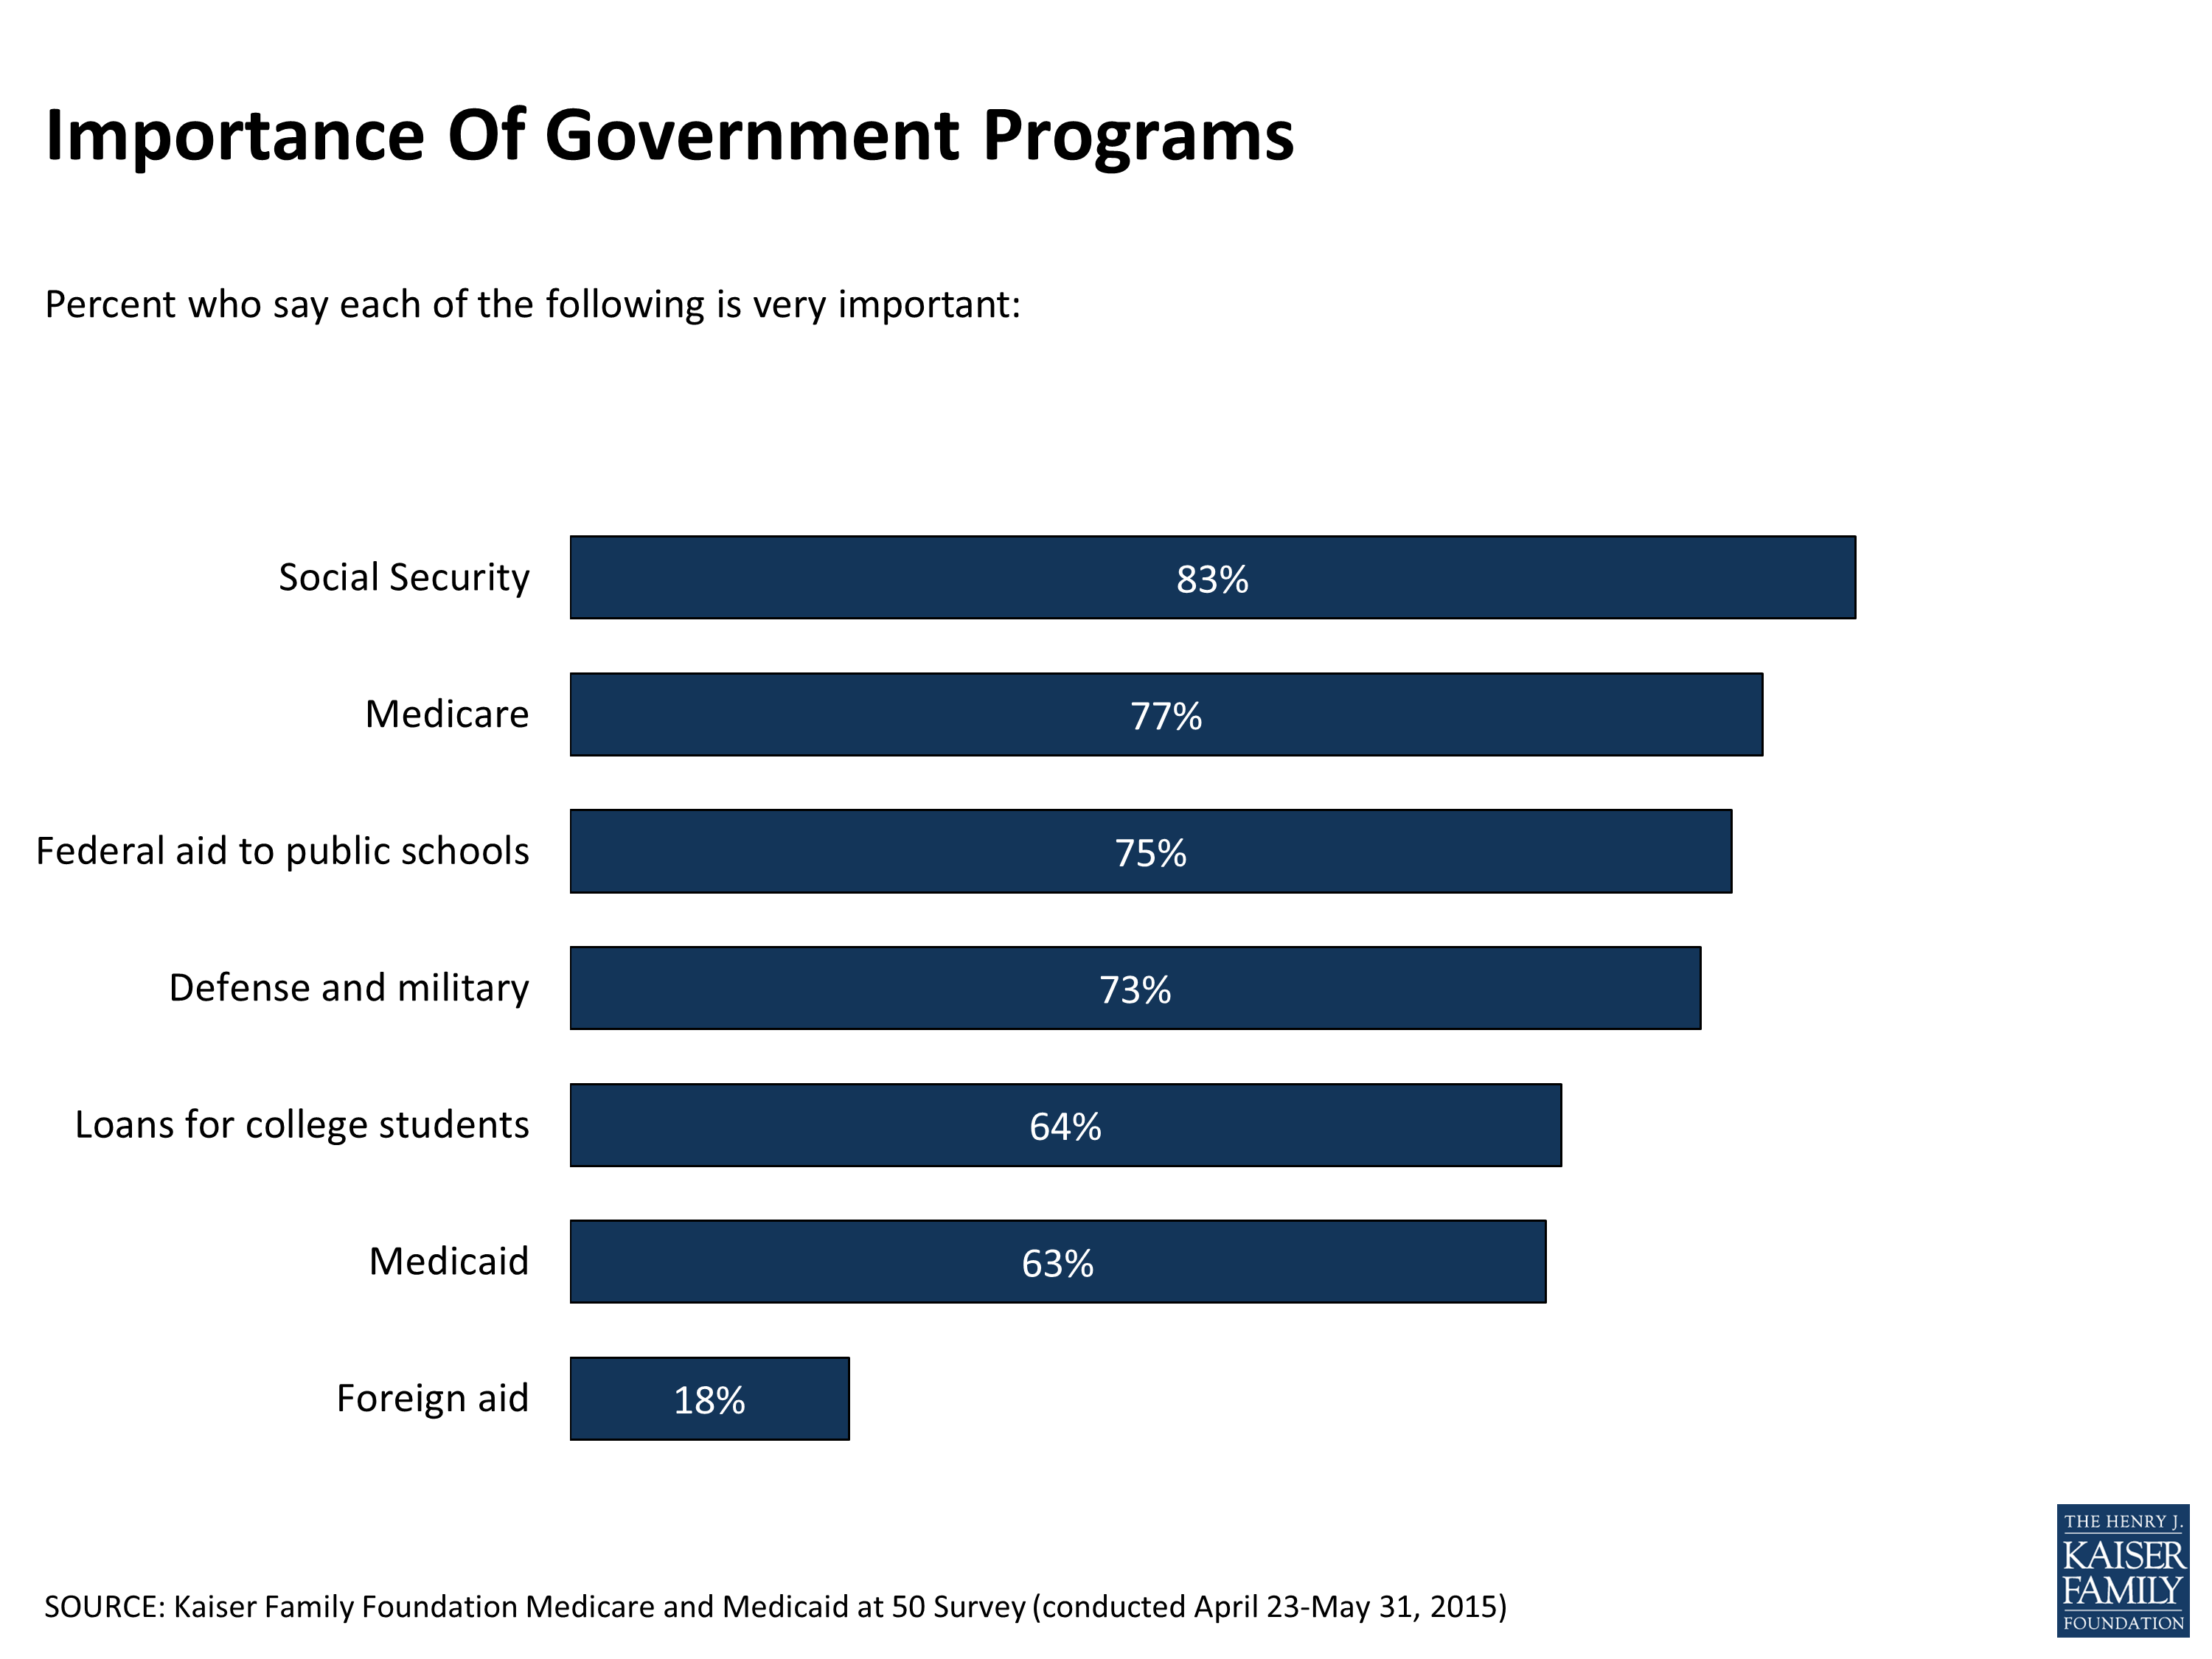
Figure 1
Although these programs are popular with large segments of the public, as large government-financed programs, this survey finds some partisan divisions in views about Medicare and Medicaid. About seven in ten Republicans and independents and about nine in ten Democrats say the Medicare program is very important. Among people ages 65 and older, virtually all of whom are covered by Medicare, support is broad across party lines, with 85 percent of Republicans, 89 percent of independents, and 92 percent of Democrats saying the program is very important. Views of Medicaid are somewhat more divided. Majorities of Democrats (78 percent) and independents (62 percent) feel the program is very important, while less than half of Republicans (47 percent) say the same.
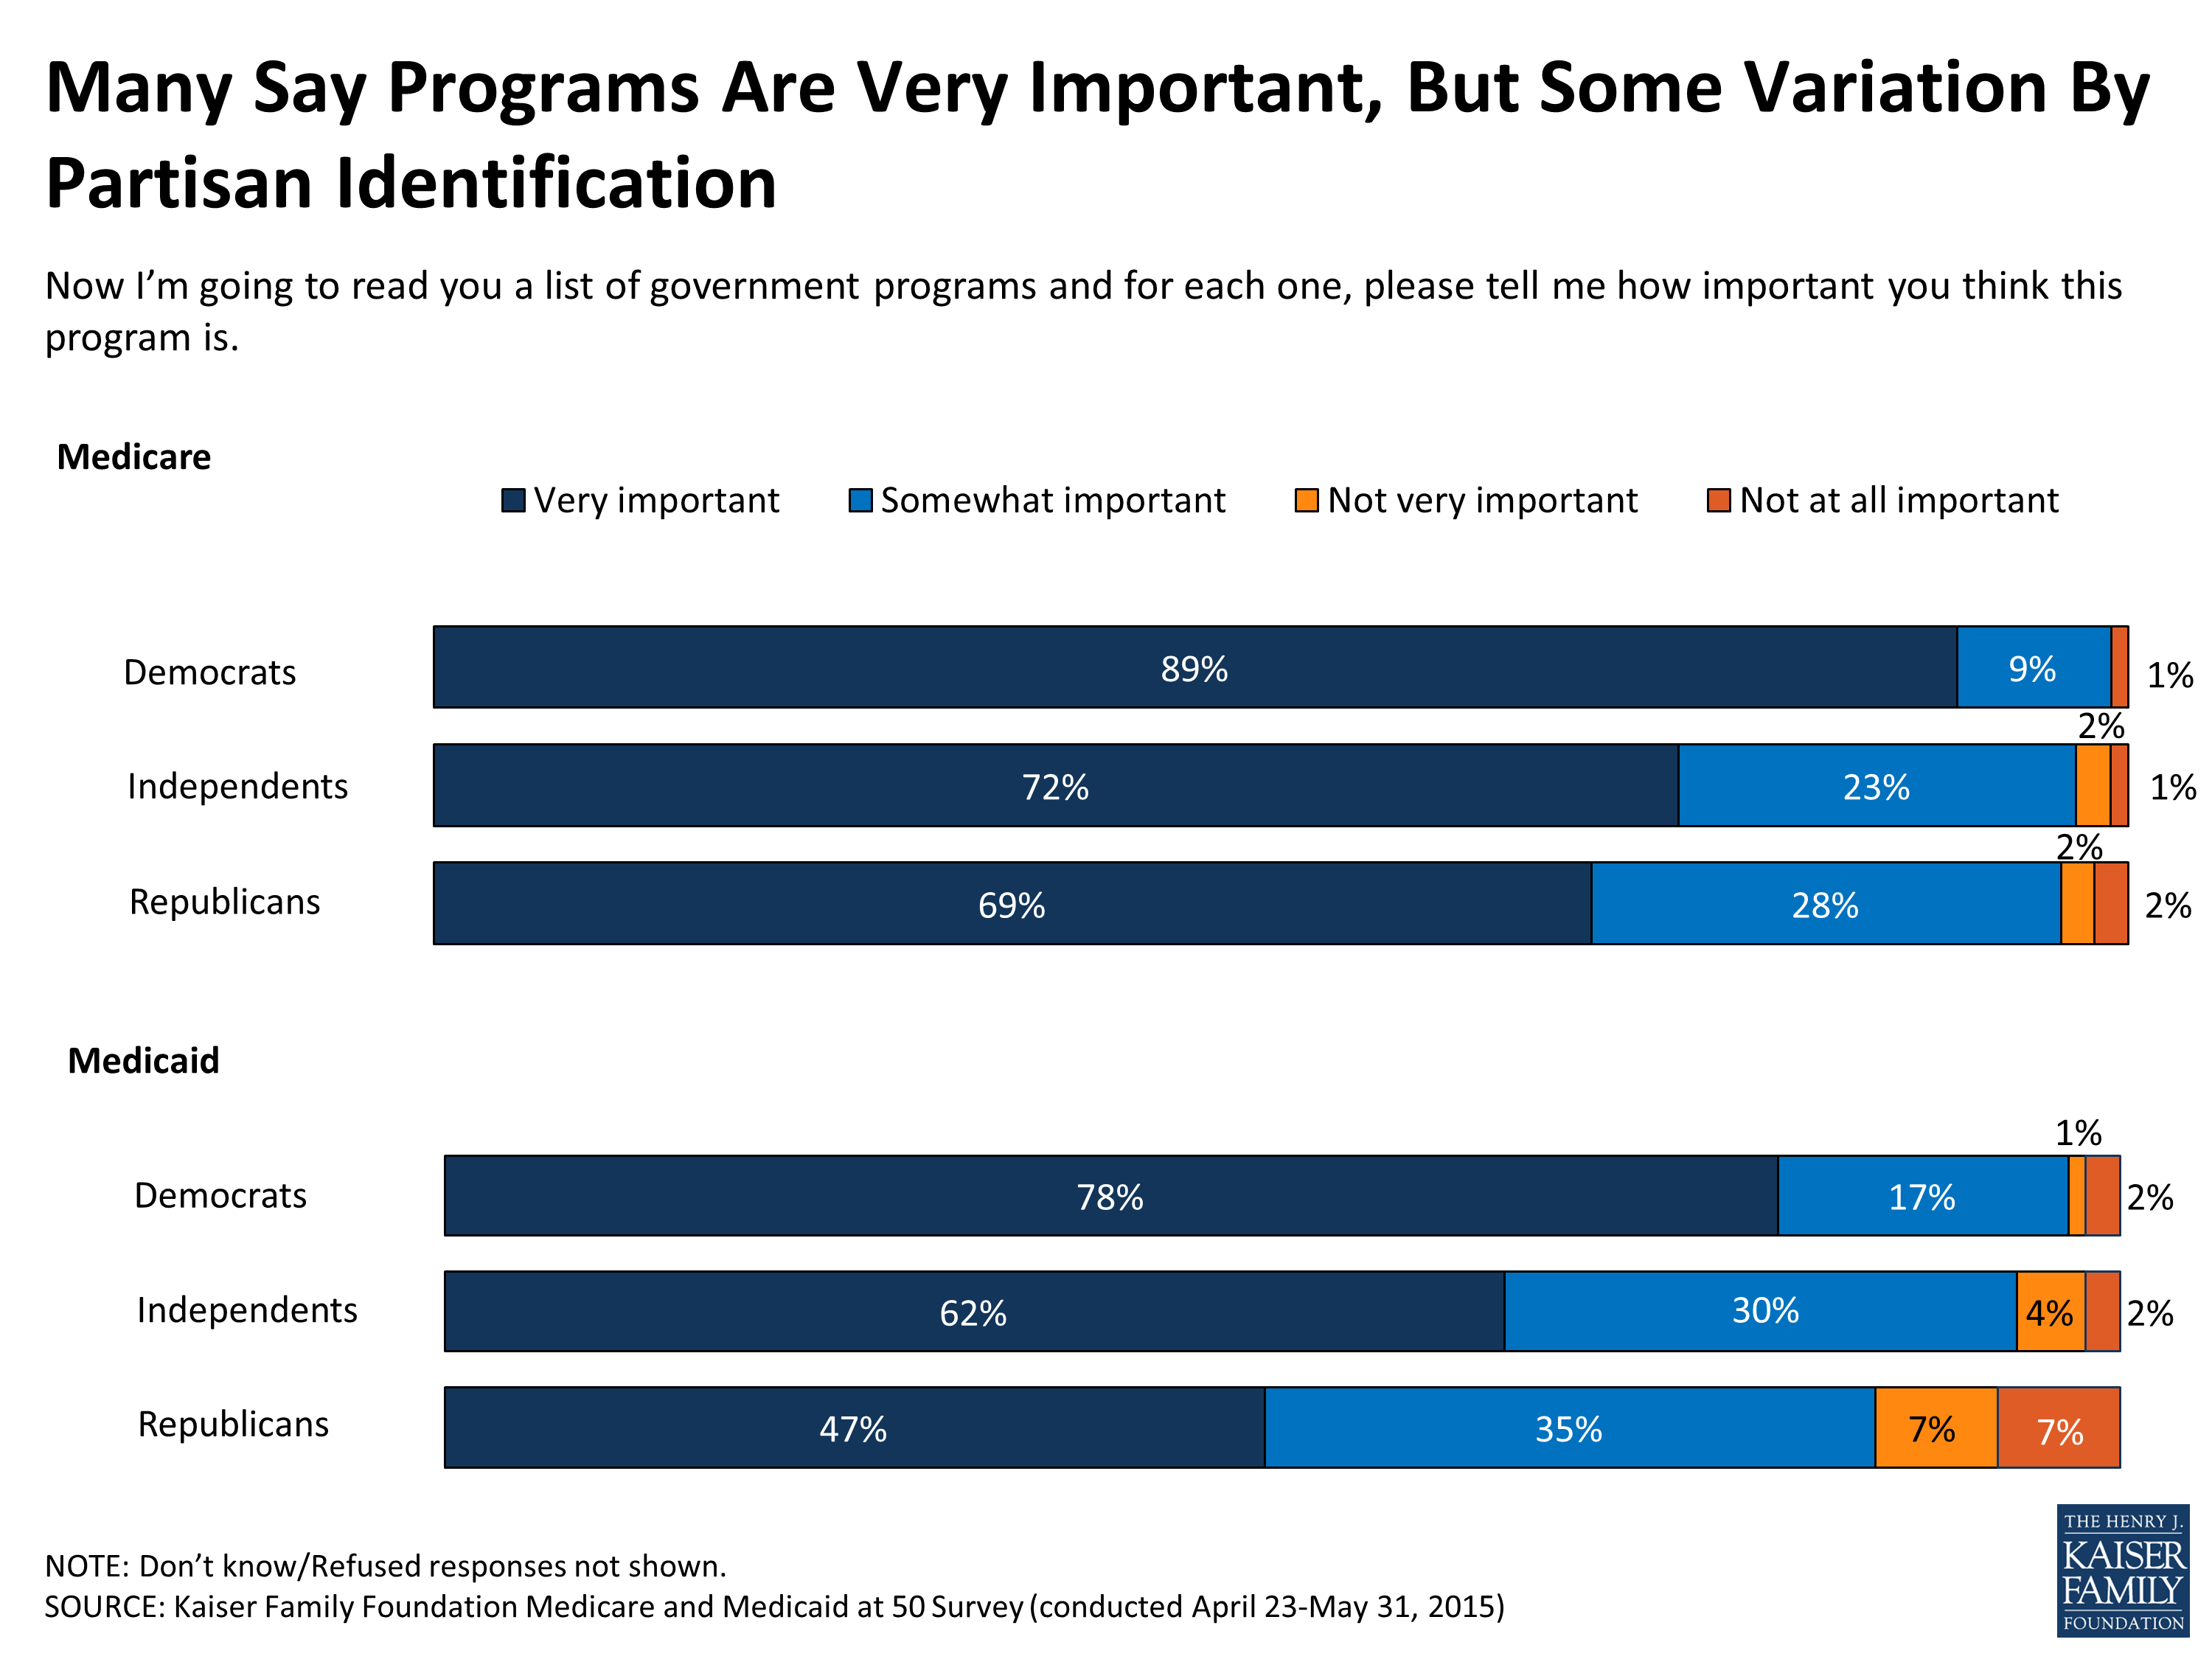
Figure 2
Despite the fairly pervasive view that these programs are “very important”, the public is ambivalent about the role of the federal government in making the health care system work well. Even among the majorities of the public who says Medicare and Medicaid are very important programs, over four in ten say the federal or state governments should have no role or only a minor role in the health care system. And, among those who say Medicare and Medicaid are not very important government programs, more than three in ten say that the federal government should have no role in the health care system at all, and roughly another third say the role should be minor. Similar shares see no role or only a minor role for state governments in health care.
| Importance As Government Programs | |||||||
| Total | Medicare | Medicaid | |||||
| Very important government program (77%) | Not very important government program (21%) | Very important government program (63%) | Not very important government program (34%) | ||||
| When it comes to making the health care system in America work well, do you think the Federal government should play a major role, a minor role or no role? | |||||||
| Major role | 47% | 52% | 27% | 57% | 28% | ||
| Minor role | 31 | 30 | 36 | 28 | 39 | ||
| No role | 20 | 15 | 36 | 13 | 31 | ||
| When it comes to making the health care system work well, do you think state governments should play a major role, a minor role or no role? | |||||||
| Major role | 47 | 51 | 32 | 54 | 34 | ||
| Minor role | 39 | 37 | 48 | 35 | 47 | ||
| No role | 12 | 10 | 20 | 8 | 19 | ||
| NOTE: Don’t know and Refused responses not shown. | |||||||
Most Say Programs Are Working Well
In terms of the public’s perceptions of how well the Medicare and Medicaid programs are working, most Americans (60 percent) say Medicare is working well for most seniors and half (50 percent) say Medicaid is working well for most low-income people covered by the program, although about three in ten say the programs are not working well. Those currently covered by each program are more likely to say they are working well, including three-quarters of people covered by Medicare (75 percent) and about two-thirds of those currently covered by Medicaid (65 percent).3 While most of those covered by the programs say they are working well, views of the programs may be informed by their own personal experience with their health coverage. Those who say they have experienced a variety of problems – such as difficulty affording health care or having had to delay or forego medical care because of the cost – are more likely than those who haven’t reported such problems to say Medicare and Medicaid are not working well (see Section 4 for more details).
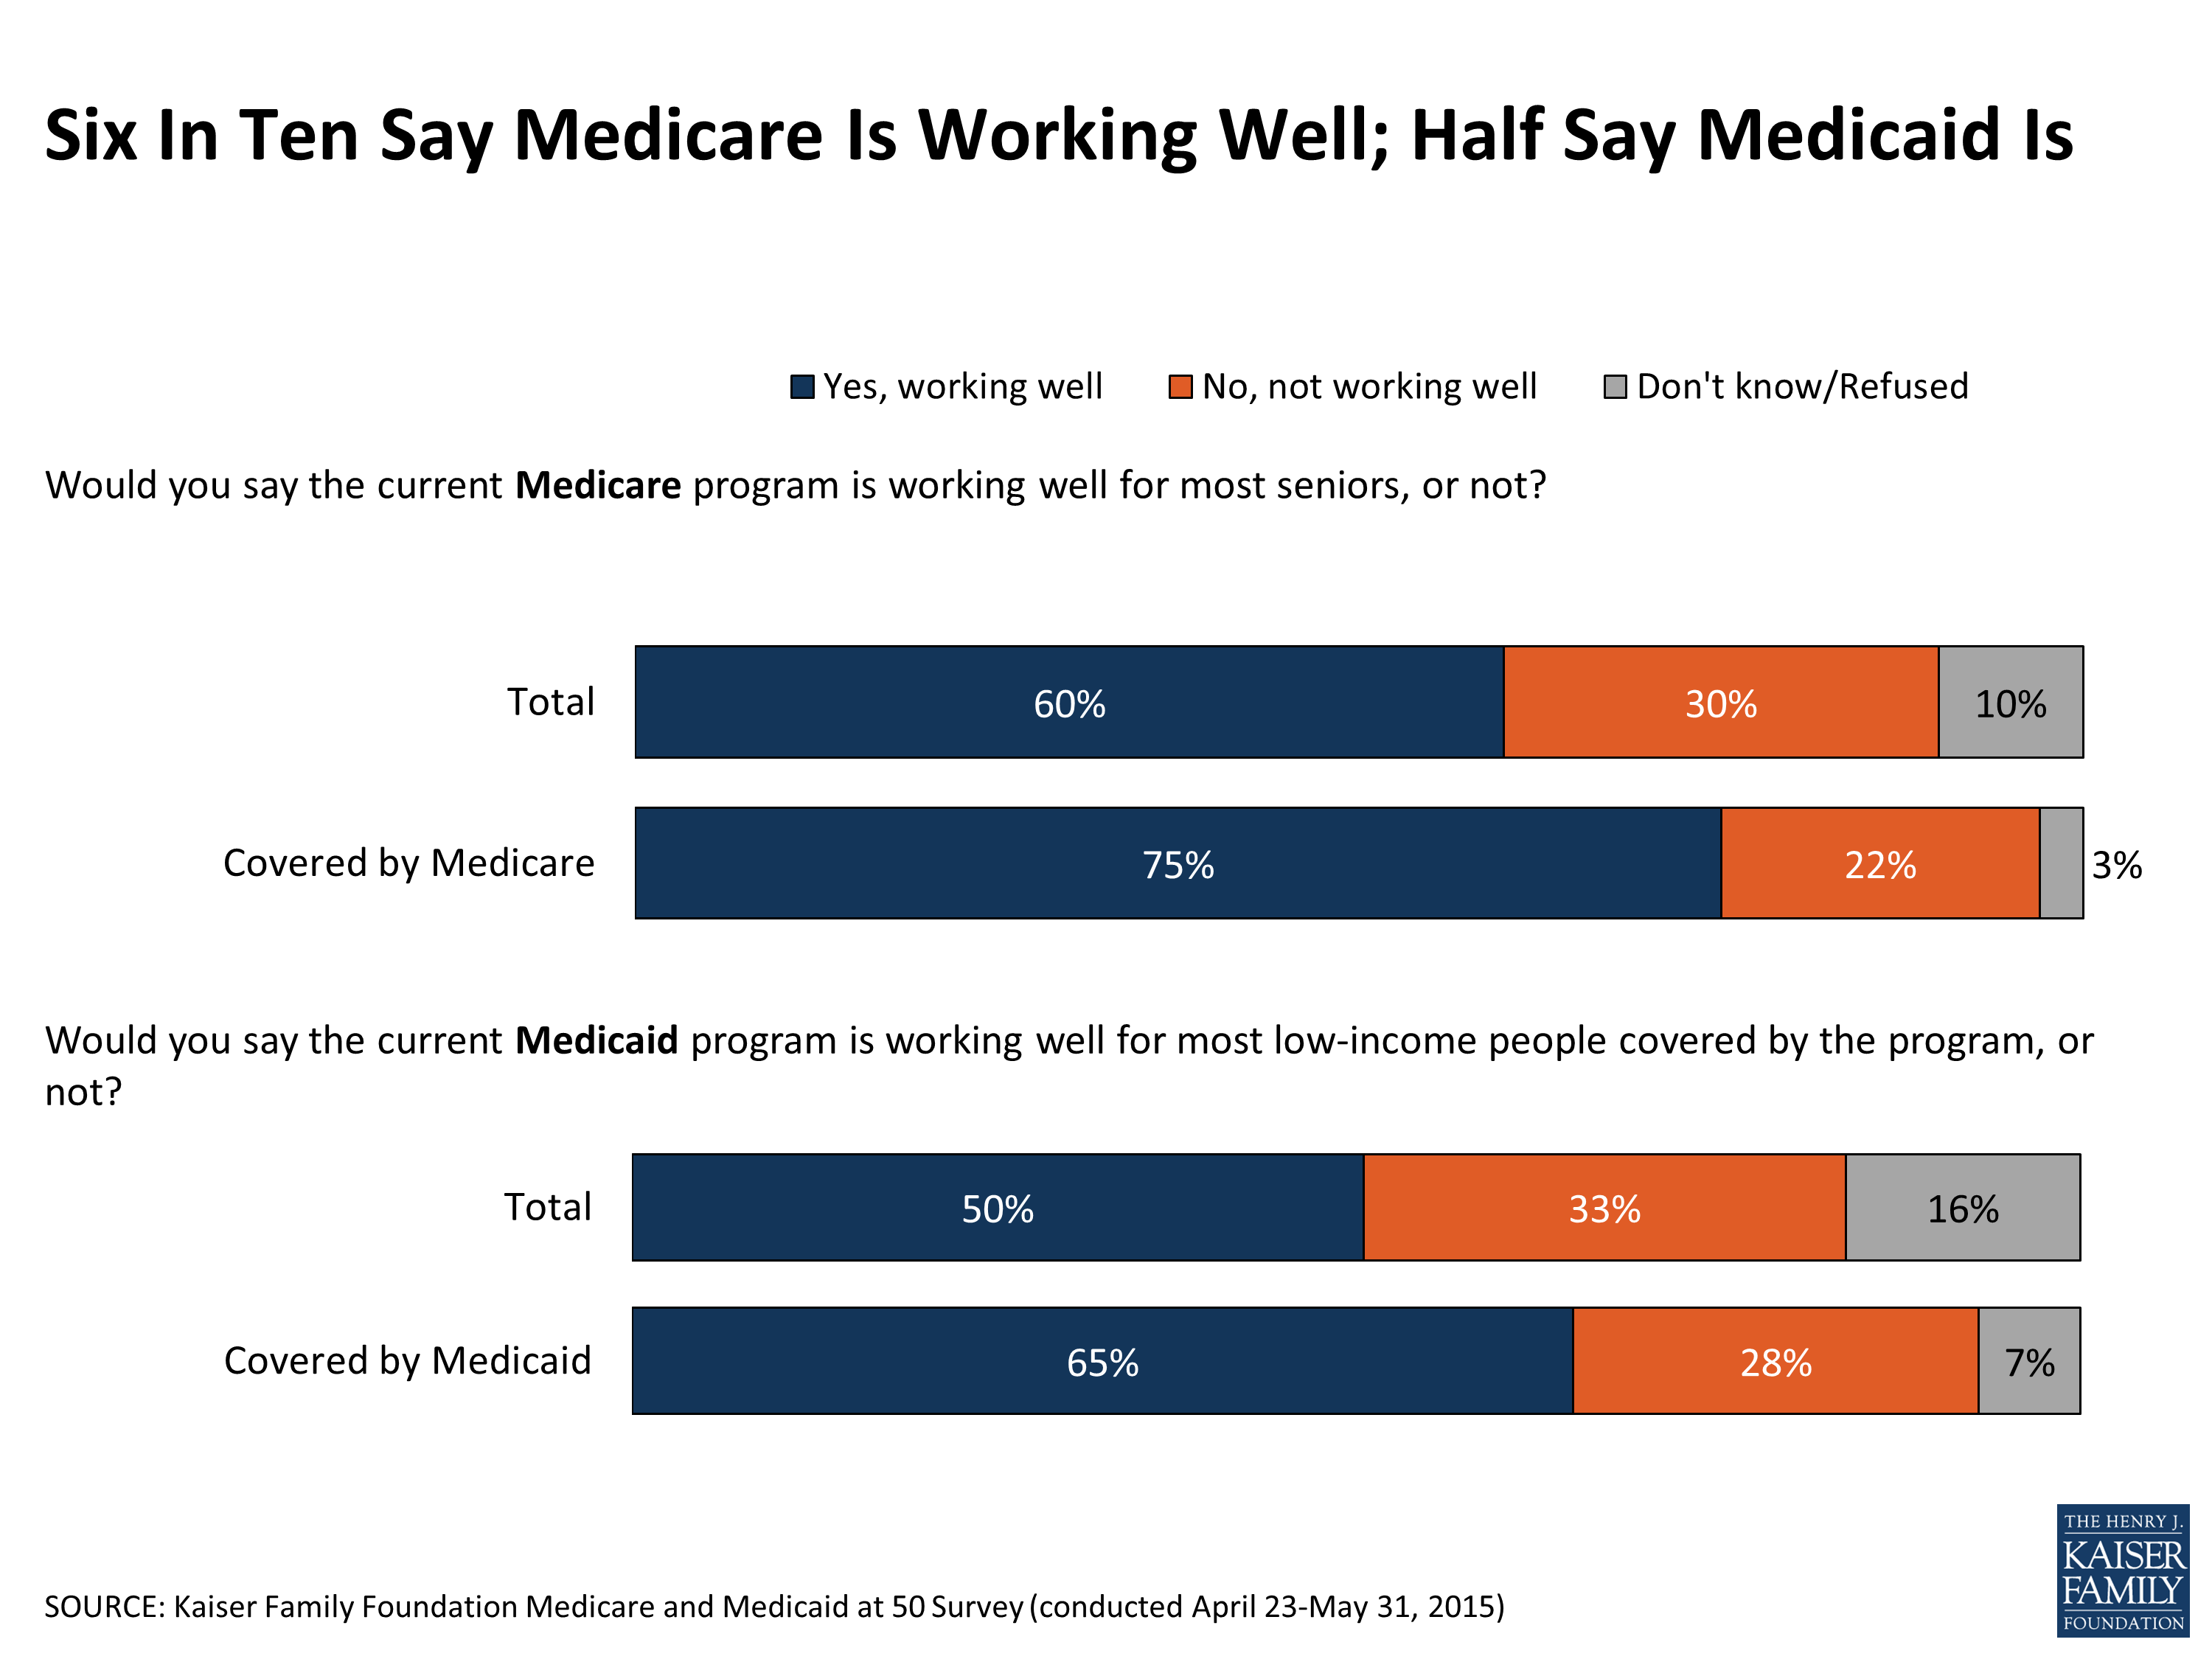
Figure 3
Large Shares Say Programs Are Personally Important
Many Americans say that the programs are important to them personally, including three-quarters (76 percent) overall who cite Medicare as important to them and their family and about half (51 percent) who say the same for Medicaid. Democrats are more likely than Republicans and independents to say Medicare is personally important to them, but still about seven in ten Republicans say the program is personally important. There is more variation across parties on the personal importance of Medicaid. Six in ten Democrats (61 percent) say Medicaid is personally important to them, in contrast with about the same share of Republicans (63 percent) who say the opposite. Independents fall in the middle with 53 percent saying the program is personally important and 46 percent saying it is not.
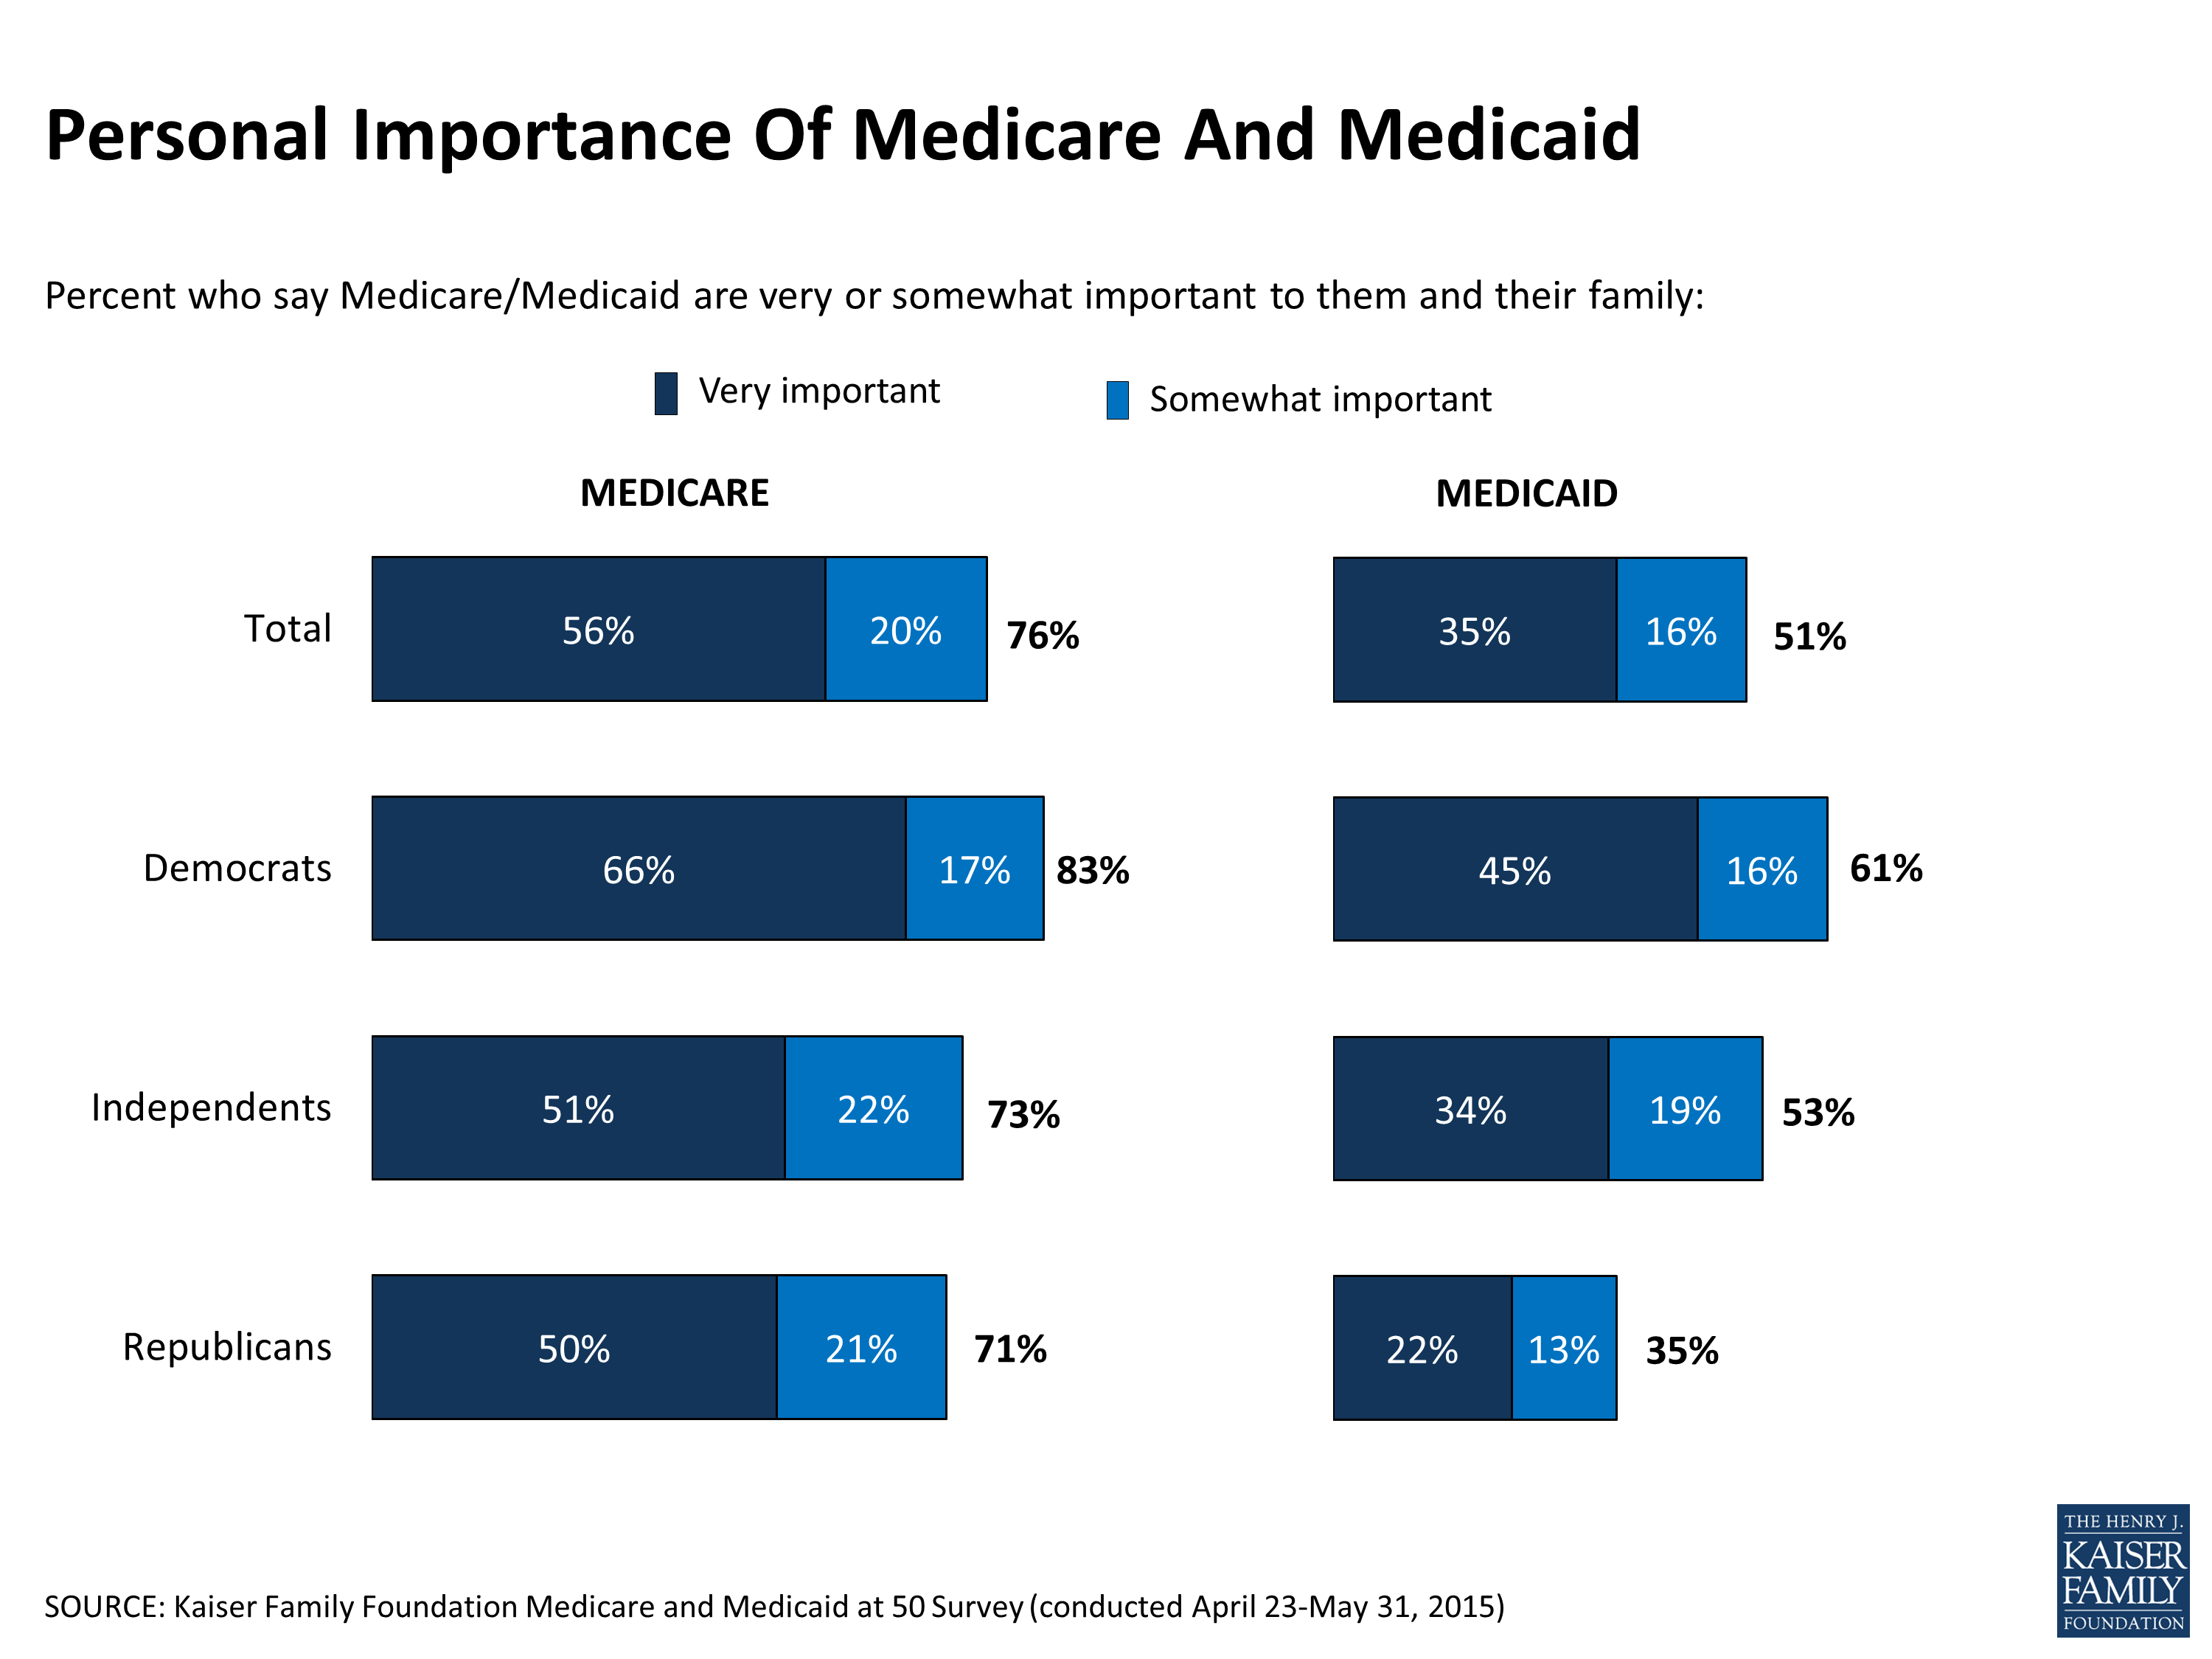
Figure 4
When asked why Medicare is important to them, over nine in ten say they like knowing the program exists for seniors and younger adults with long-term disabilities (94 percent), and that either they, or someone else in their family, may need Medicare benefits in the future (93 percent). A large majority also say it is important to them because they or someone they know has received health care paid for by Medicare (80 percent).
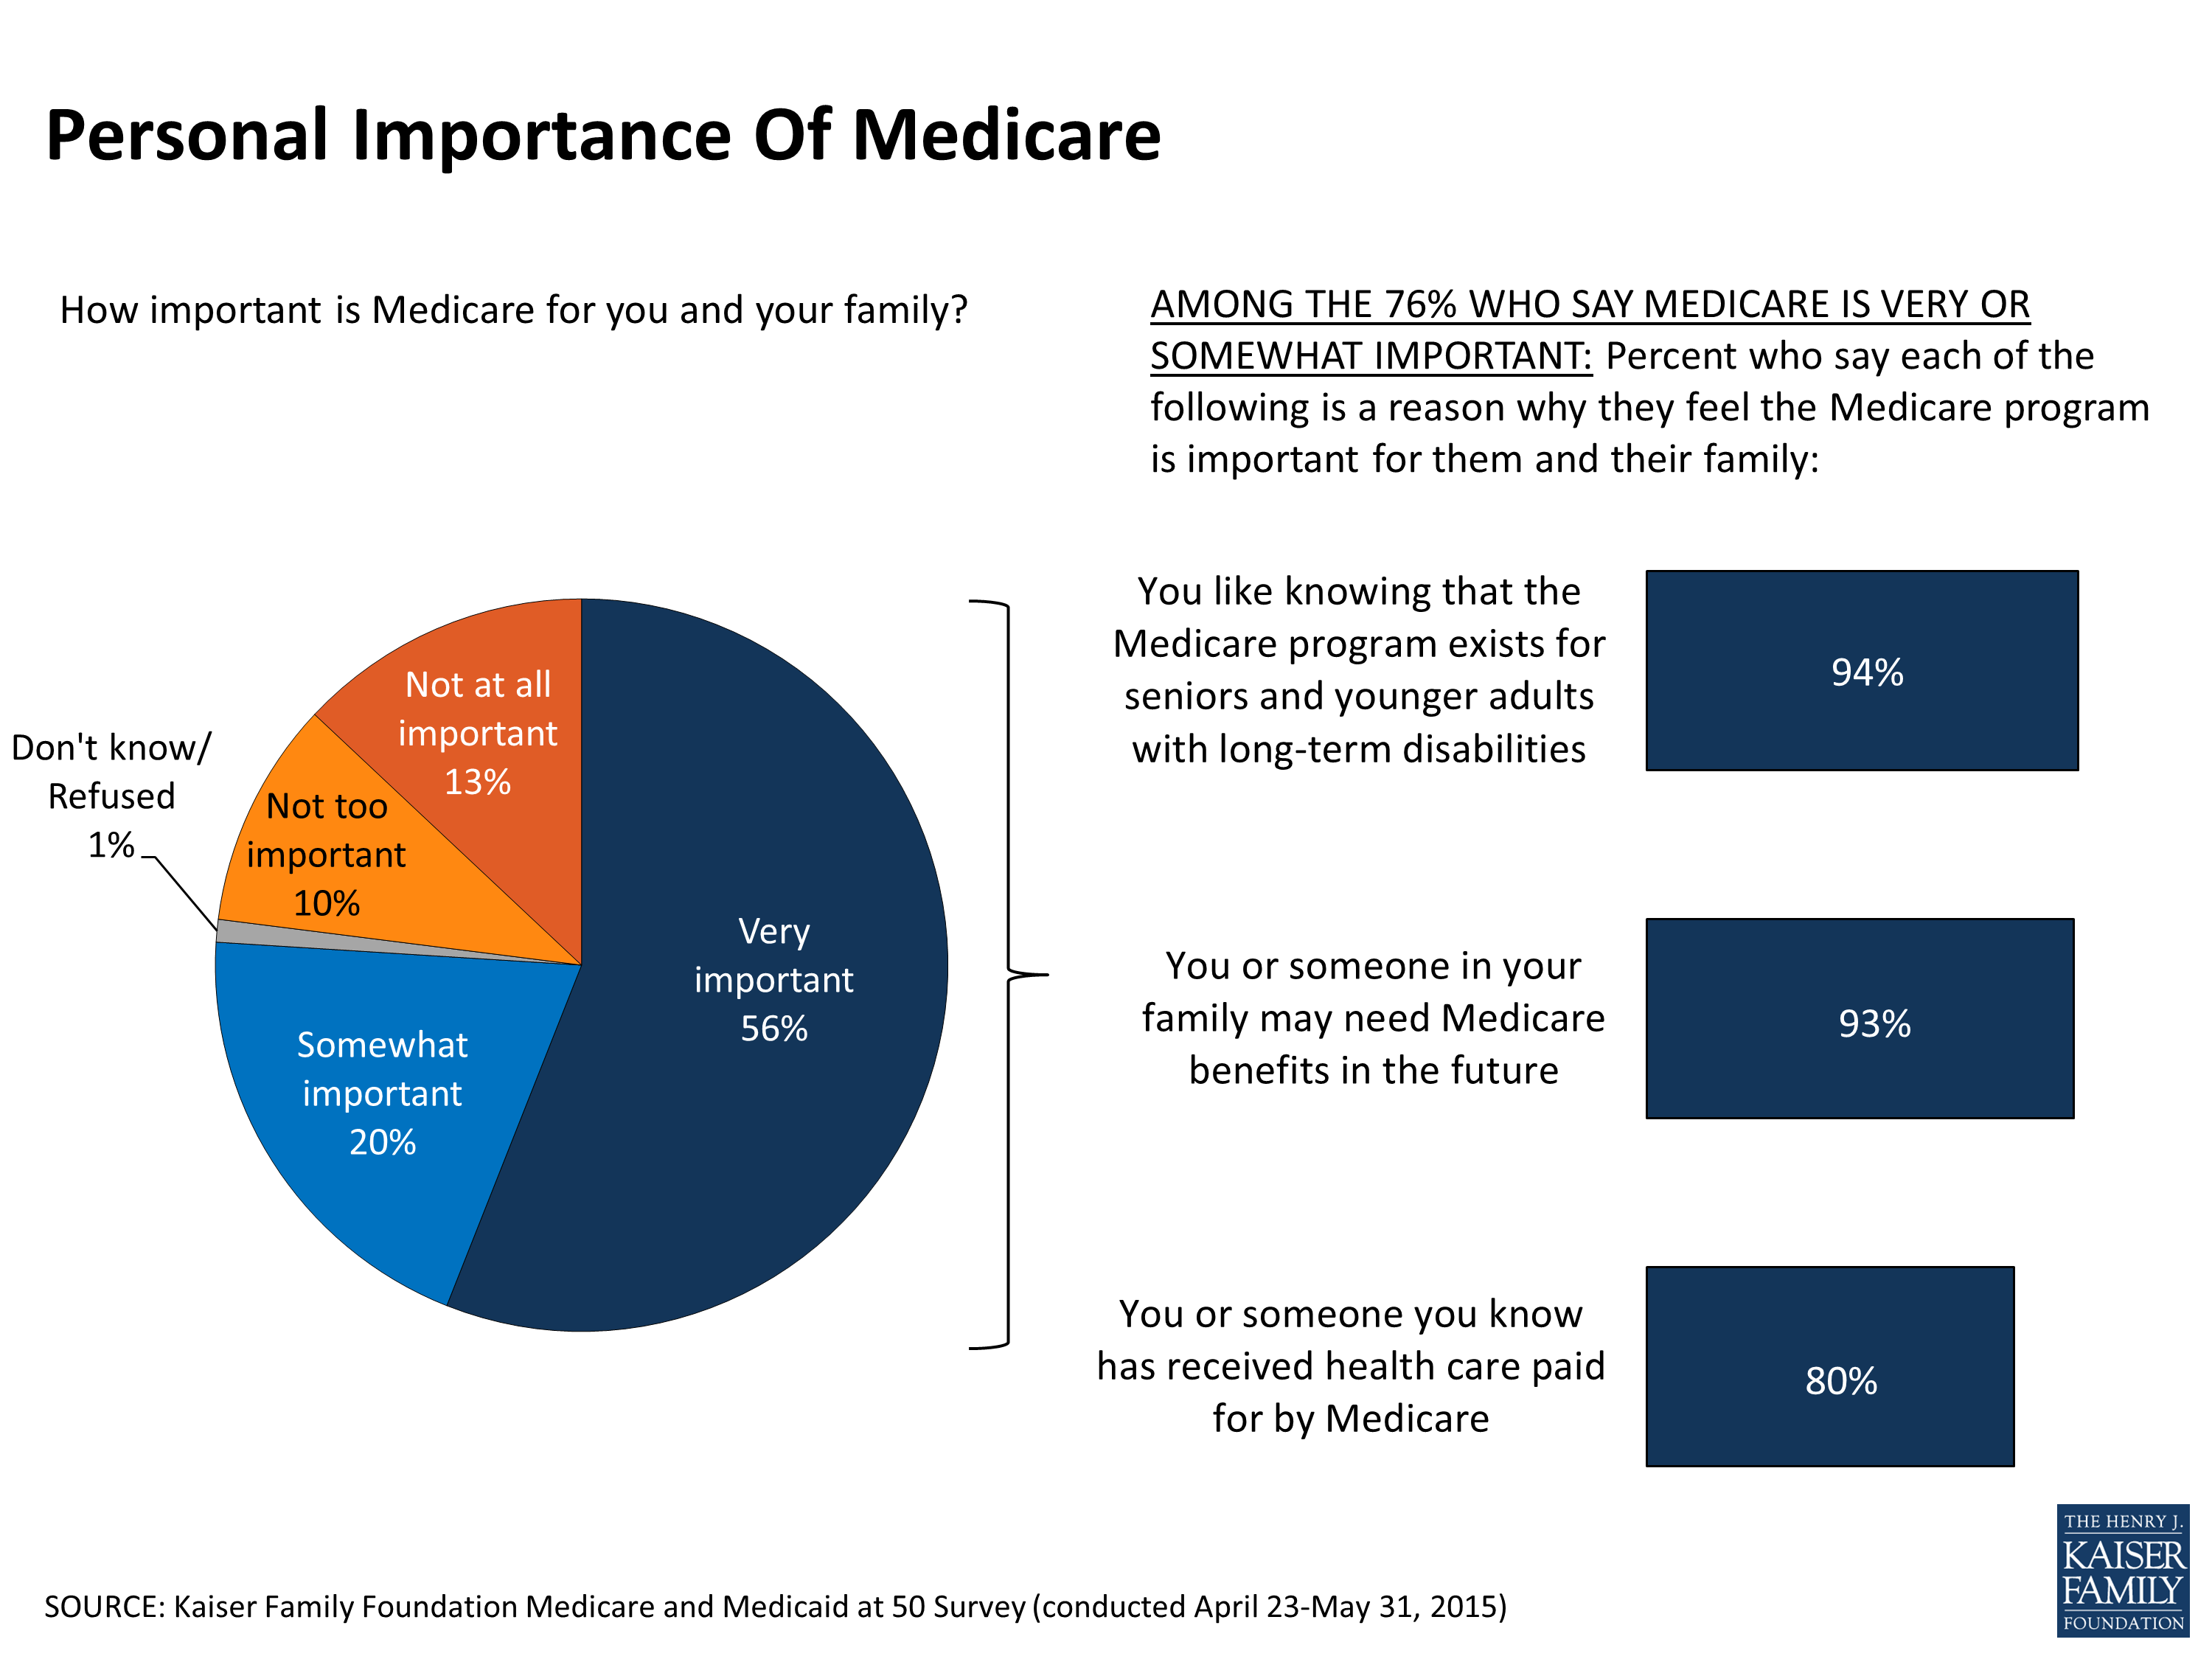
Figure 5
Reasons for Medicaid’s importance are similar, with roughly nine in ten saying they like knowing the program protects low-income people who cannot afford needed medical care (93 percent) or they or a family member may need the benefits in the future (89 percent). Three-quarters (74 percent) also say it is important to them because they have personal experience with the program and about half (52 percent) say Medicaid is personally important because it has helped them or someone they know pay for long-term care services.
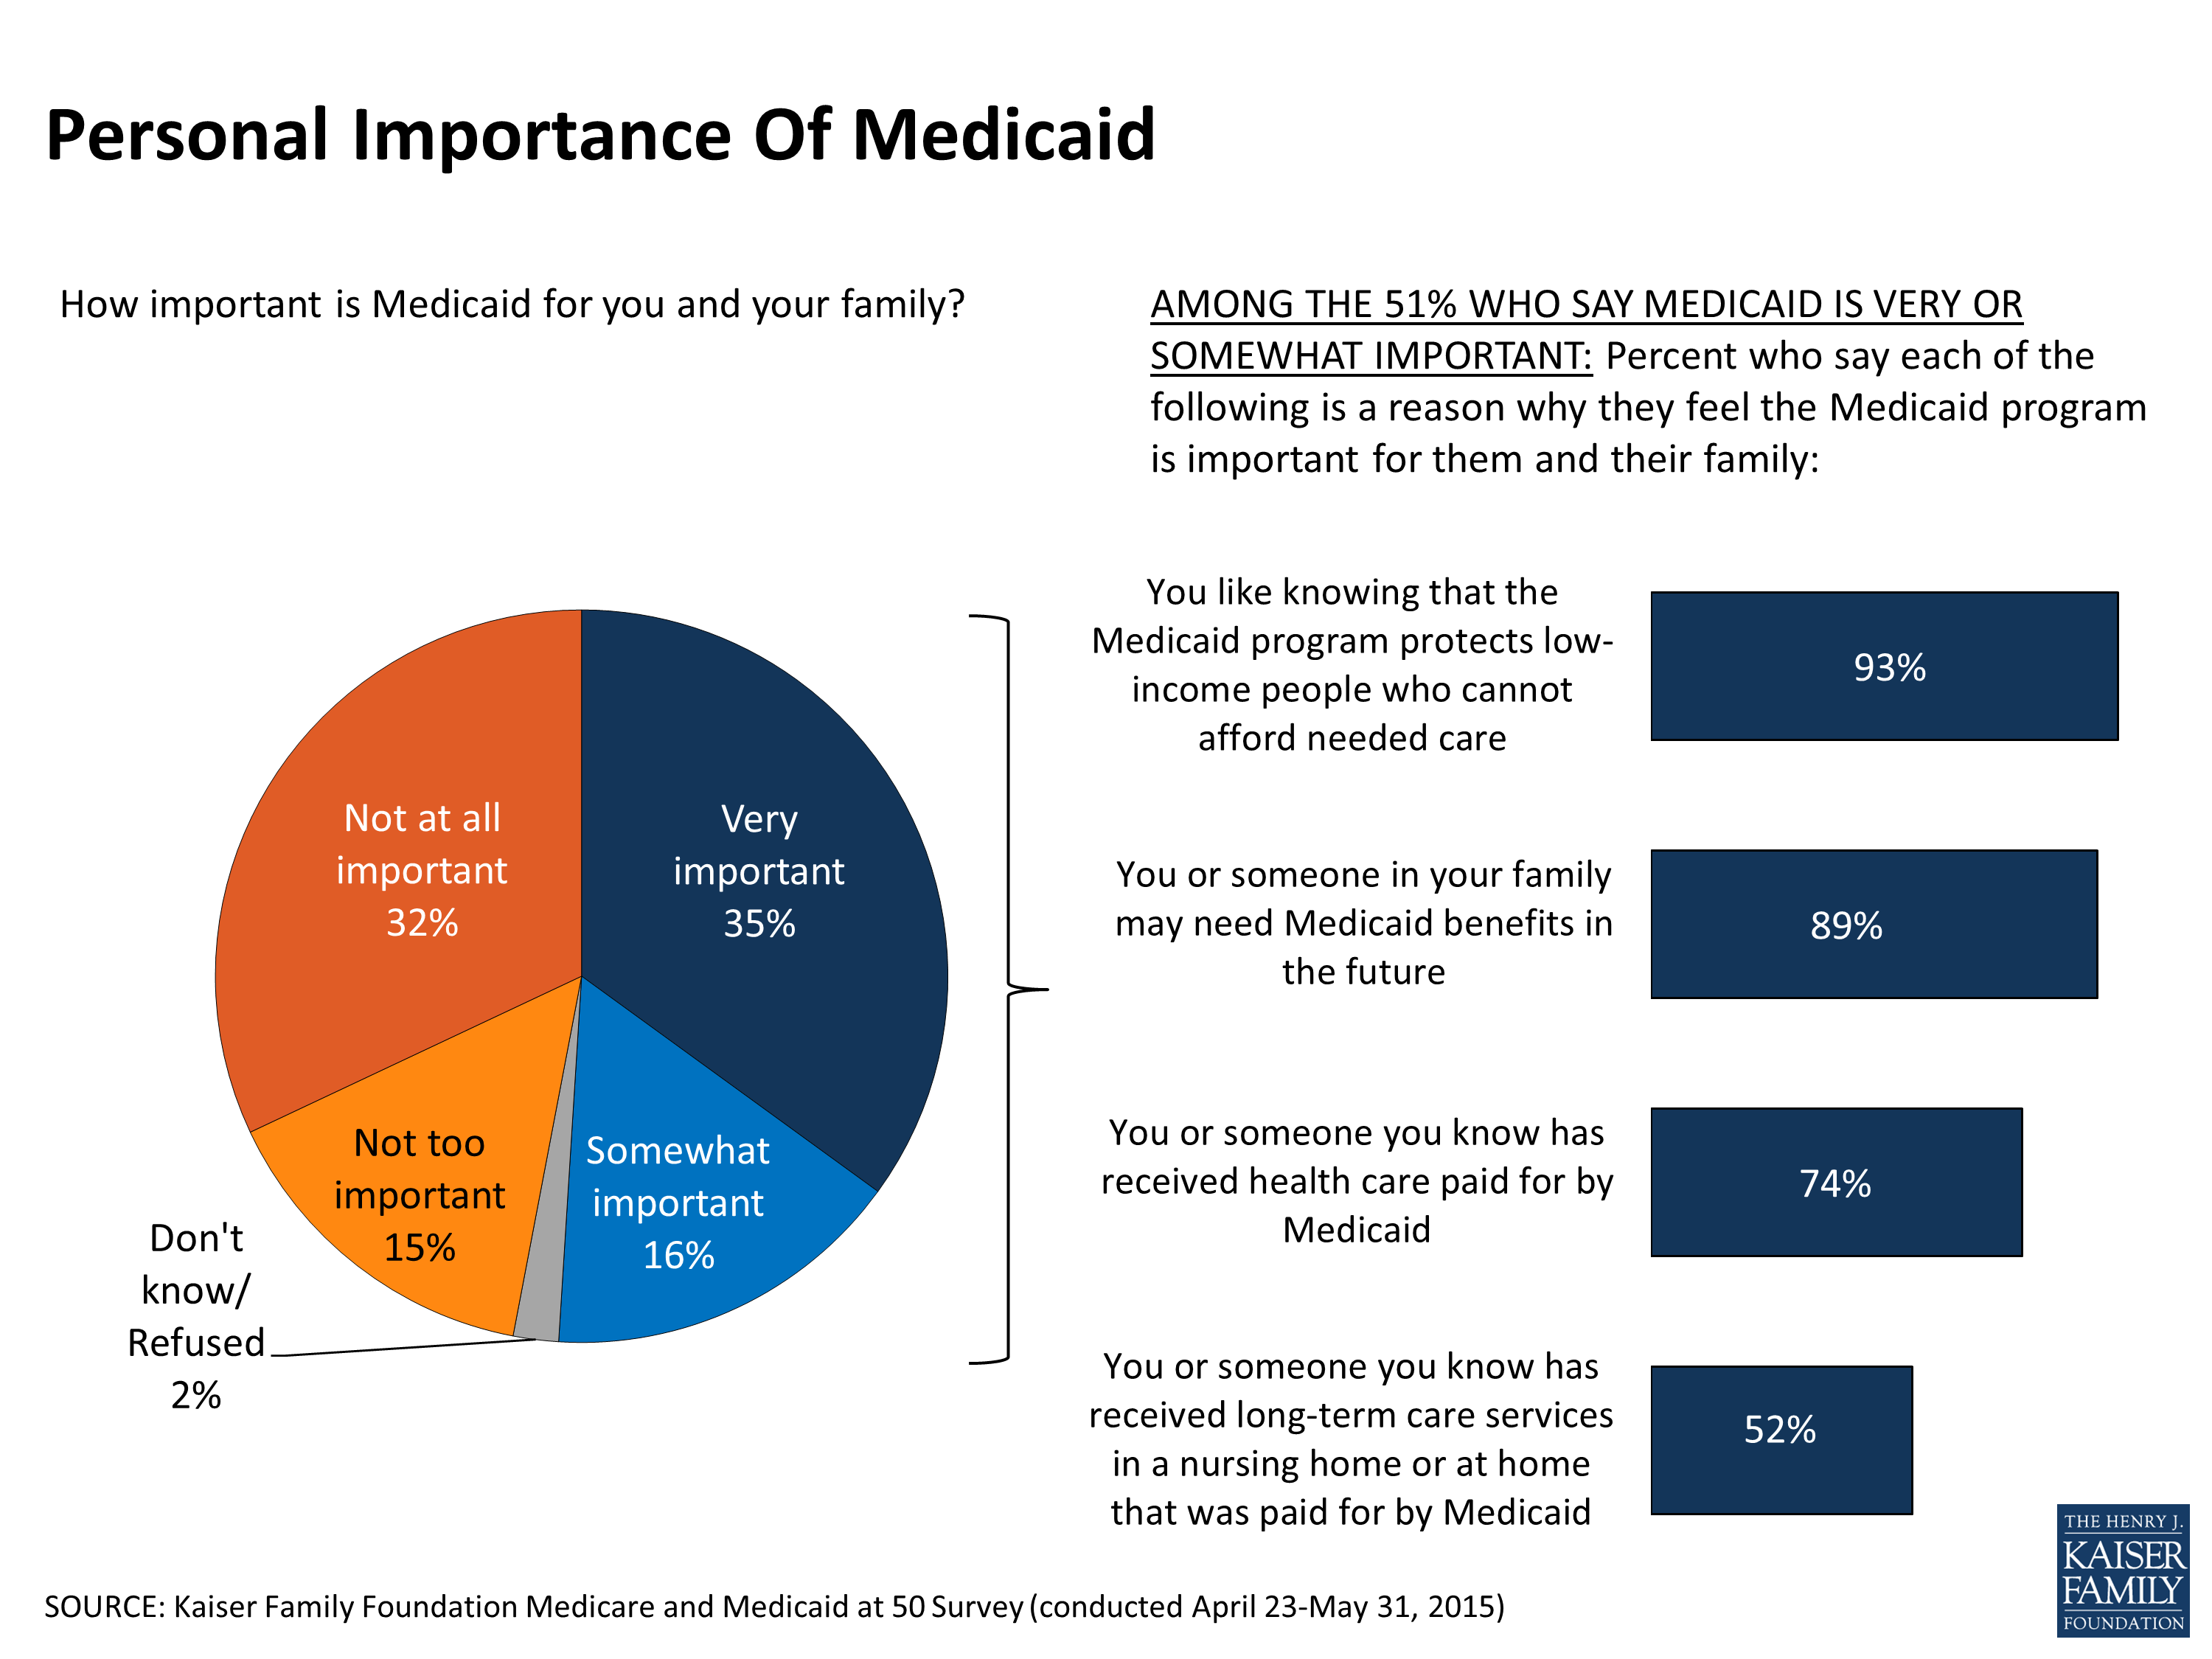
Figure 6
Medicare And Medicaid Impact A Large Share Of Americans
Over the past five decades, Medicare and Medicaid have become woven into the fabric of American life both politically and personally due to the large numbers of people the programs cover. Medicare’s impact is far-reaching and nearly universal, as most Americans are either covered by the program themselves, know someone in their family who is covered, or will be covered at some point in their lives. Although its impact is perhaps less well known, this survey finds that Medicaid also impacts large shares of Americans across the country.
Overall, nearly two-thirds of Americans (64 percent) report some connection with the Medicaid program, either because they personally have received some assistance from Medicaid (27 percent), or they have close friends or family who have (37 percent).
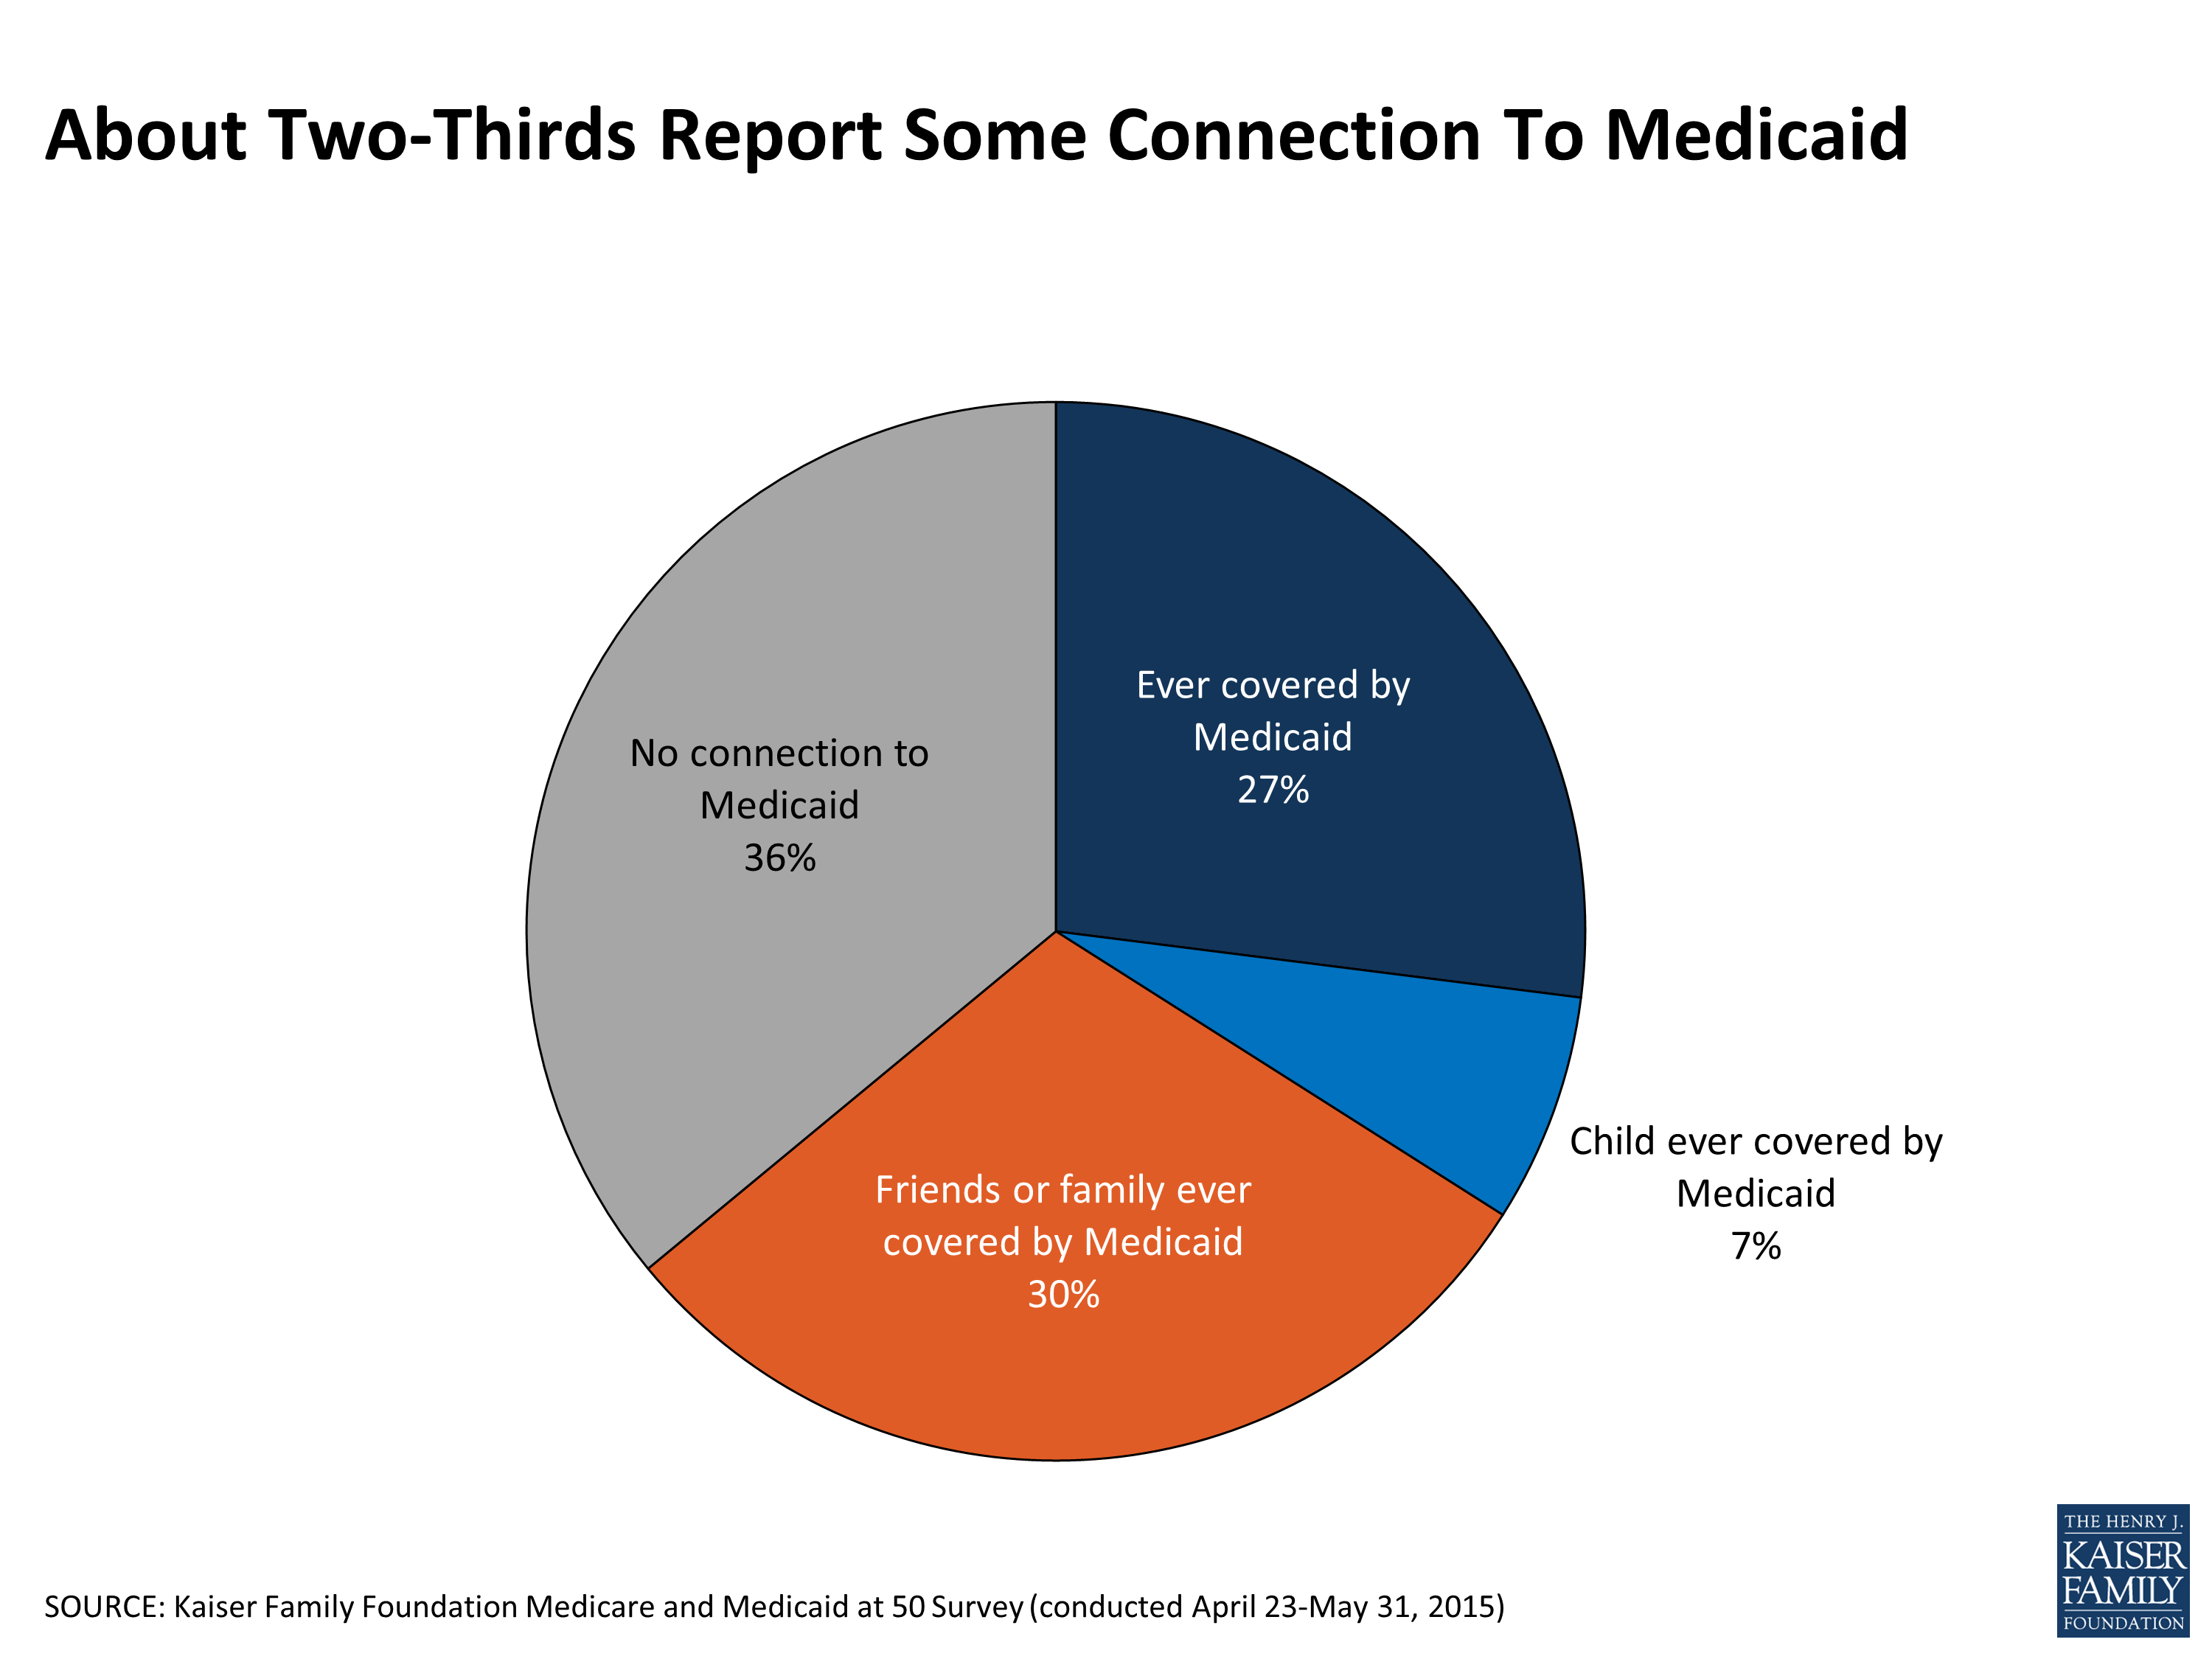
Figure 7
Personal Characteristics Tied To Opinion Of Programs
While many feel these programs are important nationally or on a personal level, high levels of support are not entirely universal. Those who are more likely to say the programs are not important are those often less affected by the programs. Roughly three in ten with coverage through an employer say Medicare is not a very important government program (29 percent) or is not personally important (35 percent), compared to fewer than one in ten covered by Medicare (9 percent and 4 percent, respectively). As a program for nearly all adults 65 and older, younger people under age 65 are more likely than seniors to say it is not a very important government program (25 percent versus 11 percent) and that it’s not personally important to them (28 percent versus 7 percent). In addition, roughly three in ten people who report higher incomes or higher levels of education say Medicare is not a very important government program or is not personally important, compared to fewer than one in five of those with lower levels of income or education (See Appendix Table 1 for more details).
Similarly, those who do not see Medicaid as important are also generally those with little experience with the program. Those who report no personal experience with the program, those covered through an employer, and those with higher incomes are more likely to say Medicaid is not a very important government program by more than 15 percentage points. These differences are even greater for views of the program’s personal importance. At least six in ten of those who have never personally been covered by the program, have coverage through an employer, or report higher levels of income say that Medicaid is not personally important to them, compared to 16 percent of those who have ever been covered by the program, 5 percent of those currently covered by the program, and about a quarter of those with low incomes. Additionally, those who say they have better health or higher levels of education are also more likely to say that Medicaid is not important personally (See Appendix Table 2 for more details).
There are fewer differences across demographic groups in terms of how well the programs are working for those they serve. Although many say the programs are working well, those under age 65 are more likely than seniors to say either program is not working well (33 percent versus 18 percent for Medicare, 35 percent versus 27 percent for Medicaid). Republicans and independents (32 percent each) are more likely than Democrats (24 percent) to say Medicare isn’t working well; however, there is no partisan difference in perceptions of how well Medicaid is working. (See Appendix Tables 1 and 2 for more details).
The Vast Majority Say They Would Enroll In Medicaid If They Needed To
The survey finds little evidence that stigma is a major barrier to signing up for Medicaid. When presented with a hypothetical situation of being uninsured and needing medical care, a large majority (85 percent) of those not currently enrolled in Medicaid say they would enroll in the program. A similar share (88 percent) say that they would enroll an eligible child in Medicaid if needed. Still, roughly one in ten say they would not enroll themselves or a child on Medicaid, a share that increases to about 1 in 6 of those with no connection to the program.
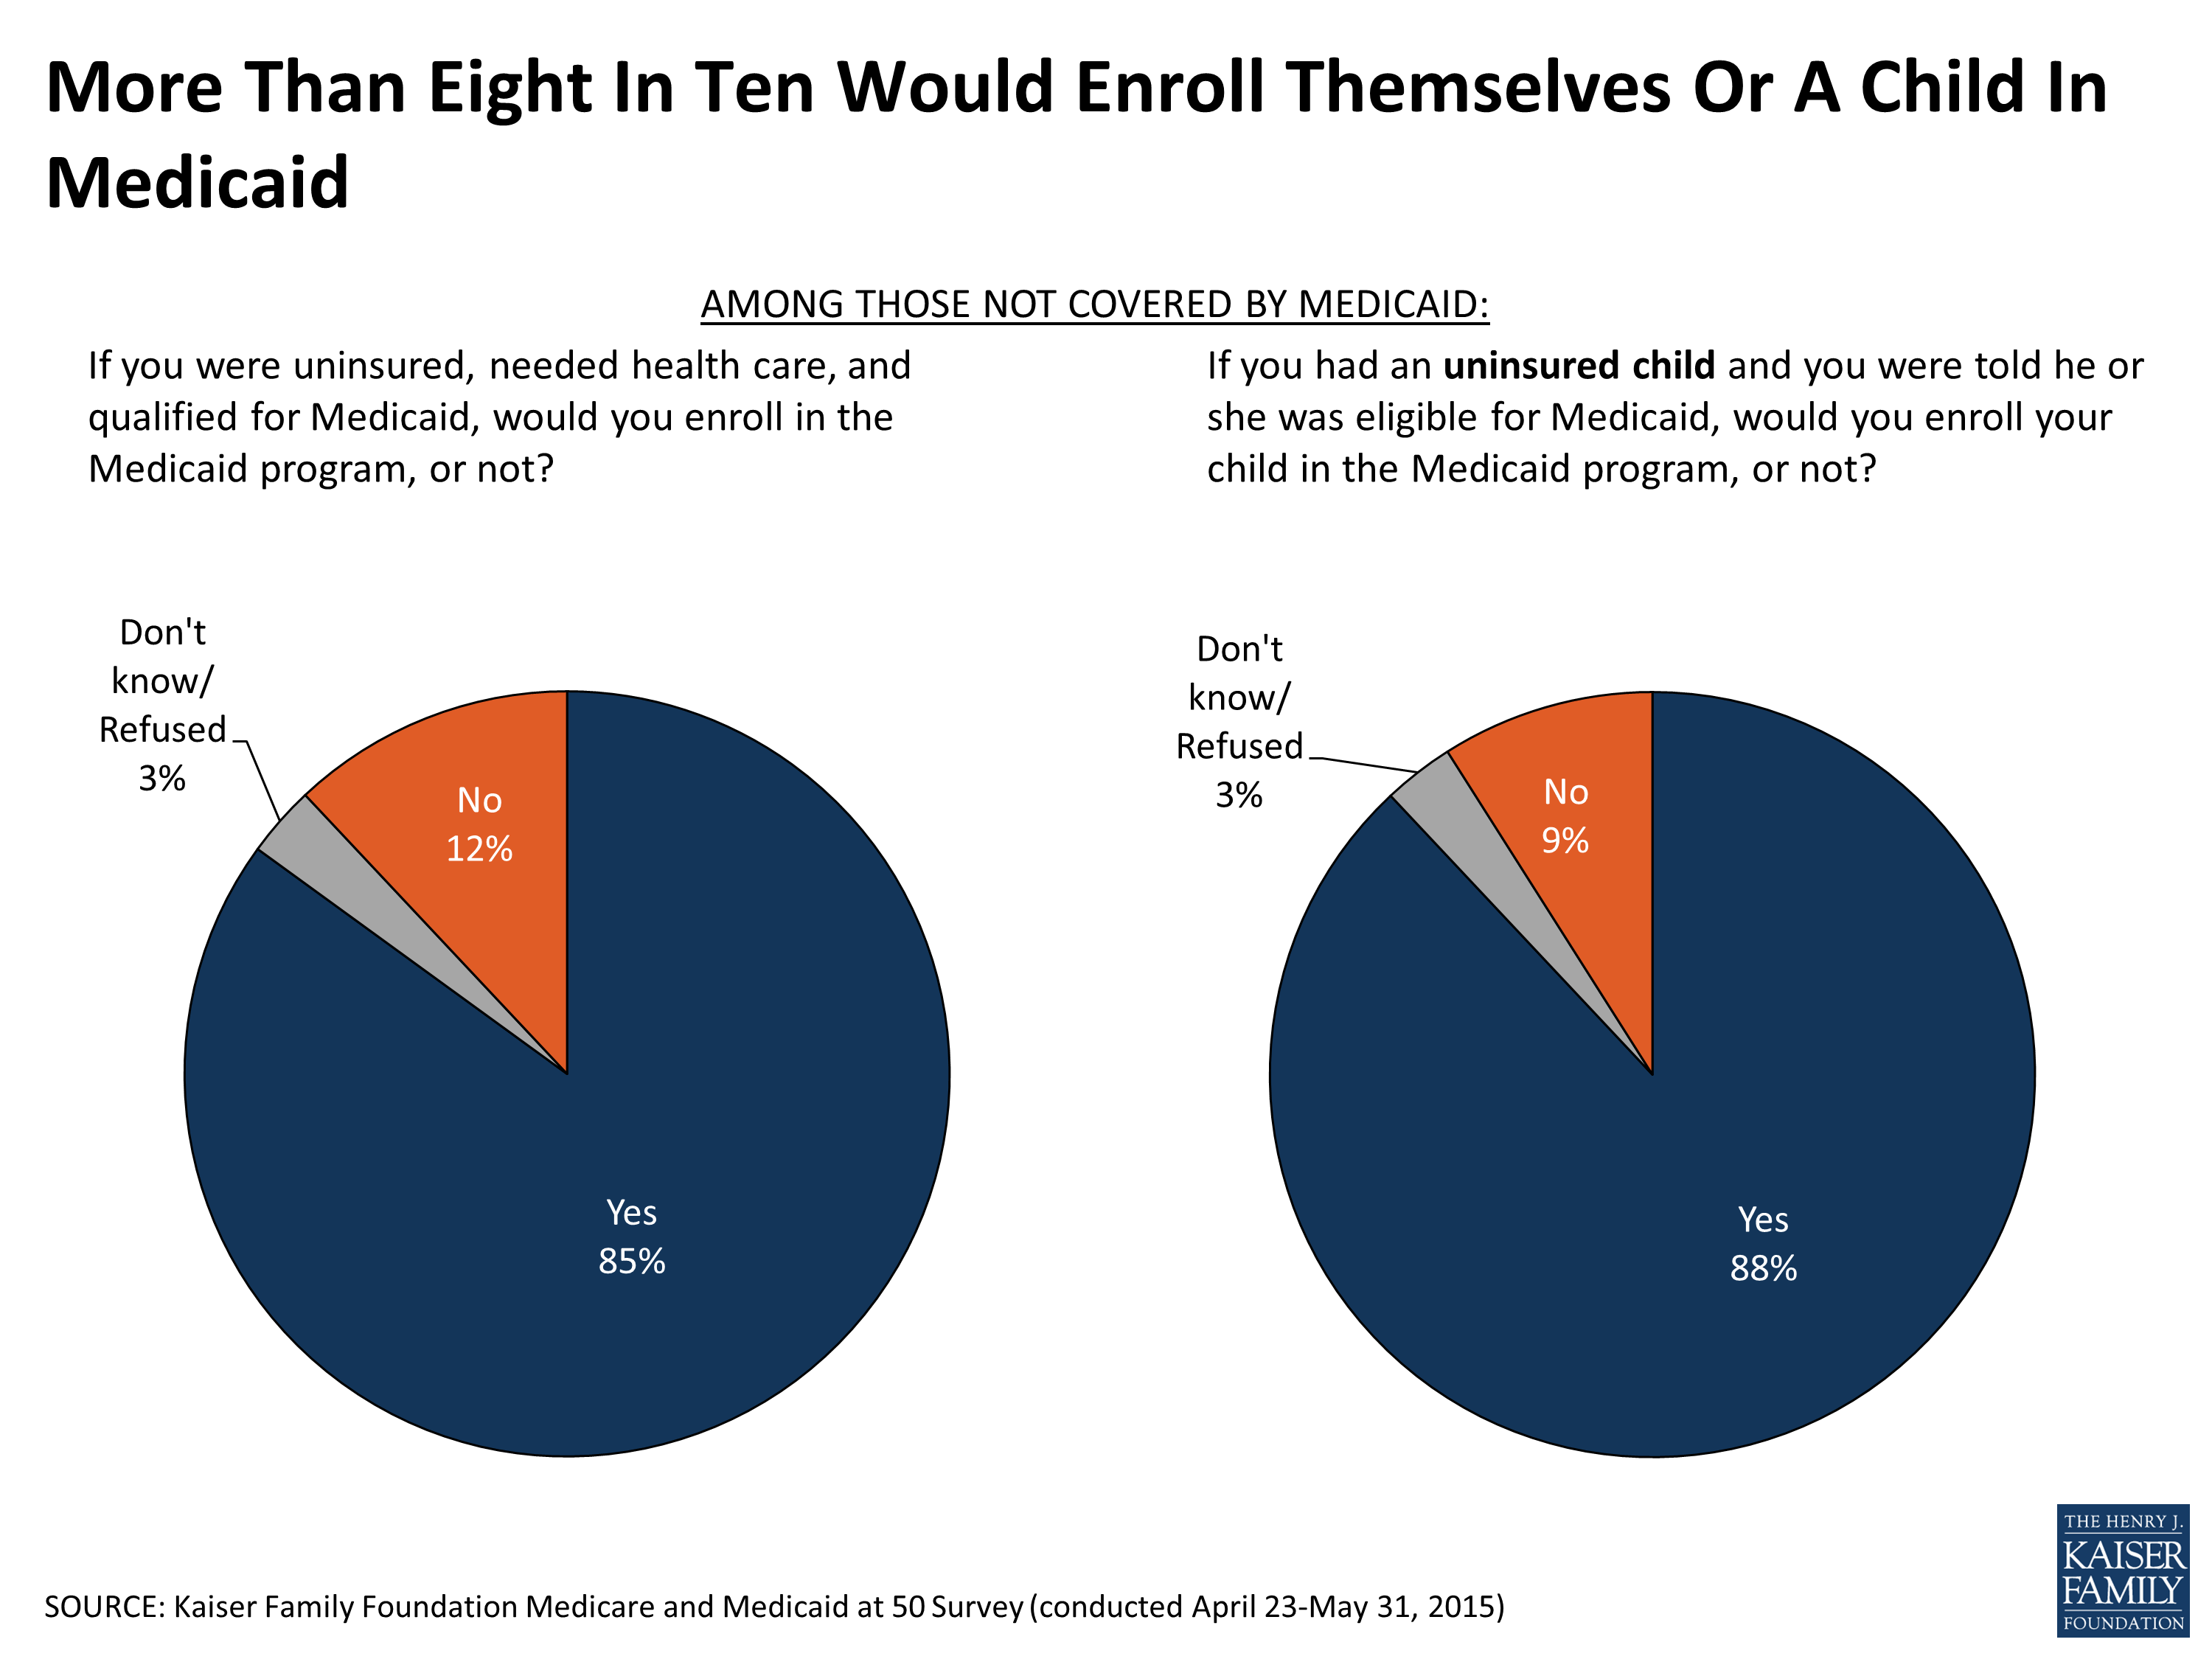
Figure 8
Section 2: Knowledge Of The Medicare And Medicaid Programs
Knowledge Of Programs
A large share (72 percent) of the public, including 85 percent of those 65 and older, is aware that Medicare is the primary source of health insurance for people ages 65 and older, although 17 percent say that Medicaid is the primary source of insurance for this group and an additional 11 percent say it’s some other program or say they don’t know. Similarly, about two-thirds (65 percent) know that Medicaid is the primary source of health insurance for low-income people, although nearly one in five (18 percent) say the program is Medicare, and about the same share (17 percent) say it’s a different program or say they don’t know.
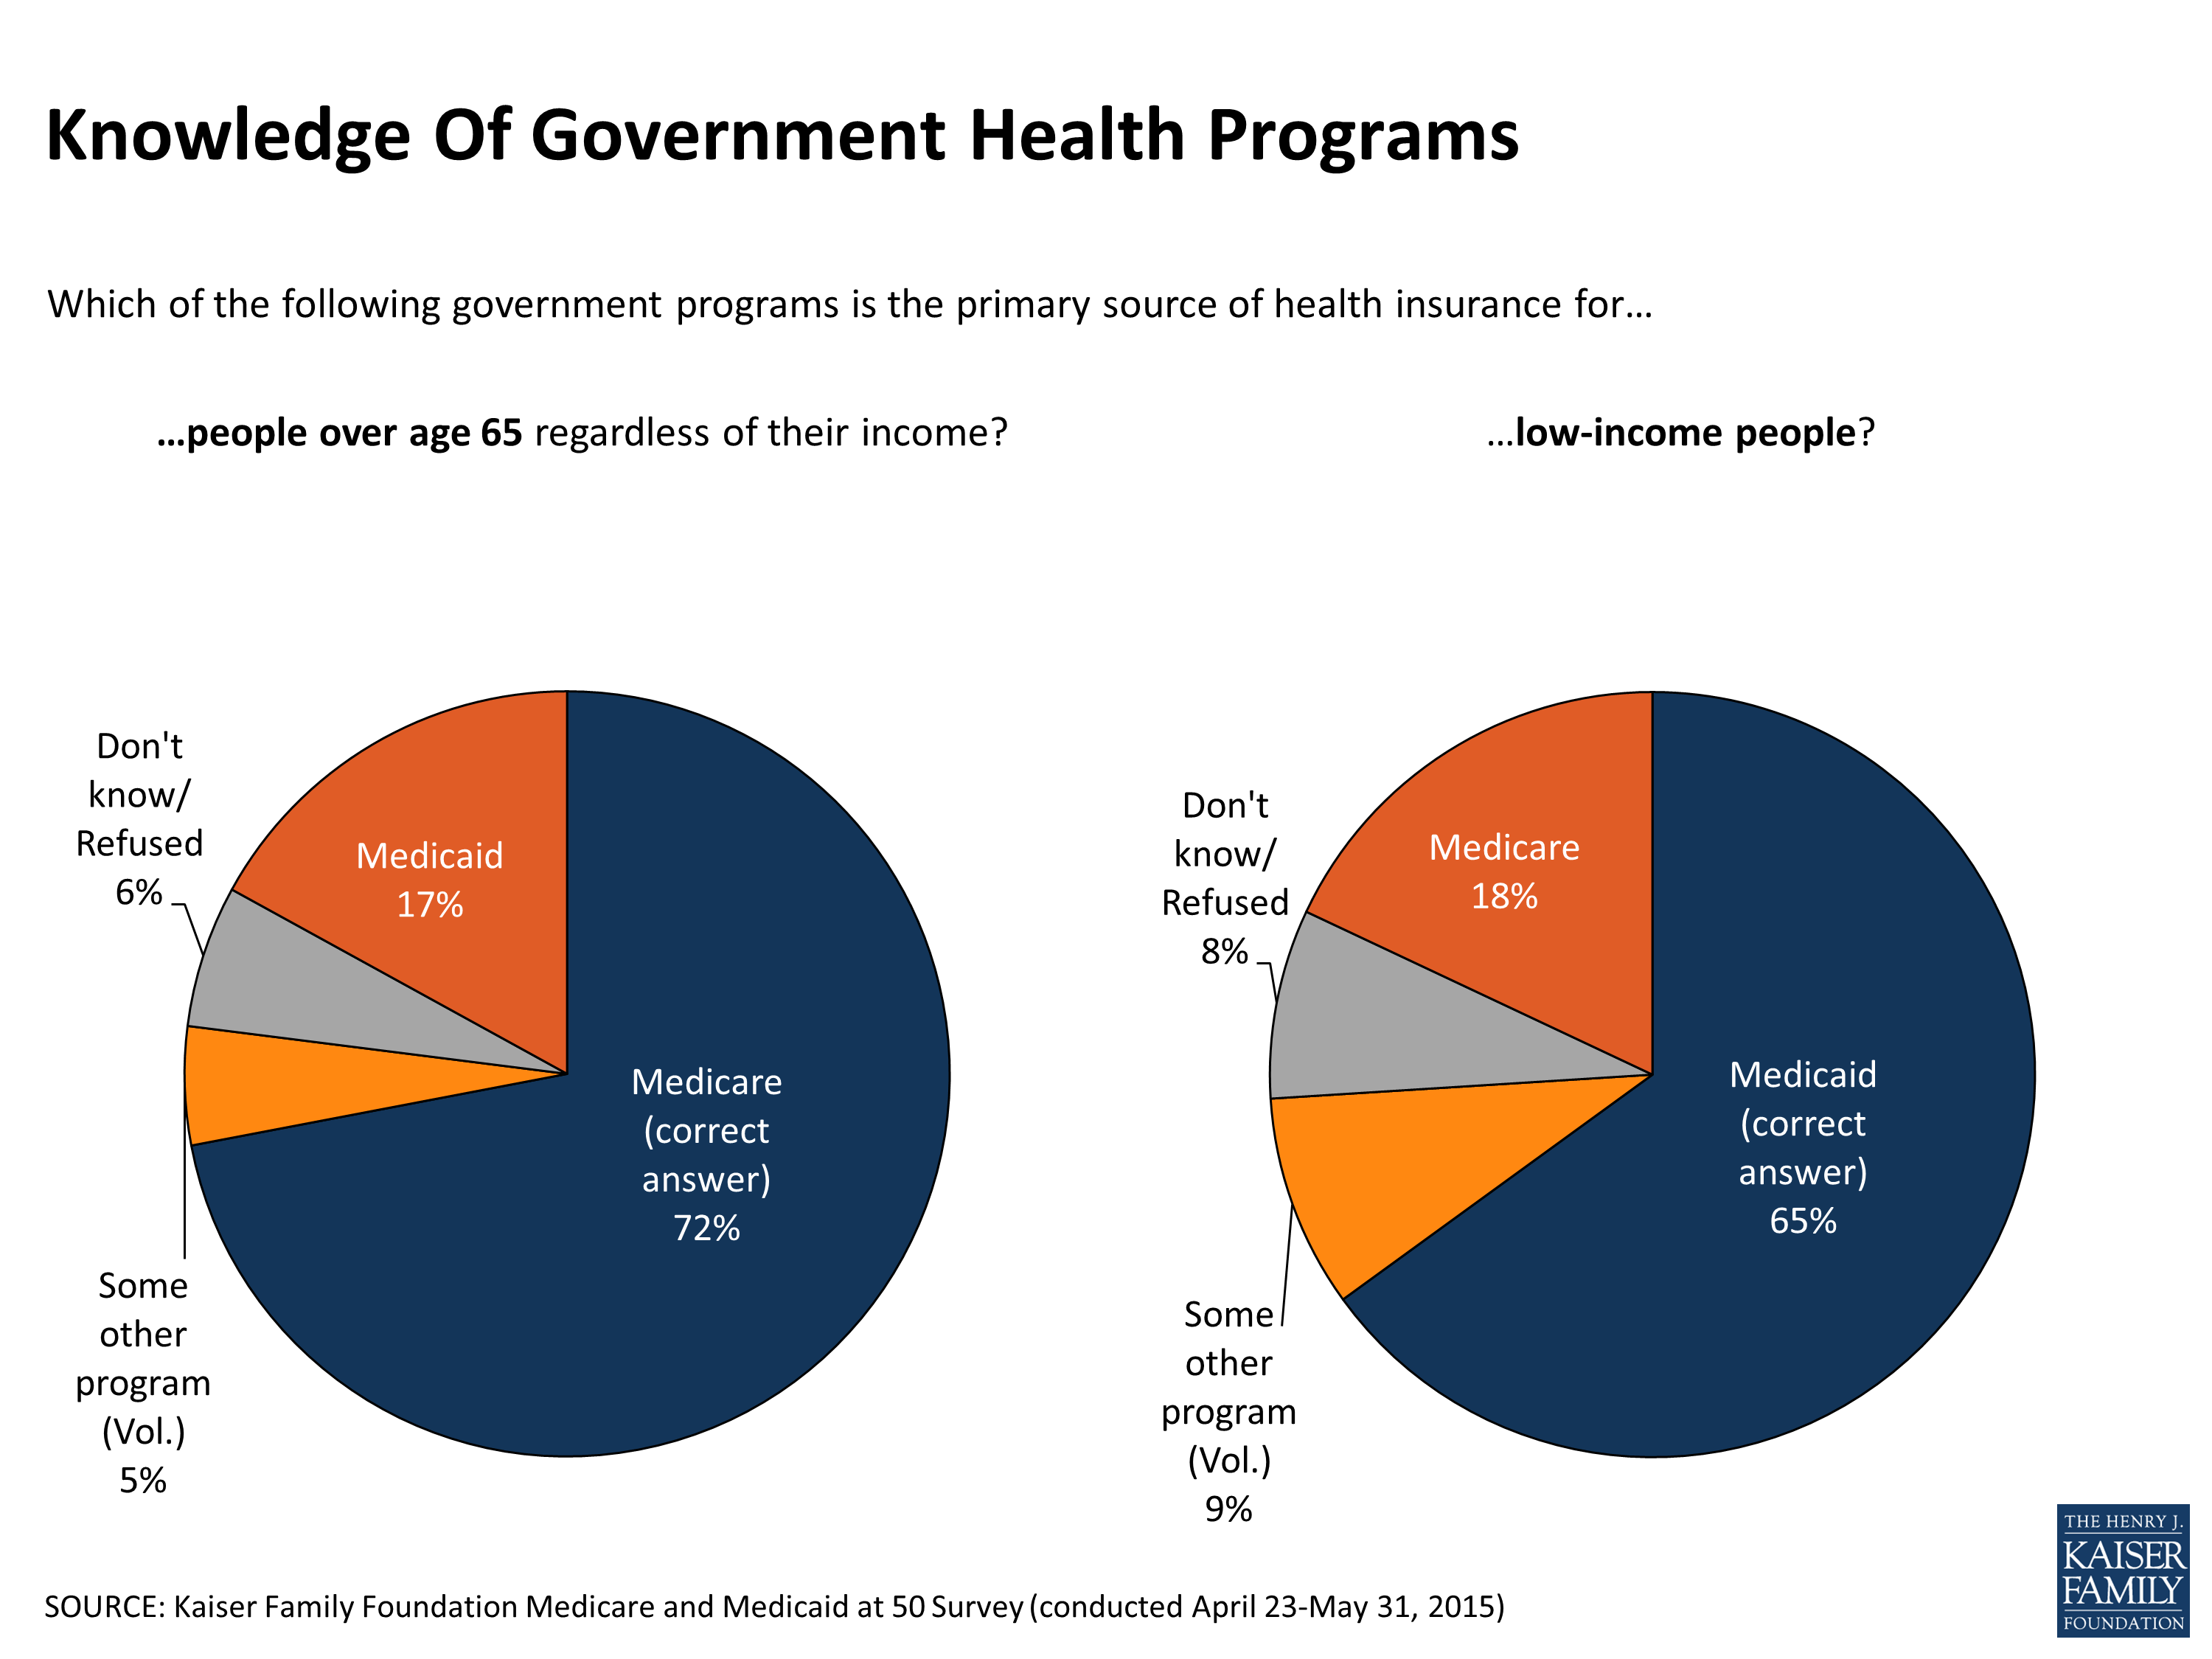
Figure 9
When asked a more specific question about which government program – Medicare or Medicaid – pays for nursing home care and other extended long-term care services for low-income, elderly and disabled people, only about a third (36 percent) correctly name Medicaid, while a similar share (37 percent) say Medicare routinely pays for extended nursing home care, and roughly a quarter (27 percent) say it’s a different program, or say they don’t know. Seniors are slightly more likely to be aware that Medicaid covers extended long-term care services than adults under age 65 (42 percent versus 34 percent).
About three-quarters of the public (74 percent) is aware that Medicare is a federal government program, although nearly one in five (17 percent) incorrectly say it’s a state government program. A majority (57 percent) are aware that Medicaid is a joint state and federal government program, although one in five (21 percent) say it is primarily a federal program, and 15 percent say it’s primarily a state program.
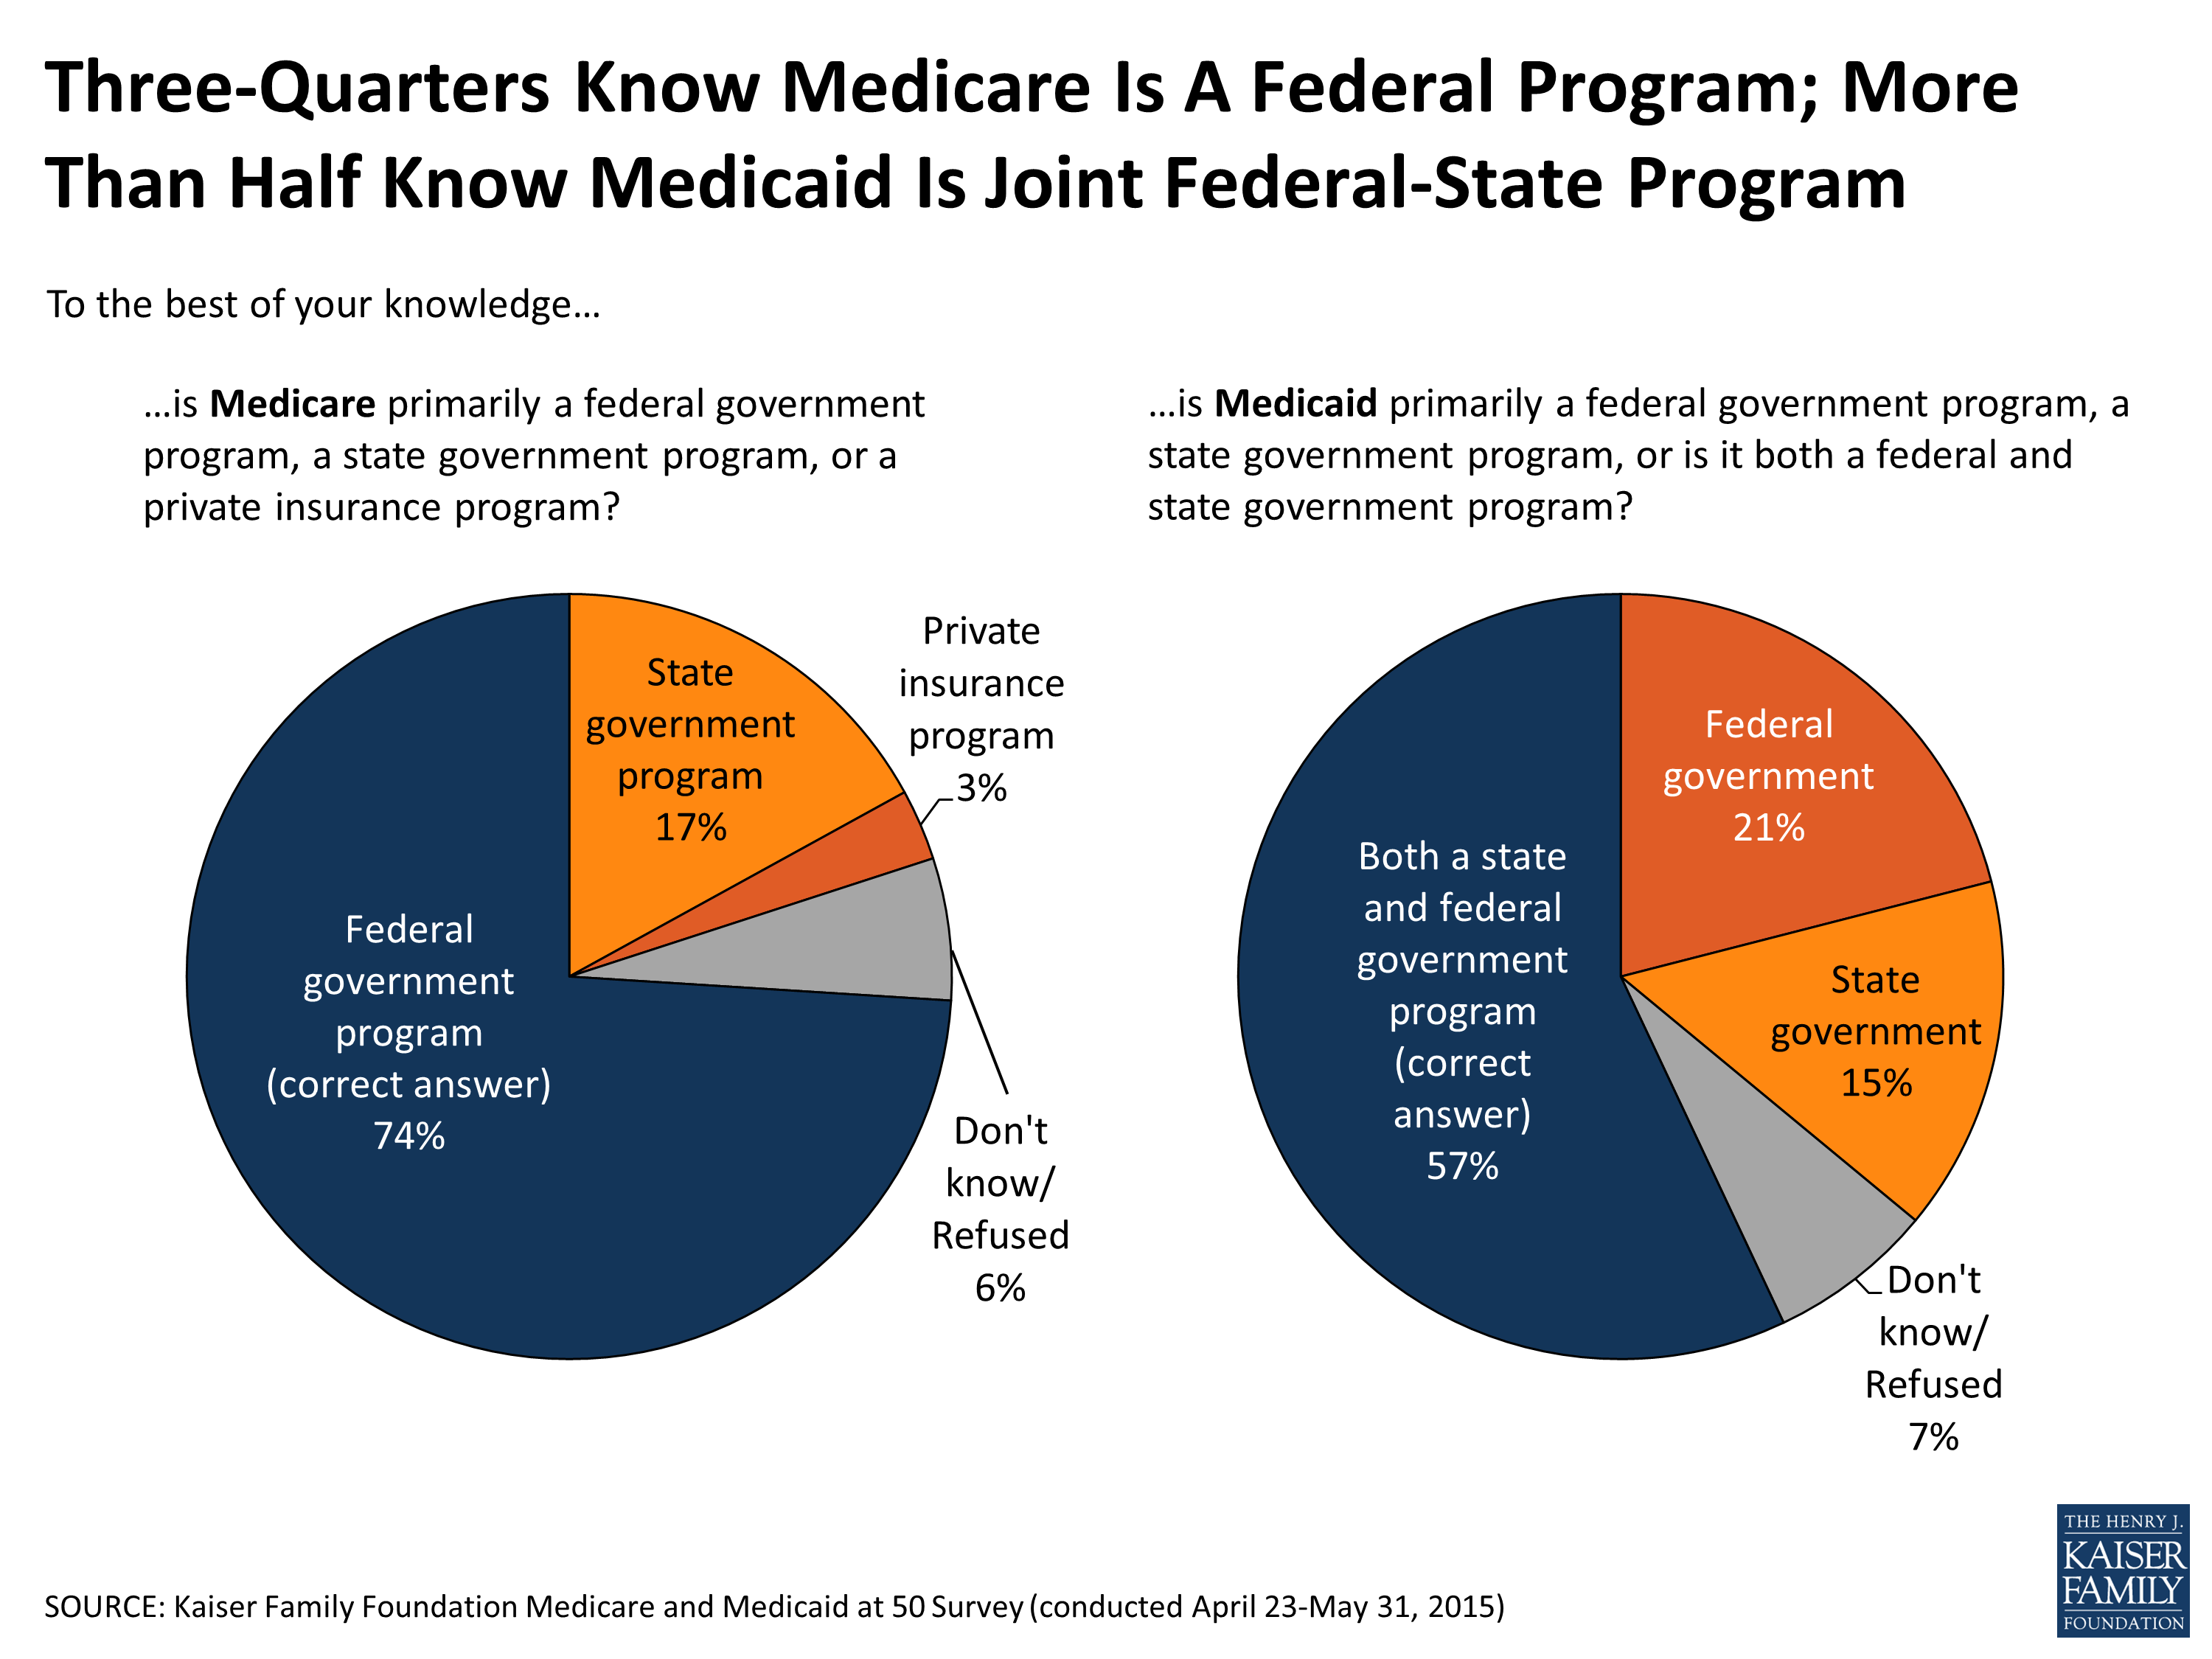
Figure 10
Most Medicare beneficiaries pay the standard monthly premium, but a relatively small share of beneficiaries (around 6 percent in 2015) with higher incomes are required to pay higher premiums for their Medicare coverage.4 Three in ten (30 percent) of the public are aware that higher-income seniors pay higher premiums than other seniors for their Medicare coverage, while nearly half (46 percent) say they do not, and an additional quarter (24 percent) say they don’t know. Surprisingly, those ages 65 and older are no more likely than non-elderly adults to know that higher-income seniors currently pay higher premiums, although seniors earning $75,000 or more annually are more aware of Medicare’s income-related premiums than seniors earning less (40 percent versus 21 percent).
Knowledge Of State Medicaid Expansion
Although many know basic facts about Medicare and Medicaid, an area of general confusion is Medicaid’s expansion under the ACA. When signed into law, the ACA included a provision that states expand their Medicaid programs to cover more low-income uninsured adults, a group that had not been eligible for Medicaid previously. However, a 2012 Supreme Court ruling effectively made it optional for states to expand, and 21 states have opted not to do so as of June 2015.5 About six in ten Americans (62 percent) are aware that some states have not expanded their Medicaid program to cover more low-income uninsured adults. About one in ten (9 percent) incorrectly say that all states have expanded their programs, and about three in ten (29 percent) say they don’t know.
When asked whether or not their state has expanded Medicaid, more than four in ten correctly know their state’s expansion status, including 46 percent of those in states that have not expanded their Medicaid programs and 42 percent of those in states that have expanded. Seventeen percent in both groups incorrectly say their state has expanded Medicaid when it hasn’t, or vice versa. About three in ten say they don’t know their state’s expansion status and about one in ten incorrectly say that all states have expanded their Medicaid programs. The people targeted by Medicaid, those with lower incomes, are no more likely to be aware of their state’s expansion status. In fact, those with higher incomes (earning at least $75,000 annually) are more likely than those earning less to be aware of their state’s expansion status (54 percent versus 42 percent for those earning between $30,000-$75,000 annually and 37 percent for those earning less than $30,000 annually).
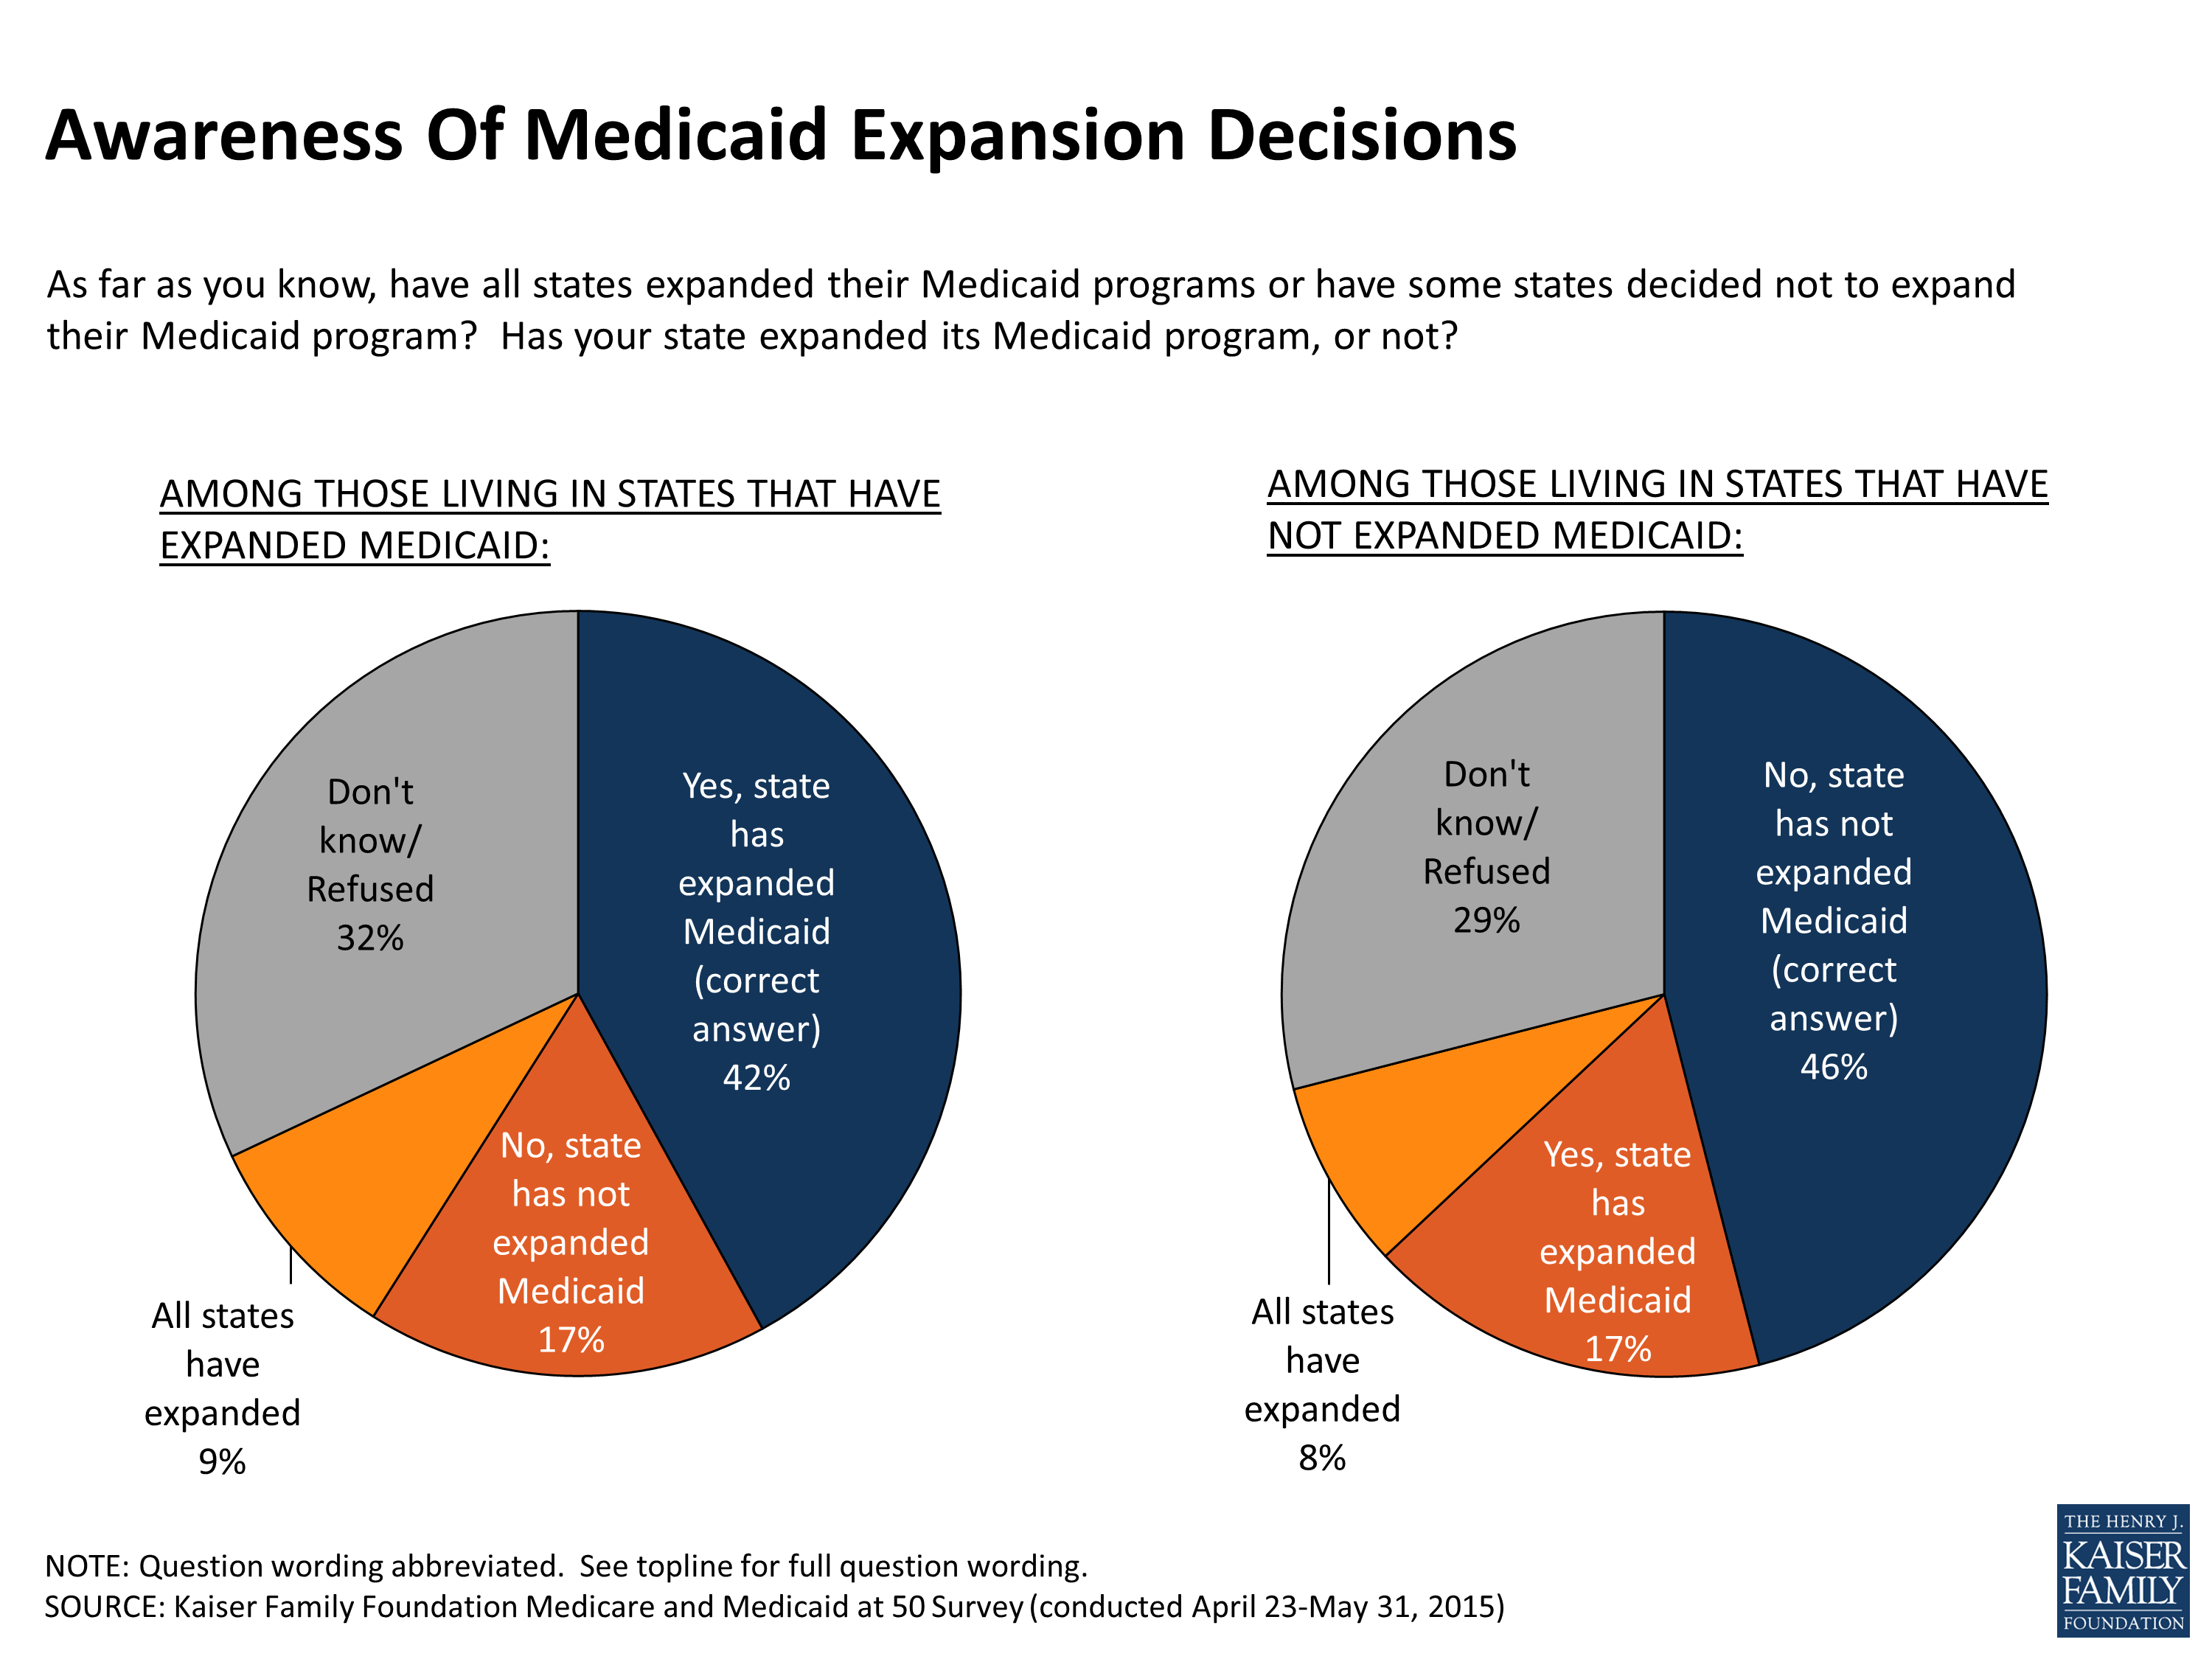
Figure 11
In addition to some confusion regarding the status of their state’s Medicaid expansion, many don’t know how this expansion is being financed. One in four (26 percent) recognize that the federal government pays nearly all the costs of expanding the Medicaid program, while one in five (20 percent) incorrectly say the states themselves pay nearly all the costs. The largest share, 42 percent, mistakenly say that both the federal government and the states share the costs equally.
Section 3: National Priorities and the Future of Medicare and Medicaid
Spending Priorities
Reflecting the high regard the public holds for these programs, Americans are generally opposed to cutting back federal spending on Medicare or Medicaid, as previous surveys have found. Nearly half say they’d like to see the President and Congress keep Medicare and Medicaid spending about the same, while roughly four in ten say they would support an increase in spending. Support for spending increases for Medicare and Medicaid fall just below support for such increases in education and Social Security. Relatively few support cuts to either program.
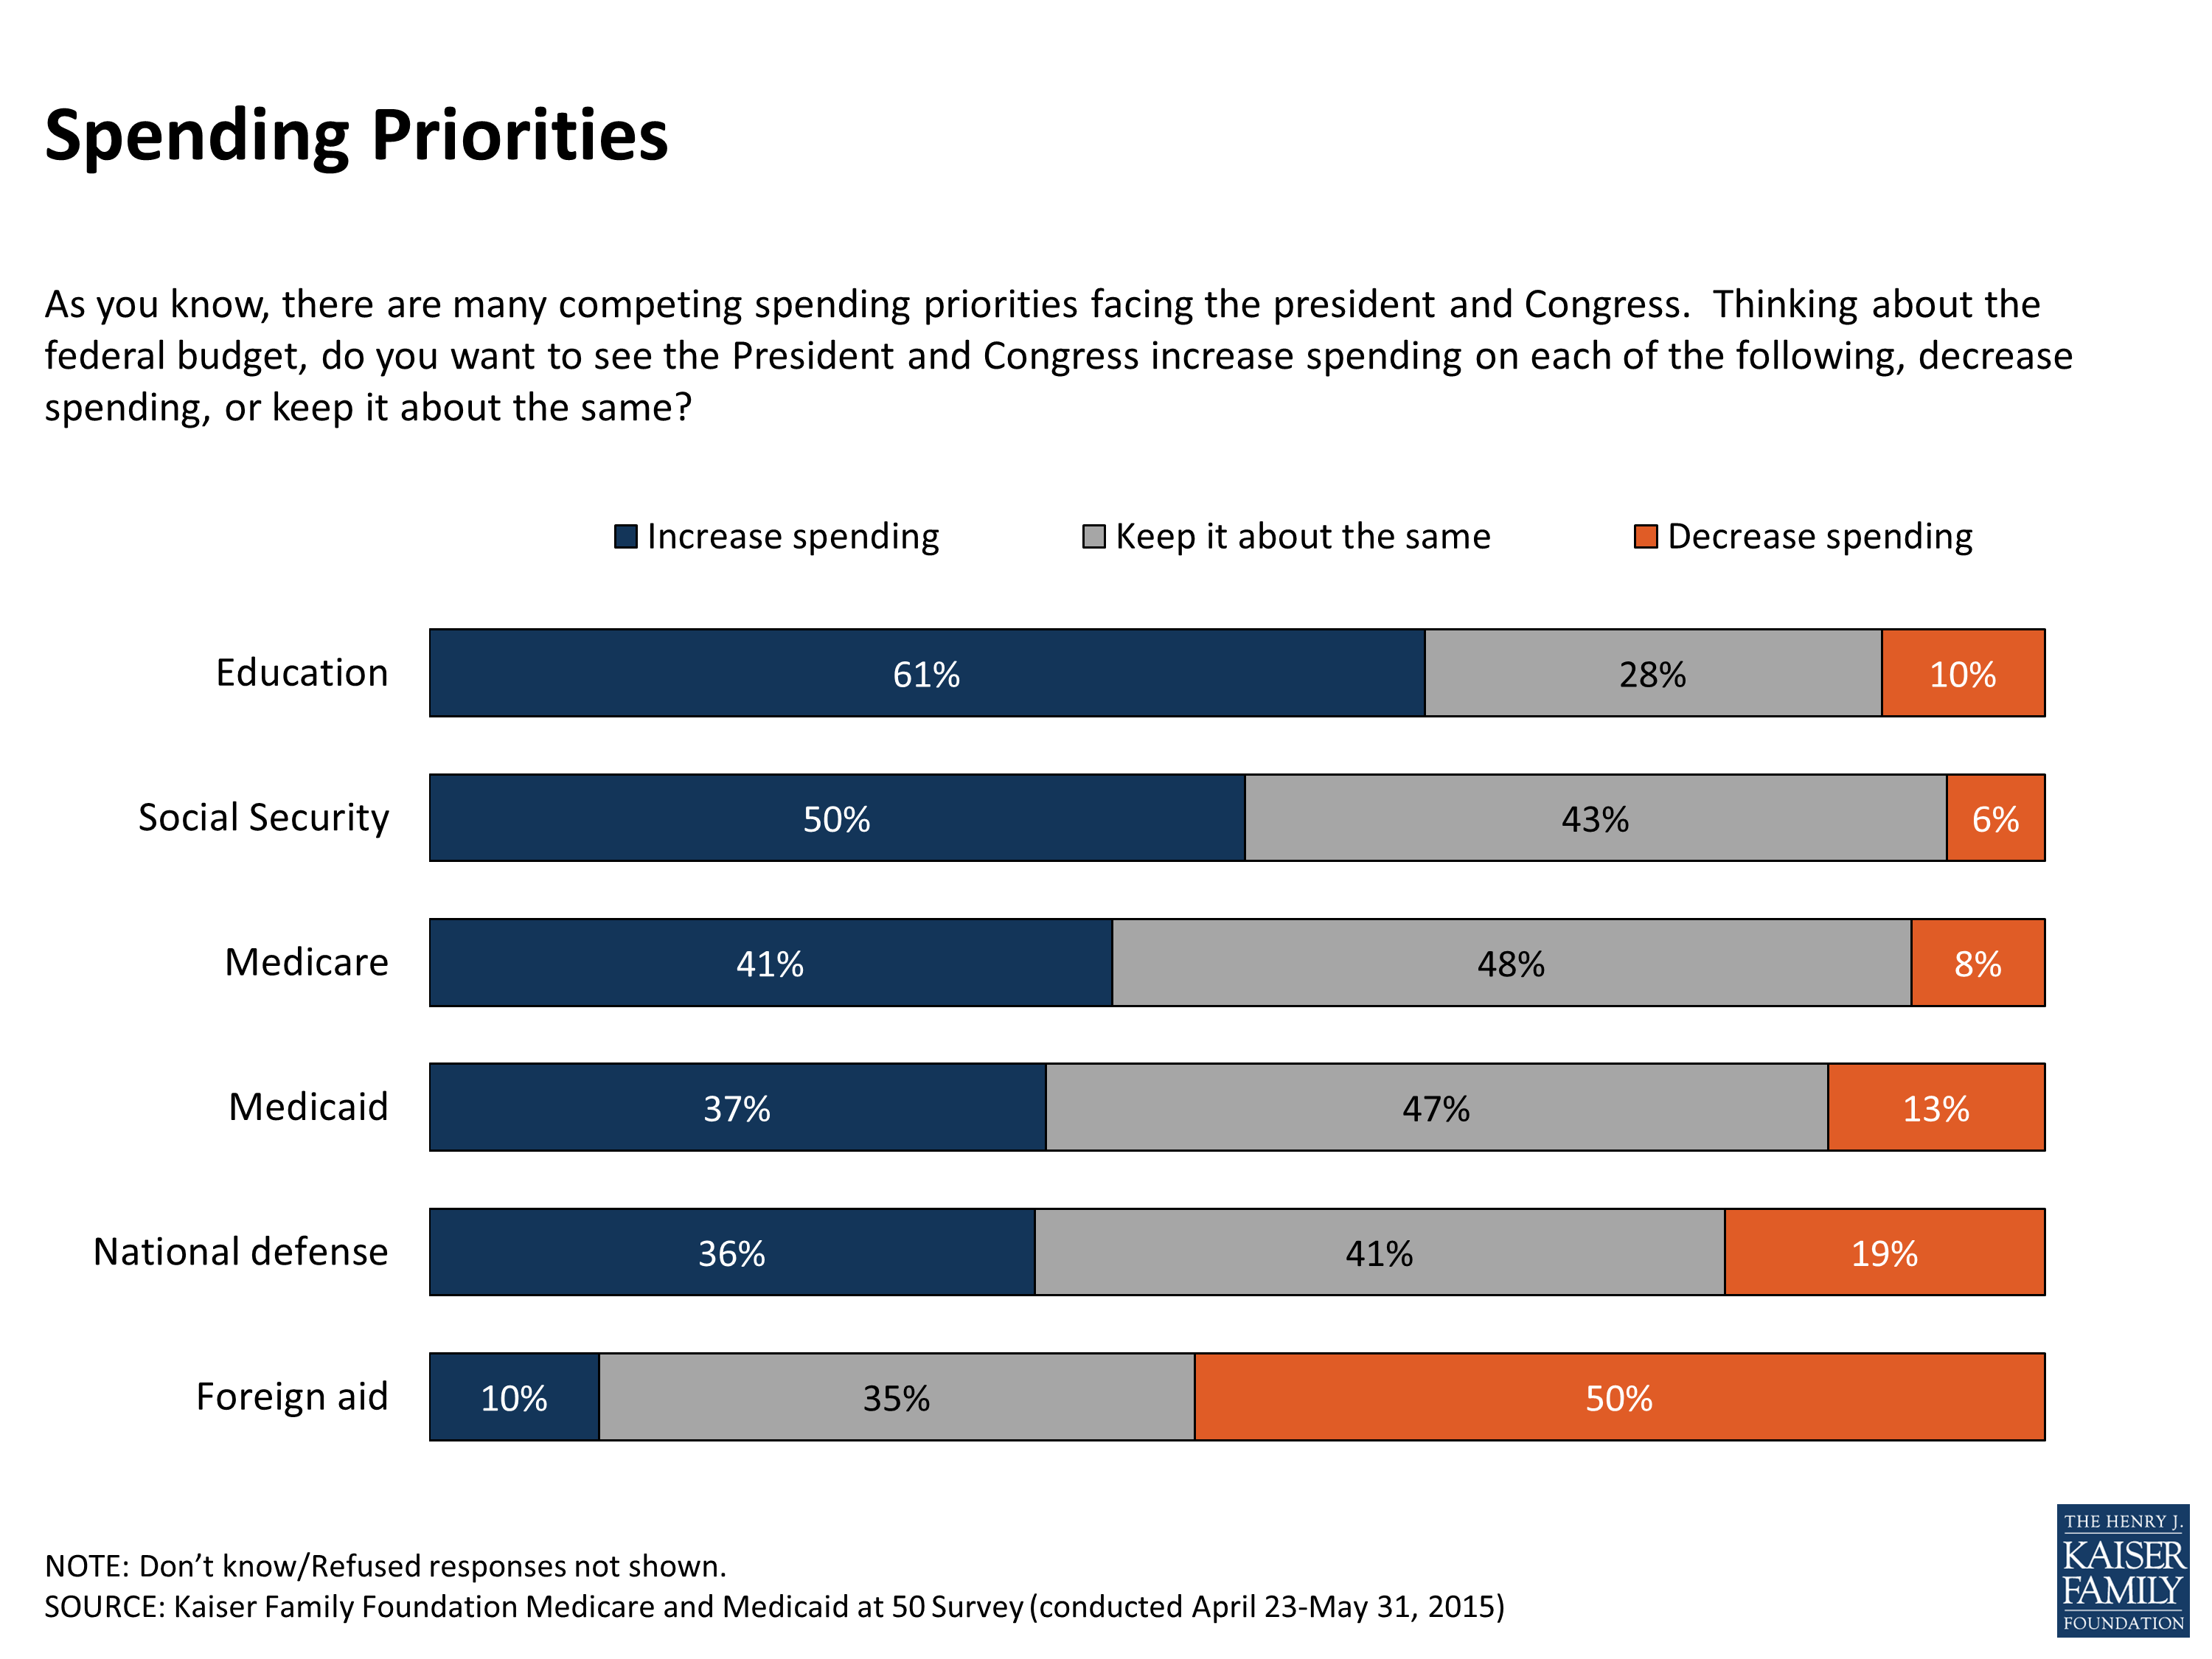
Figure 12
Democrats say they favor increased government spending on Medicare (54 percent) and Medicaid (53 percent), while Republicans favor keeping spending about the same (61 percent for Medicare, 54 percent for Medicaid). In terms of people’s connection to the programs, those covered by Medicare are no more likely than those with employer coverage to support increases in Medicare spending. However, for Medicaid, roughly half (45 percent) of those covered by Medicaid say they support increased spending for the program, while a similar share (46 percent) of those with coverage through an employer say they would like spending to remain as it is. Those who say they have no personal experience with Medicaid and no close friends or family who have are somewhat more likely to support cuts to Medicaid (18 percent versus 10 percent). (See Appendix Table 3 for details).
Financial Future Of Medicare
As health care costs rise and the elderly population grows, there is some concern among the public about Medicare’s financial sustainability. A slim majority (54 percent) of the public says they are not confident in the program’s ability to continue to provide future beneficiaries the same level of benefits that seniors receive today, while 44 percent saying they are confident. Fewer Americans under age 65 than those ages 65 and older express confidence in Medicare’s ability to provide the same level of benefits for future beneficiaries.
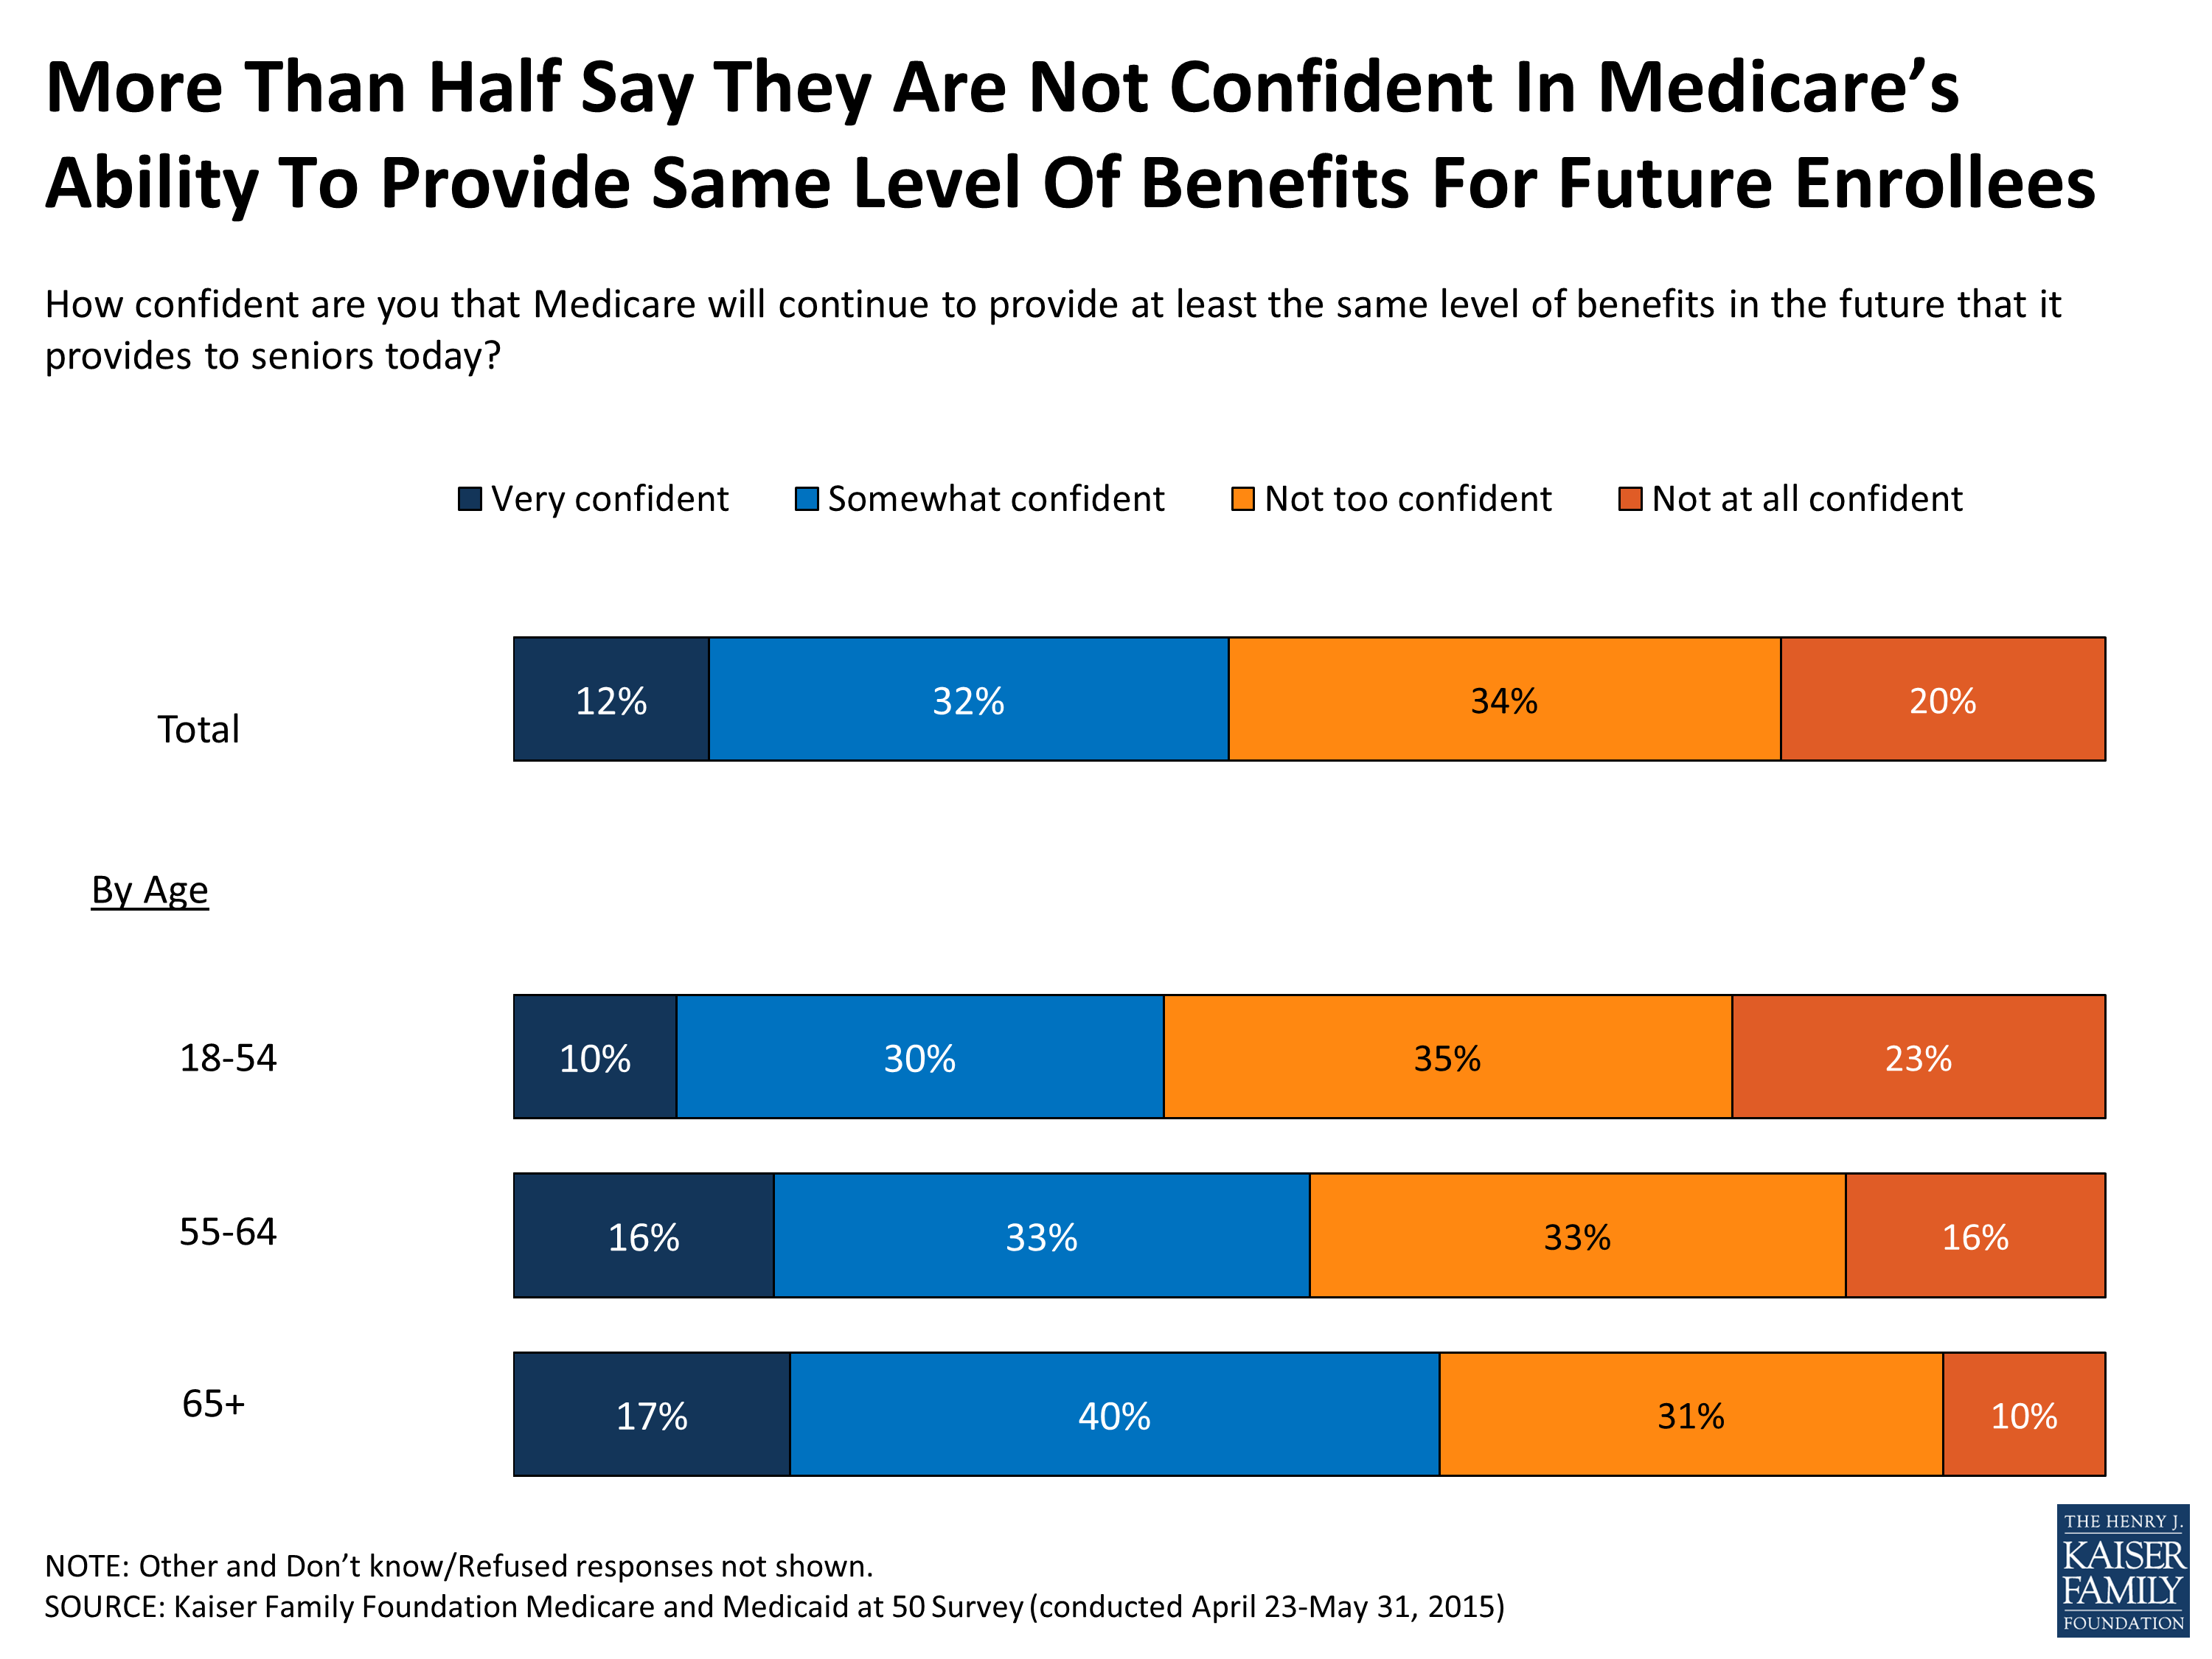
Figure 13
Echoing this concern about Medicare’s future, roughly two-thirds (68 percent) say changes need to be made to the Medicare program to keep it sustainable for the future, while only about a quarter (27 percent) say the program will basically be fine if left as is. Adults under age 65 are more likely than seniors to say changes need to be made to keep it sustainable (71 percent versus 54 percent). When it comes to the extent of those changes, however, the public is divided, with about a third (35 percent) saying major changes are needed to keep Medicare sustainable for the future, while three in ten (30 percent) say the changes needed are minor.
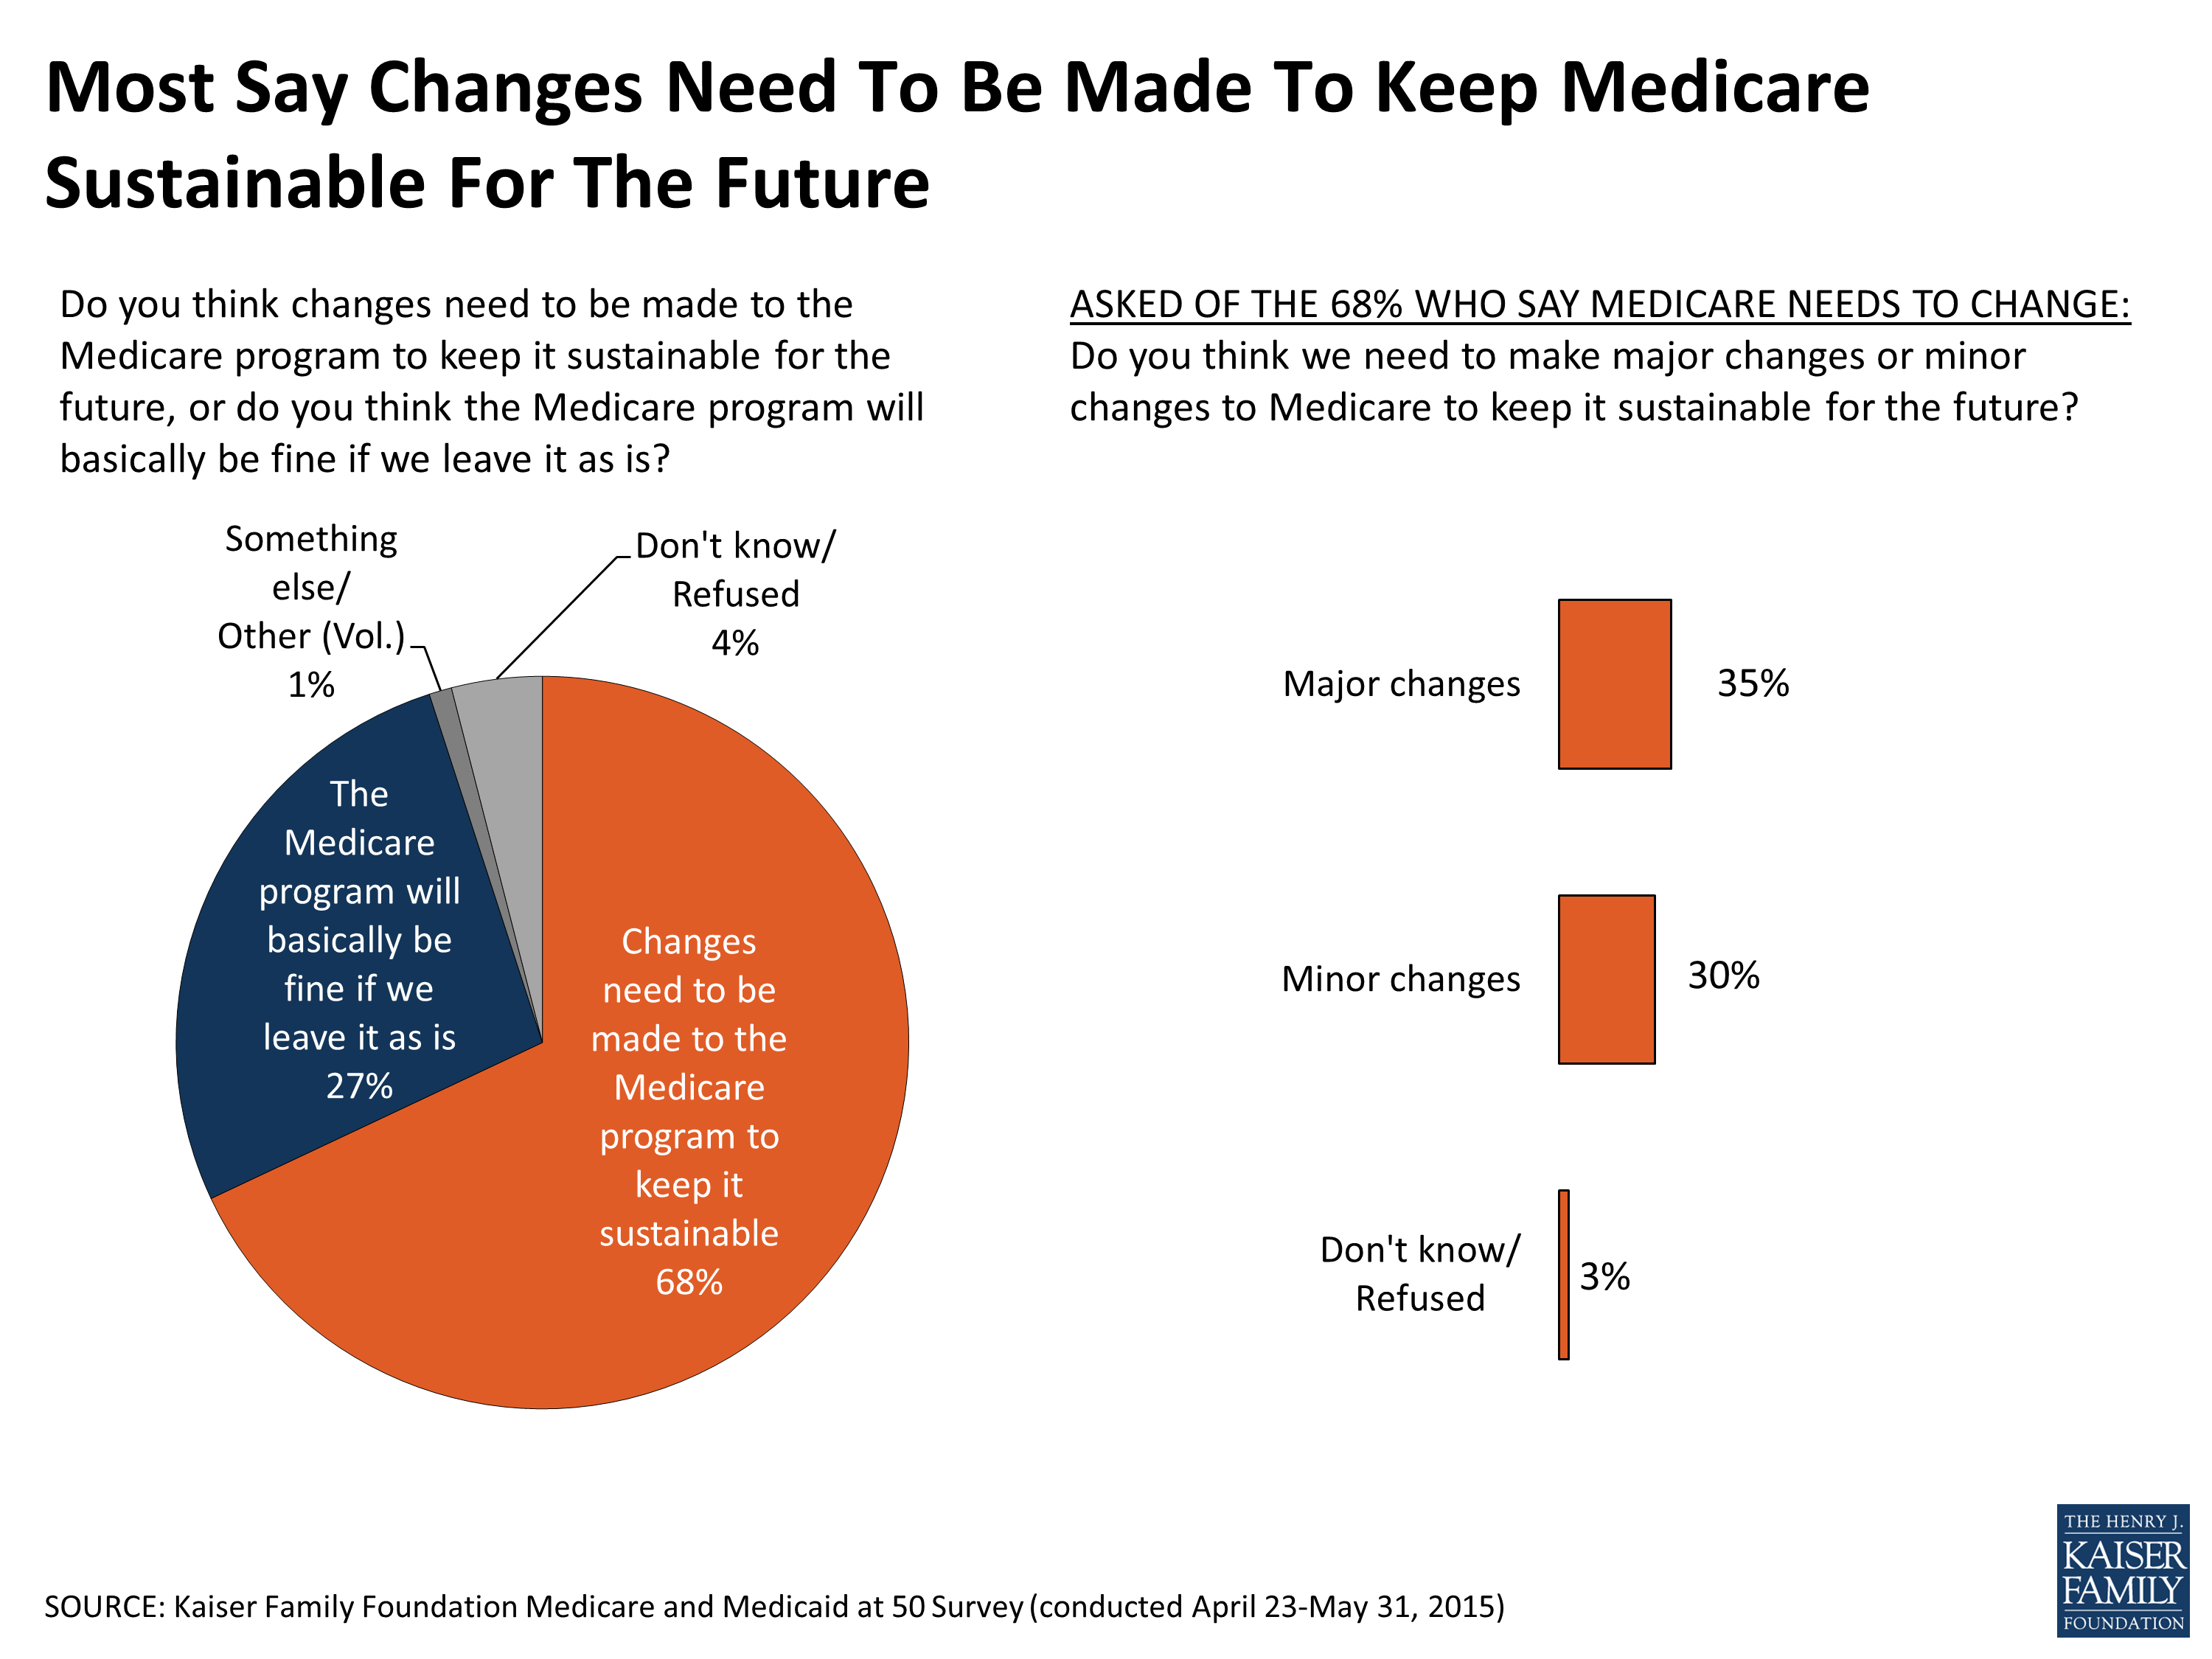
Figure 14
Proposed Changes To Medicare
Proposals to keep Medicare financially sustainable have taken a variety of forms in recent years. When asked about several specific proposals, this survey finds strong public support across age groups and party lines for allowing the federal government to negotiate lower prices with drug companies. About six in ten (58 percent) favor increasing Medicare premiums for wealthier seniors, but much fewer (31 percent) support increasing Medicare premiums for all seniors. While about half of the public overall (51 percent) support reducing Medicare payments to private insurance companies that provide Medicare benefits, this garners less support from older adults (39 percent). Compared to other, more popular proposals, fewer people support gradually raising the age of eligibility from 65 to 67 (39 percent overall), or increasing cost-sharing for future Medicare beneficiaries (24 percent overall). Raising the age of Medicare eligibility is supported by a smaller share of younger adults than adults ages 65 and older, who are already covered by Medicare and would not be affected by this change.
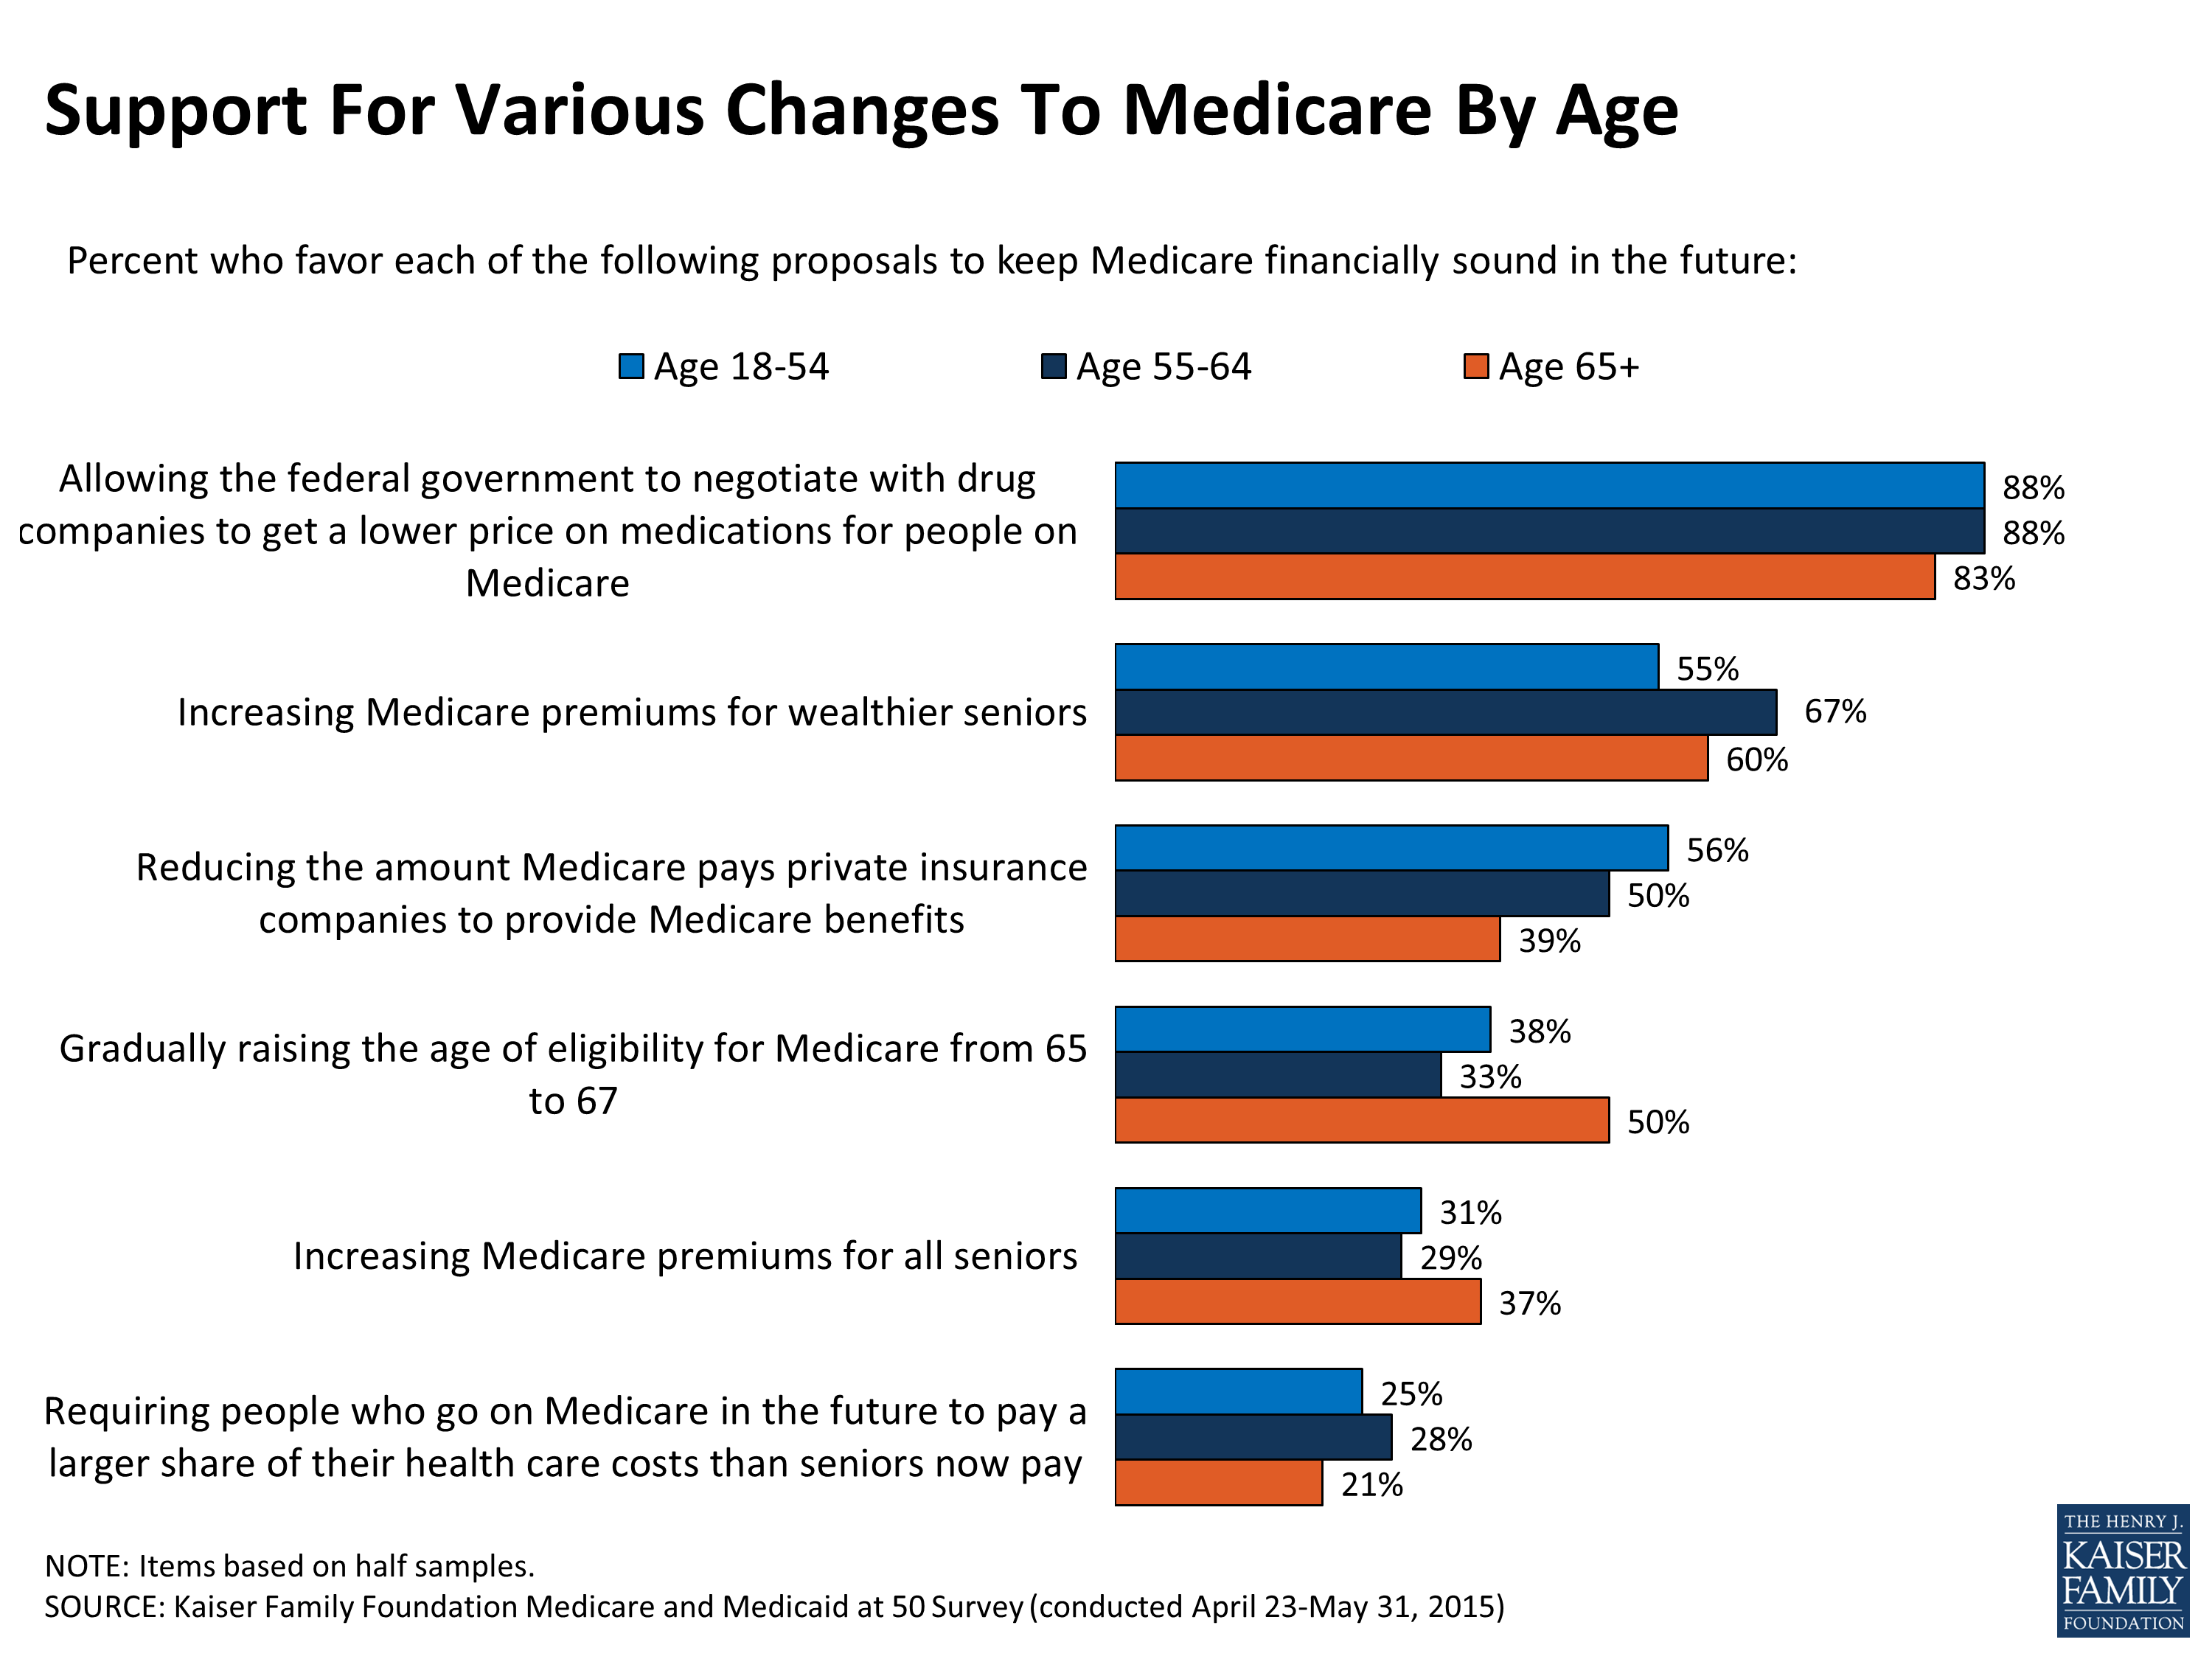
Figure 15
One proposal discussed in Congress would change the structure of Medicare so that the government would guarantee each senior a fixed contribution toward the cost of their insurance, rather than a defined set of benefits. Under this proposal, which is often called premium support, seniors would apply a certain amount toward the purchase of coverage from either traditional Medicare or from a list of private health plans. Most Americans, however, say they prefer the current system, with seven in ten (70 percent) saying Medicare should continue as it is today, with the government guaranteeing seniors’ health insurance and making sure that everyone can get the same defined set of benefits. A quarter (26 percent) say they prefer to see Medicare changed to a premium support system. Those under age 65 are somewhat more likely than seniors to support changing to such a structure (28 percent versus 18 percent). A majority of seniors, regardless of political party identification, prefer to see Medicare stay as is, seniors who identify as Democrats are somewhat less supportive of this change to Medicare (11 percent) than seniors who are independents (22 percent) or Republicans (27 percent).
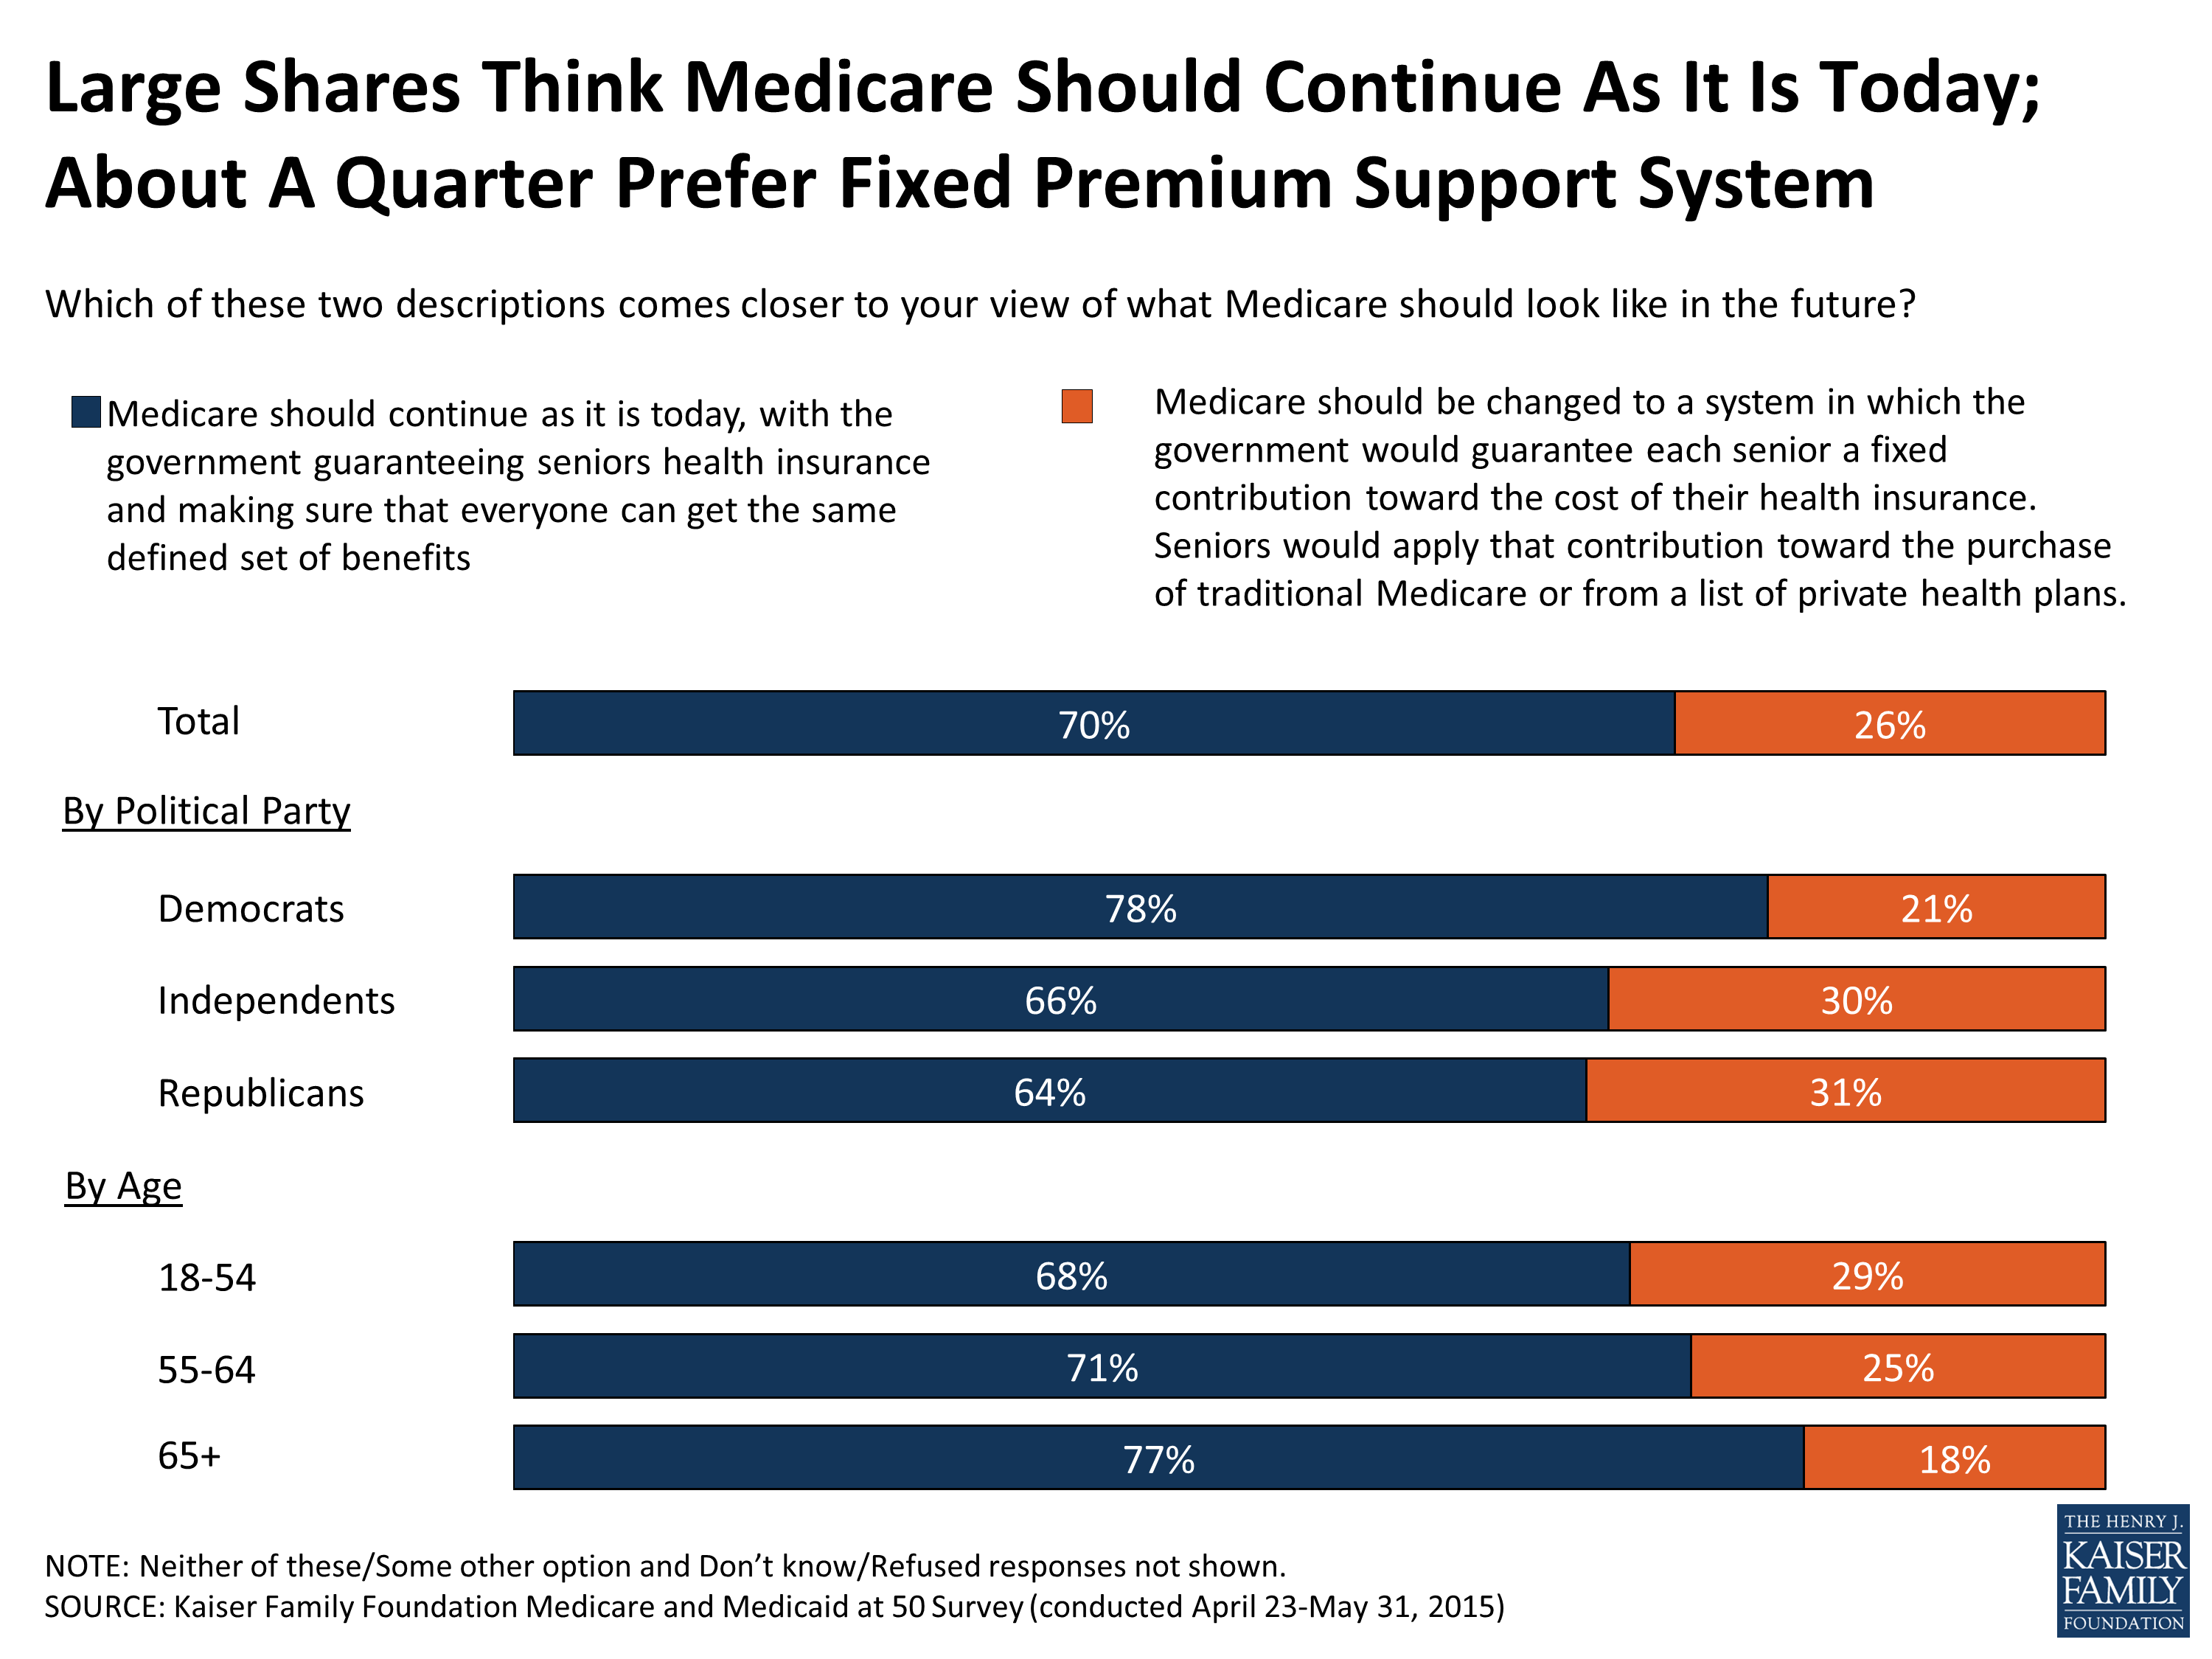
Figure 16
Proposed Changes To Medicaid
Some policymakers have proposed reforming the payment model for the Medicaid program in the form of a block grant. Currently, the federal government matches state spending on an open-ended basis. Under a block grant structure, the federal government would limit the amount it gives states to help pay for Medicaid coverage but could allow states more flexibility in determining which groups of people and what services are covered under the program. Here again, most Americans prefer the status quo, with roughly six in ten (62 percent) saying the program should continue as it is today, with the federal government guaranteeing coverage for low income people, matching state spending on the program, and setting standards for who gets covered under the program and what benefits are offered. About a third (32 percent) say that, instead, Medicaid should be changed to a block grant structure rather than matching state Medicaid spending.
Block grant proposals are generally made by Republicans in Congress in the context of federal deficit reduction proposals, and this survey finds that there is broader support for this proposal among Republicans than Democrats across the country (50 percent versus 20 percent). Still, Republicans are somewhat divided in how they envision the future of Medicaid, with more than four in ten saying Medicaid should continue as it is today (43 percent). Democrats overwhelmingly favor the current arrangement (76 percent) over a change to a block grant system (20 percent).
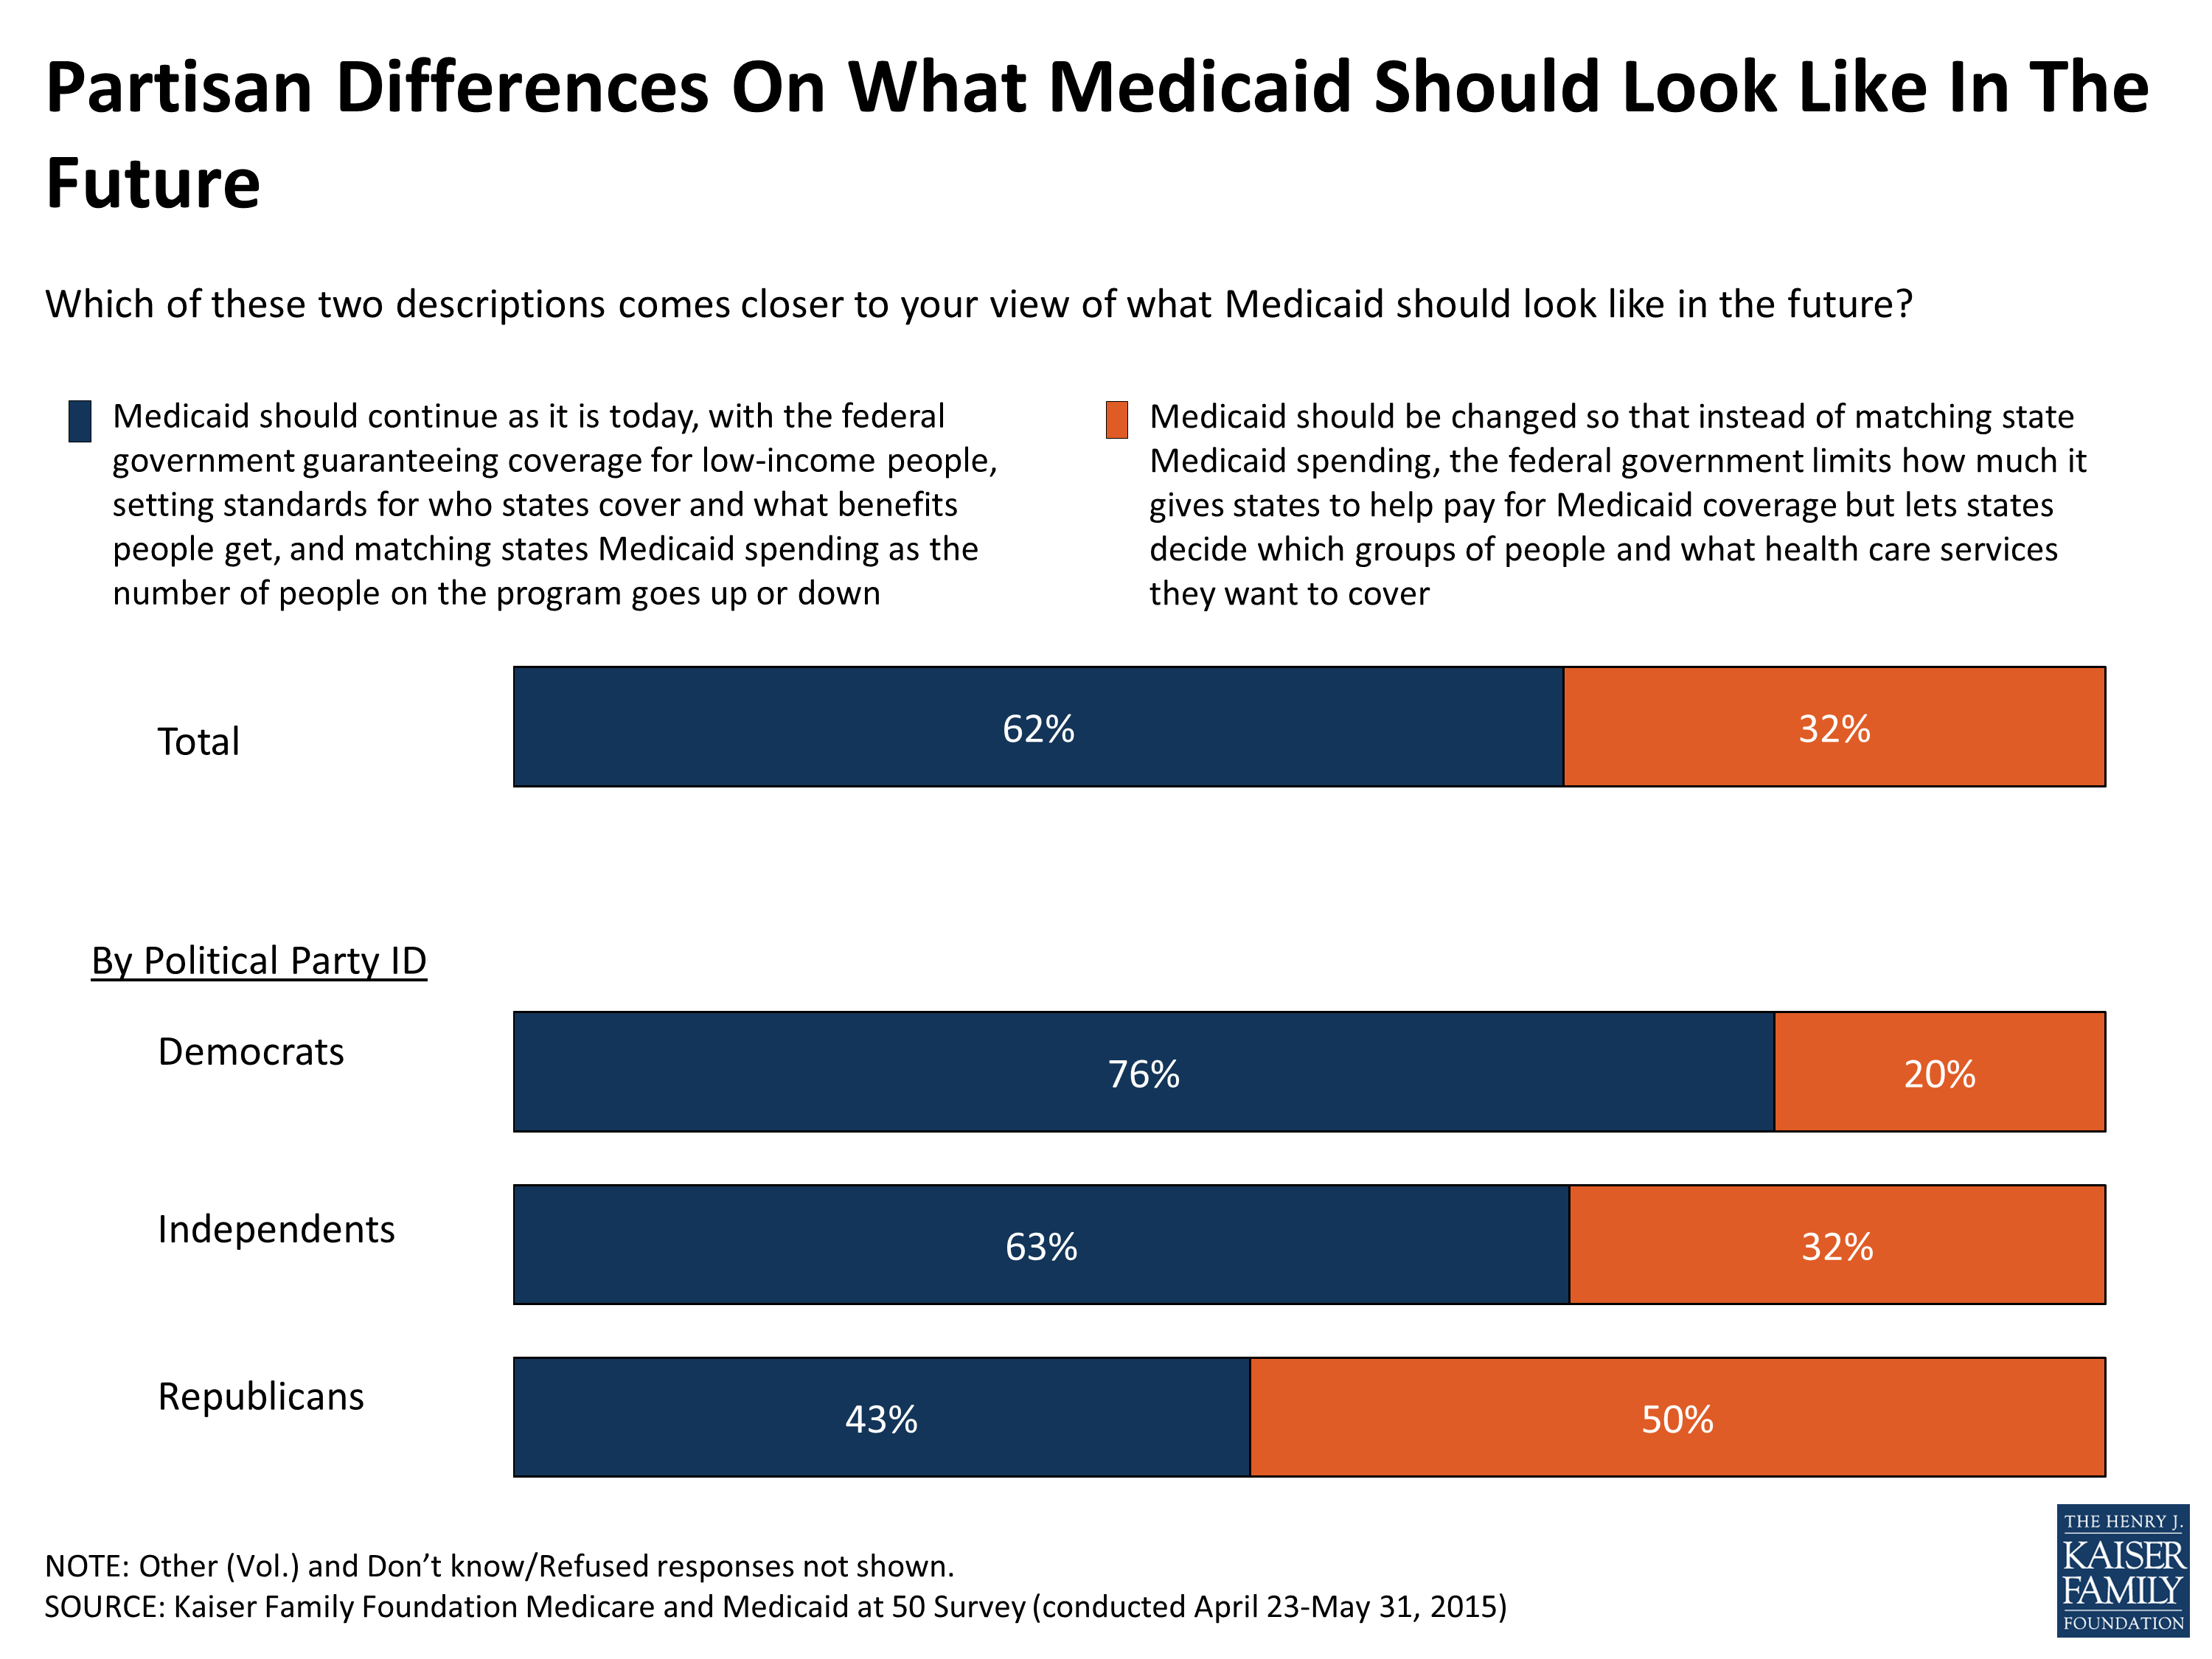
Figure 17
Partisan Divisions On Who Americans Trust To Handle Programs
When asked which political party Americans trust more with these programs, over four in ten say they trust Democrats to do a better job handling both Medicare (44 percent) and Medicaid (46 percent), and roughly three in ten say they trust Republicans, while nearly 1 in 5 say they trust neither group. These findings have been relatively stable over the past five years. However trust in Democrats’ handling of Medicare has narrowed in recent years, particularly among older adults. In 1998, 46 percent of those ages 65 and older said they trusted Democrats and 22 percent chose Republicans, a gap of 24 percentage points; by 2015 those percentages are 44 and 34 percent, respectively, narrowing the gap to 10 points.6
As expected, there is sharp partisan divide on this question, although those who don’t identify with either party – political independents – are more likely to say they trust Democrats more than Republicans with both programs (36 percent versus 27 percent for Medicare, 40 percent versus 23 percent for Medicaid). Still about three in ten independents say they trust neither party.
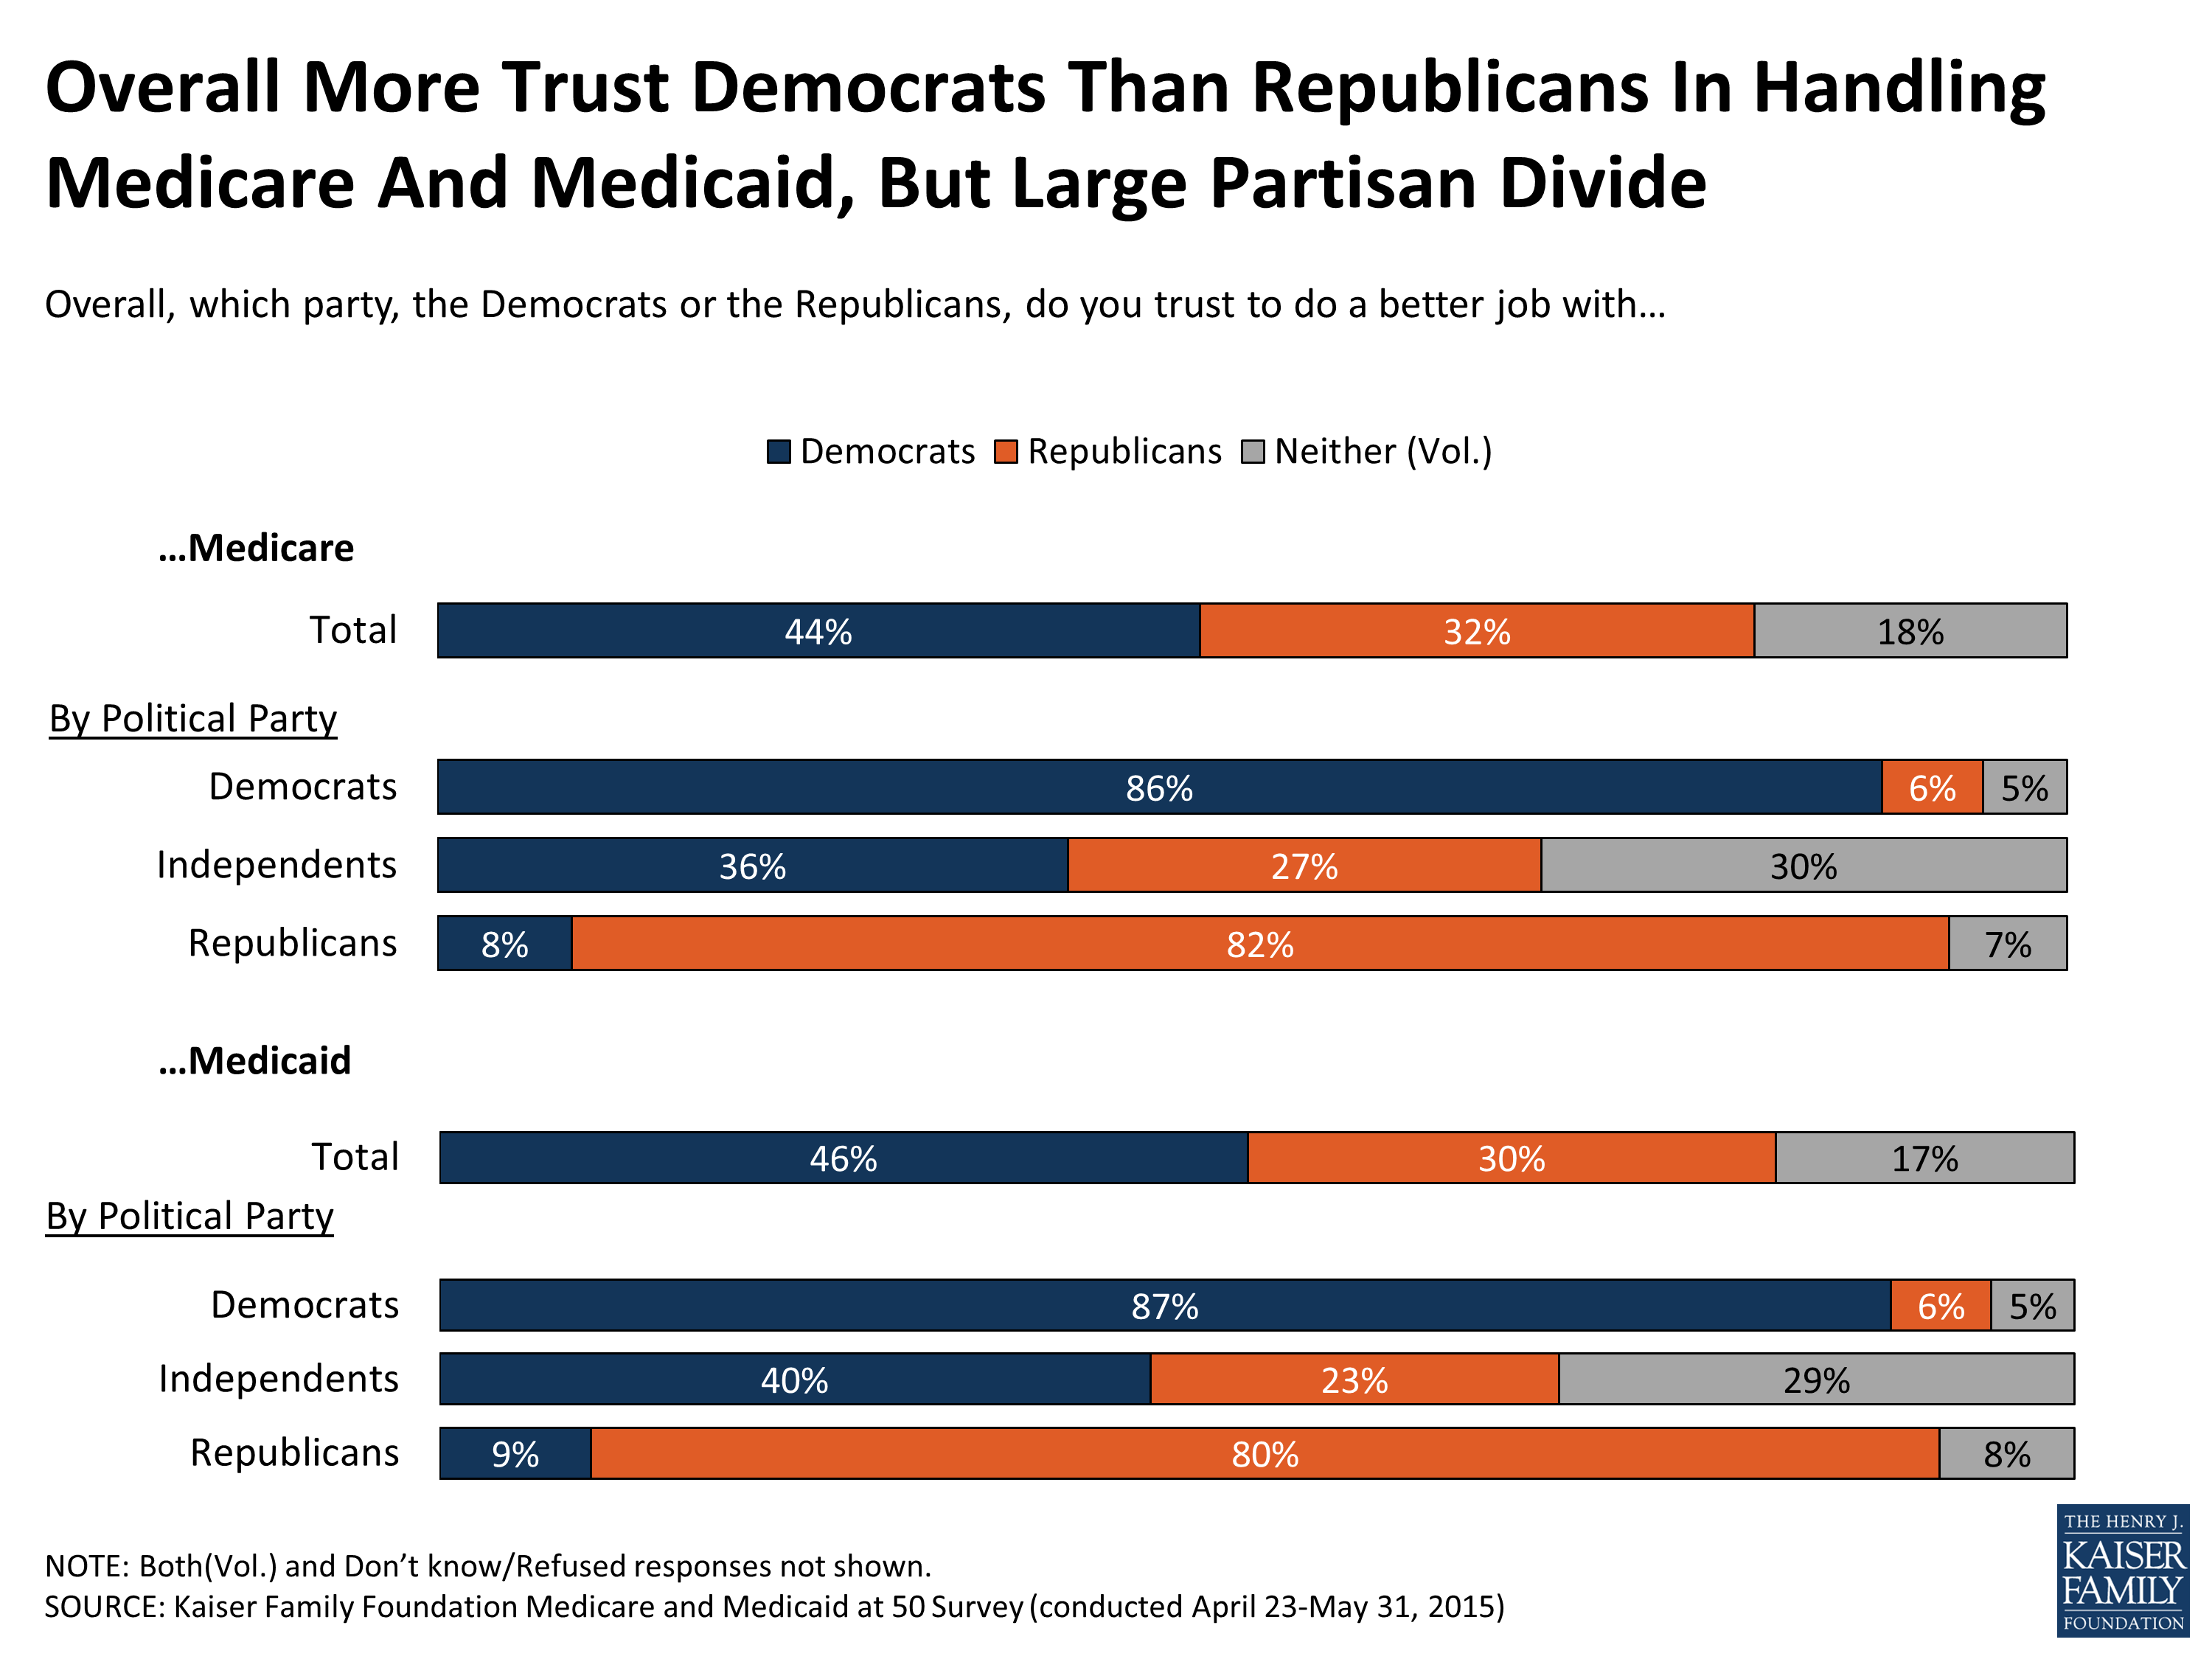
Figure 18
Section 4: Experiences With Medicare And Medicaid
This survey also explores the experiences of those currently enrolled in Medicare and Medicaid, including how financially protected they feel by their insurance, and what difficulties, if any, they’ve experienced with their coverage. Although most report few problems with their coverage, some report difficulty affording and accessing medical care. These findings often reflect the different groups of people covered by the programs. For example, those with employer-sponsored insurance tend to have higher incomes, while by definition, those with Medicaid have lower incomes and seniors covered by Medicare tend to have lower incomes as well.
Most Report Positive Experiences With Medicare And Medicaid And Feel Well-Protected
Overall, roughly nine in ten people covered by Medicare (91 percent) and Medicaid (86 percent) say their experiences with their health insurance has been positive, similar to the 87 percent of those with coverage through an employer who say the same. Echoing largely positive experiences with their plans, more than eight in ten people covered by Medicare and Medicaid say they feel well-protected by their health insurance coverage, including roughly four in ten who say they feel very well-protected.
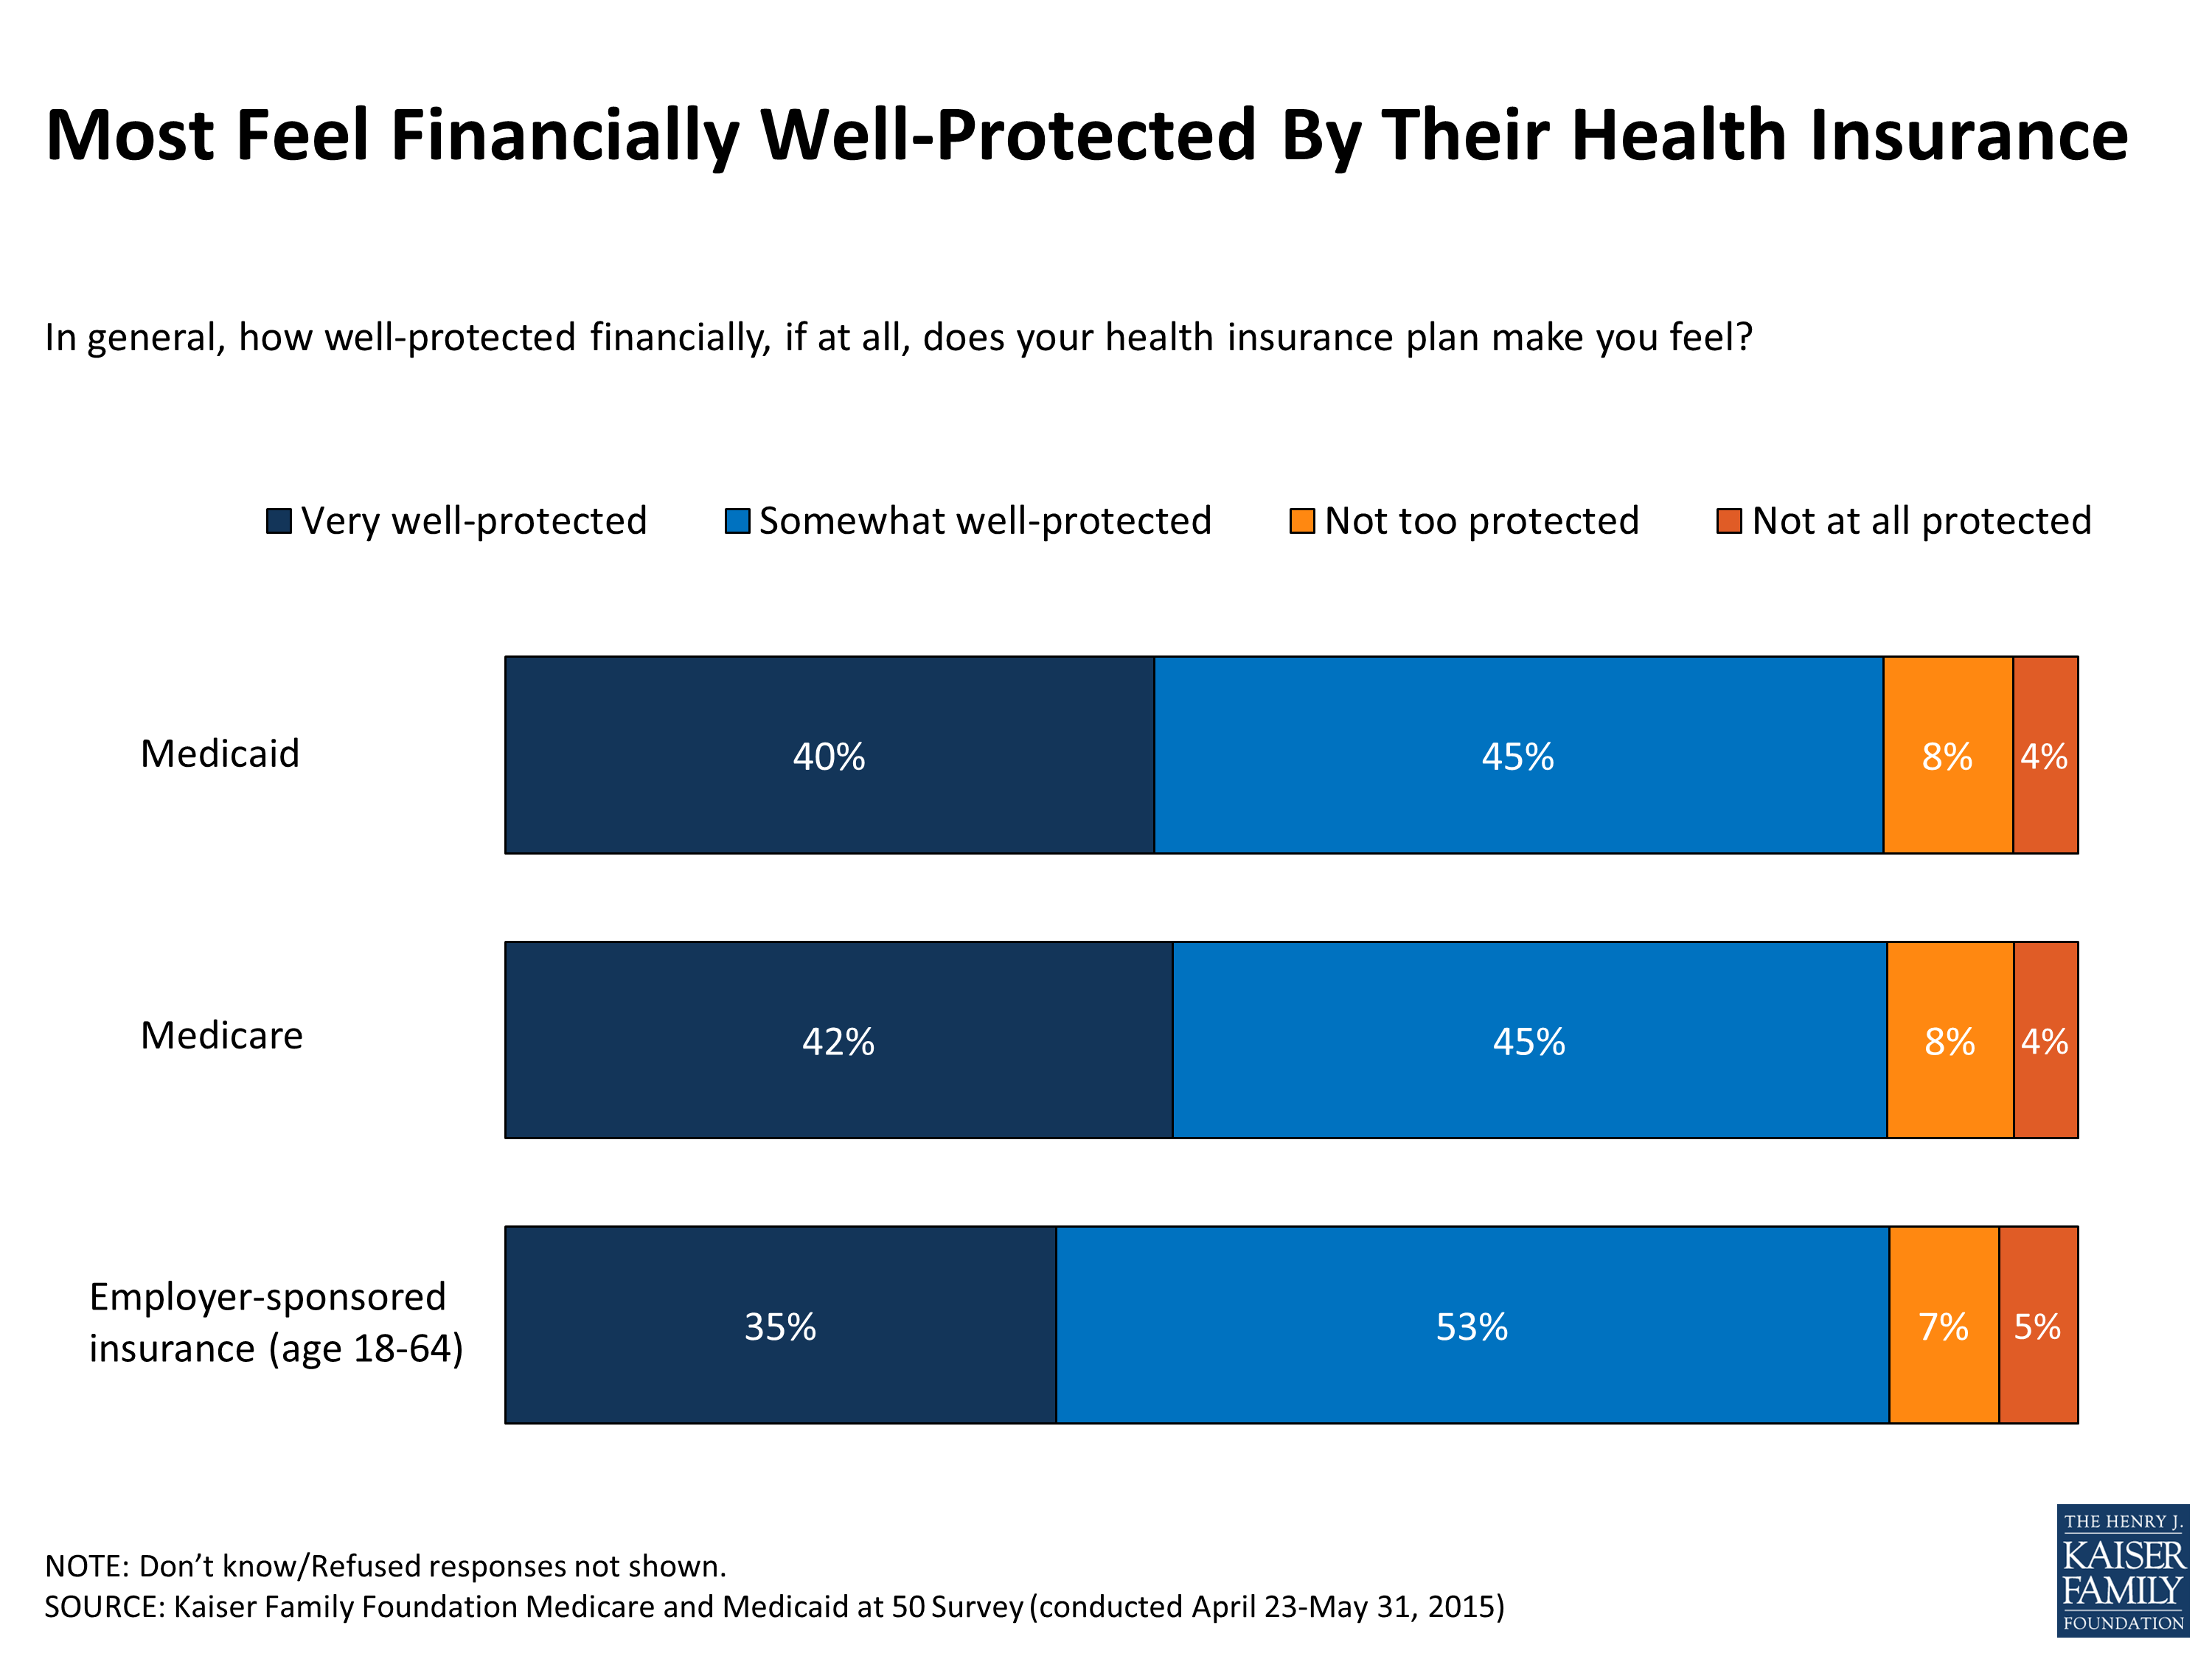
Figure 19
Some Report Financial Hardships
Although many feel well-protected, some report financial hardships. Reflective of the fact that people served by these programs have relatively low incomes, one in five current Medicaid enrollees (19 percent) and one in seven people currently covered by Medicare (14 percent) say that in the past 12 months they or a family member have spent less money on food, heat, or other basic needs so that they would have enough money to pay for health care. More than one in four without insurance in the past year say they or a family member have had to sacrifice basic needs in order to pay for health care, and about one in ten with employer-sponsored coverage say the same.
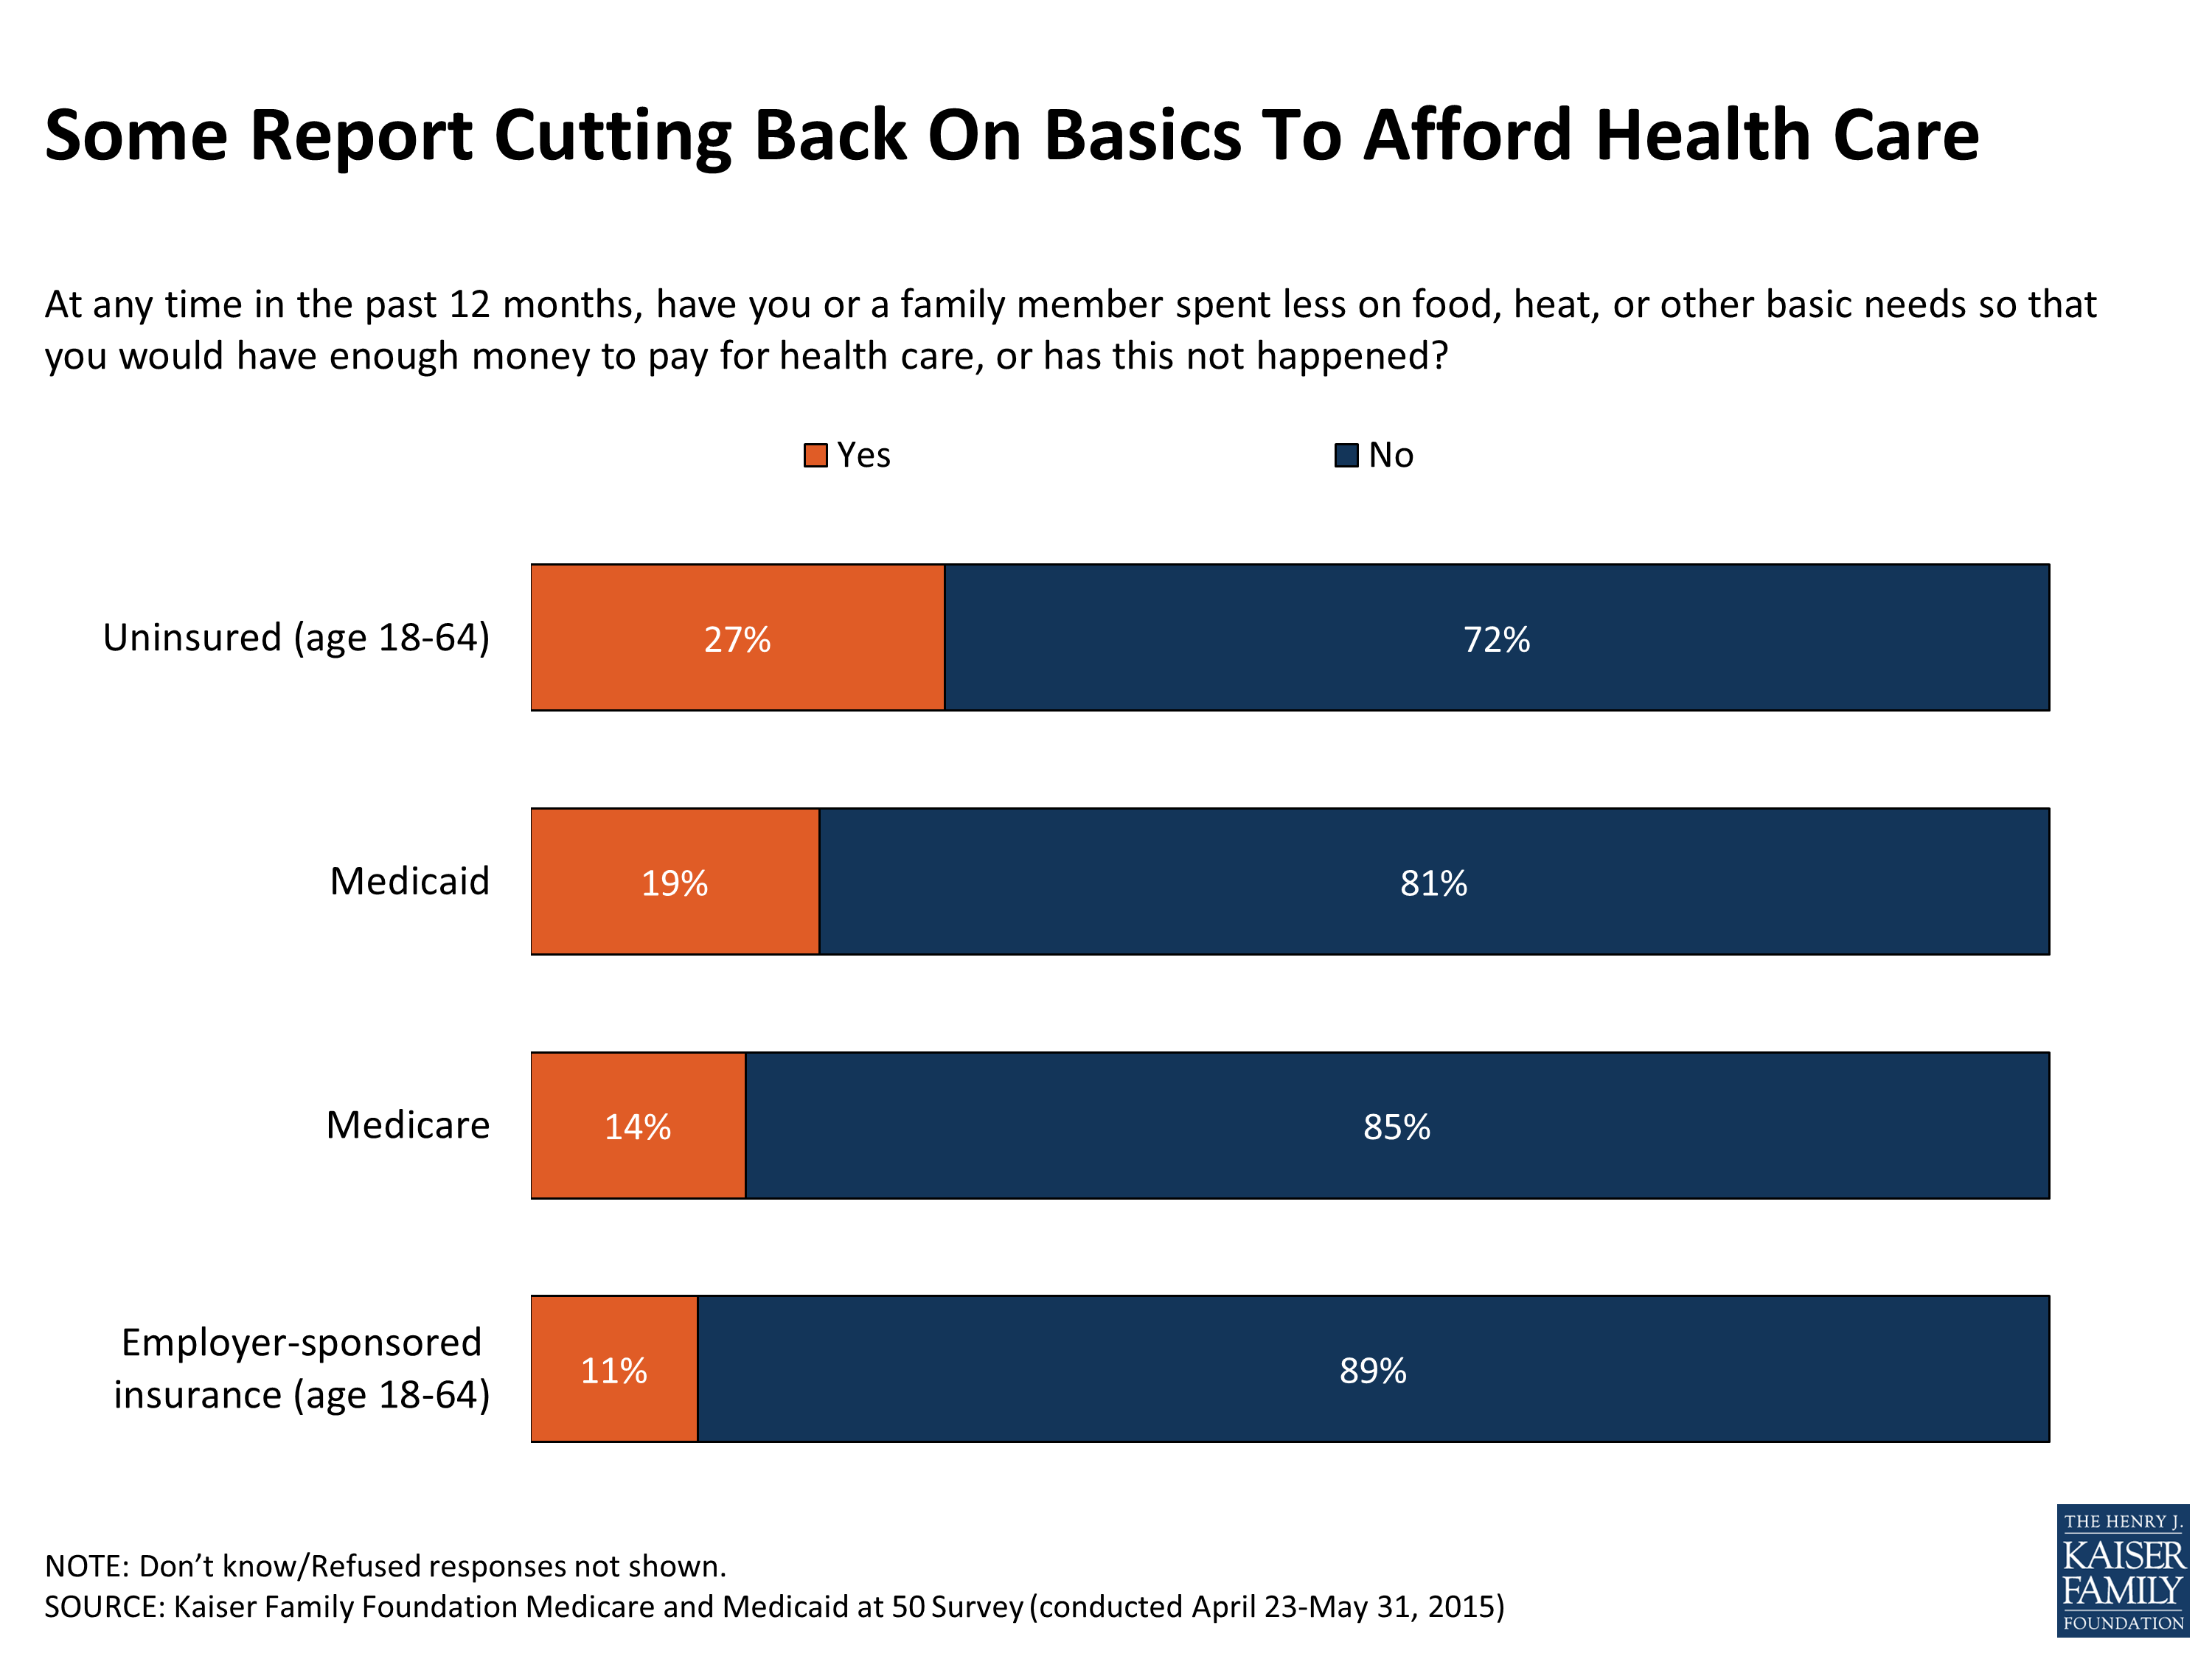
Figure 20
Six percent of both those covered by Medicare and those with employer-sponsored insurance say they’ve had problems paying their insurance premiums in the past 12 months.7 Larger shares say they’ve had problems paying for other health care costs, including about one in five Medicare beneficiaries and one in six with employer-sponsored insurance. People with Medicaid pay little or no costs for health care services covered by the program and, as their incomes change throughout the year, they may move on and off Medicaid more frequently than those with other types of insurance. More than one in five current Medicaid enrollees report that they have had problems paying health care costs in the past 12 months. Some of those reporting problems paying for care may have had trouble paying for services not covered by their health insurance or during a period in the past year when they did not have their current insurance.
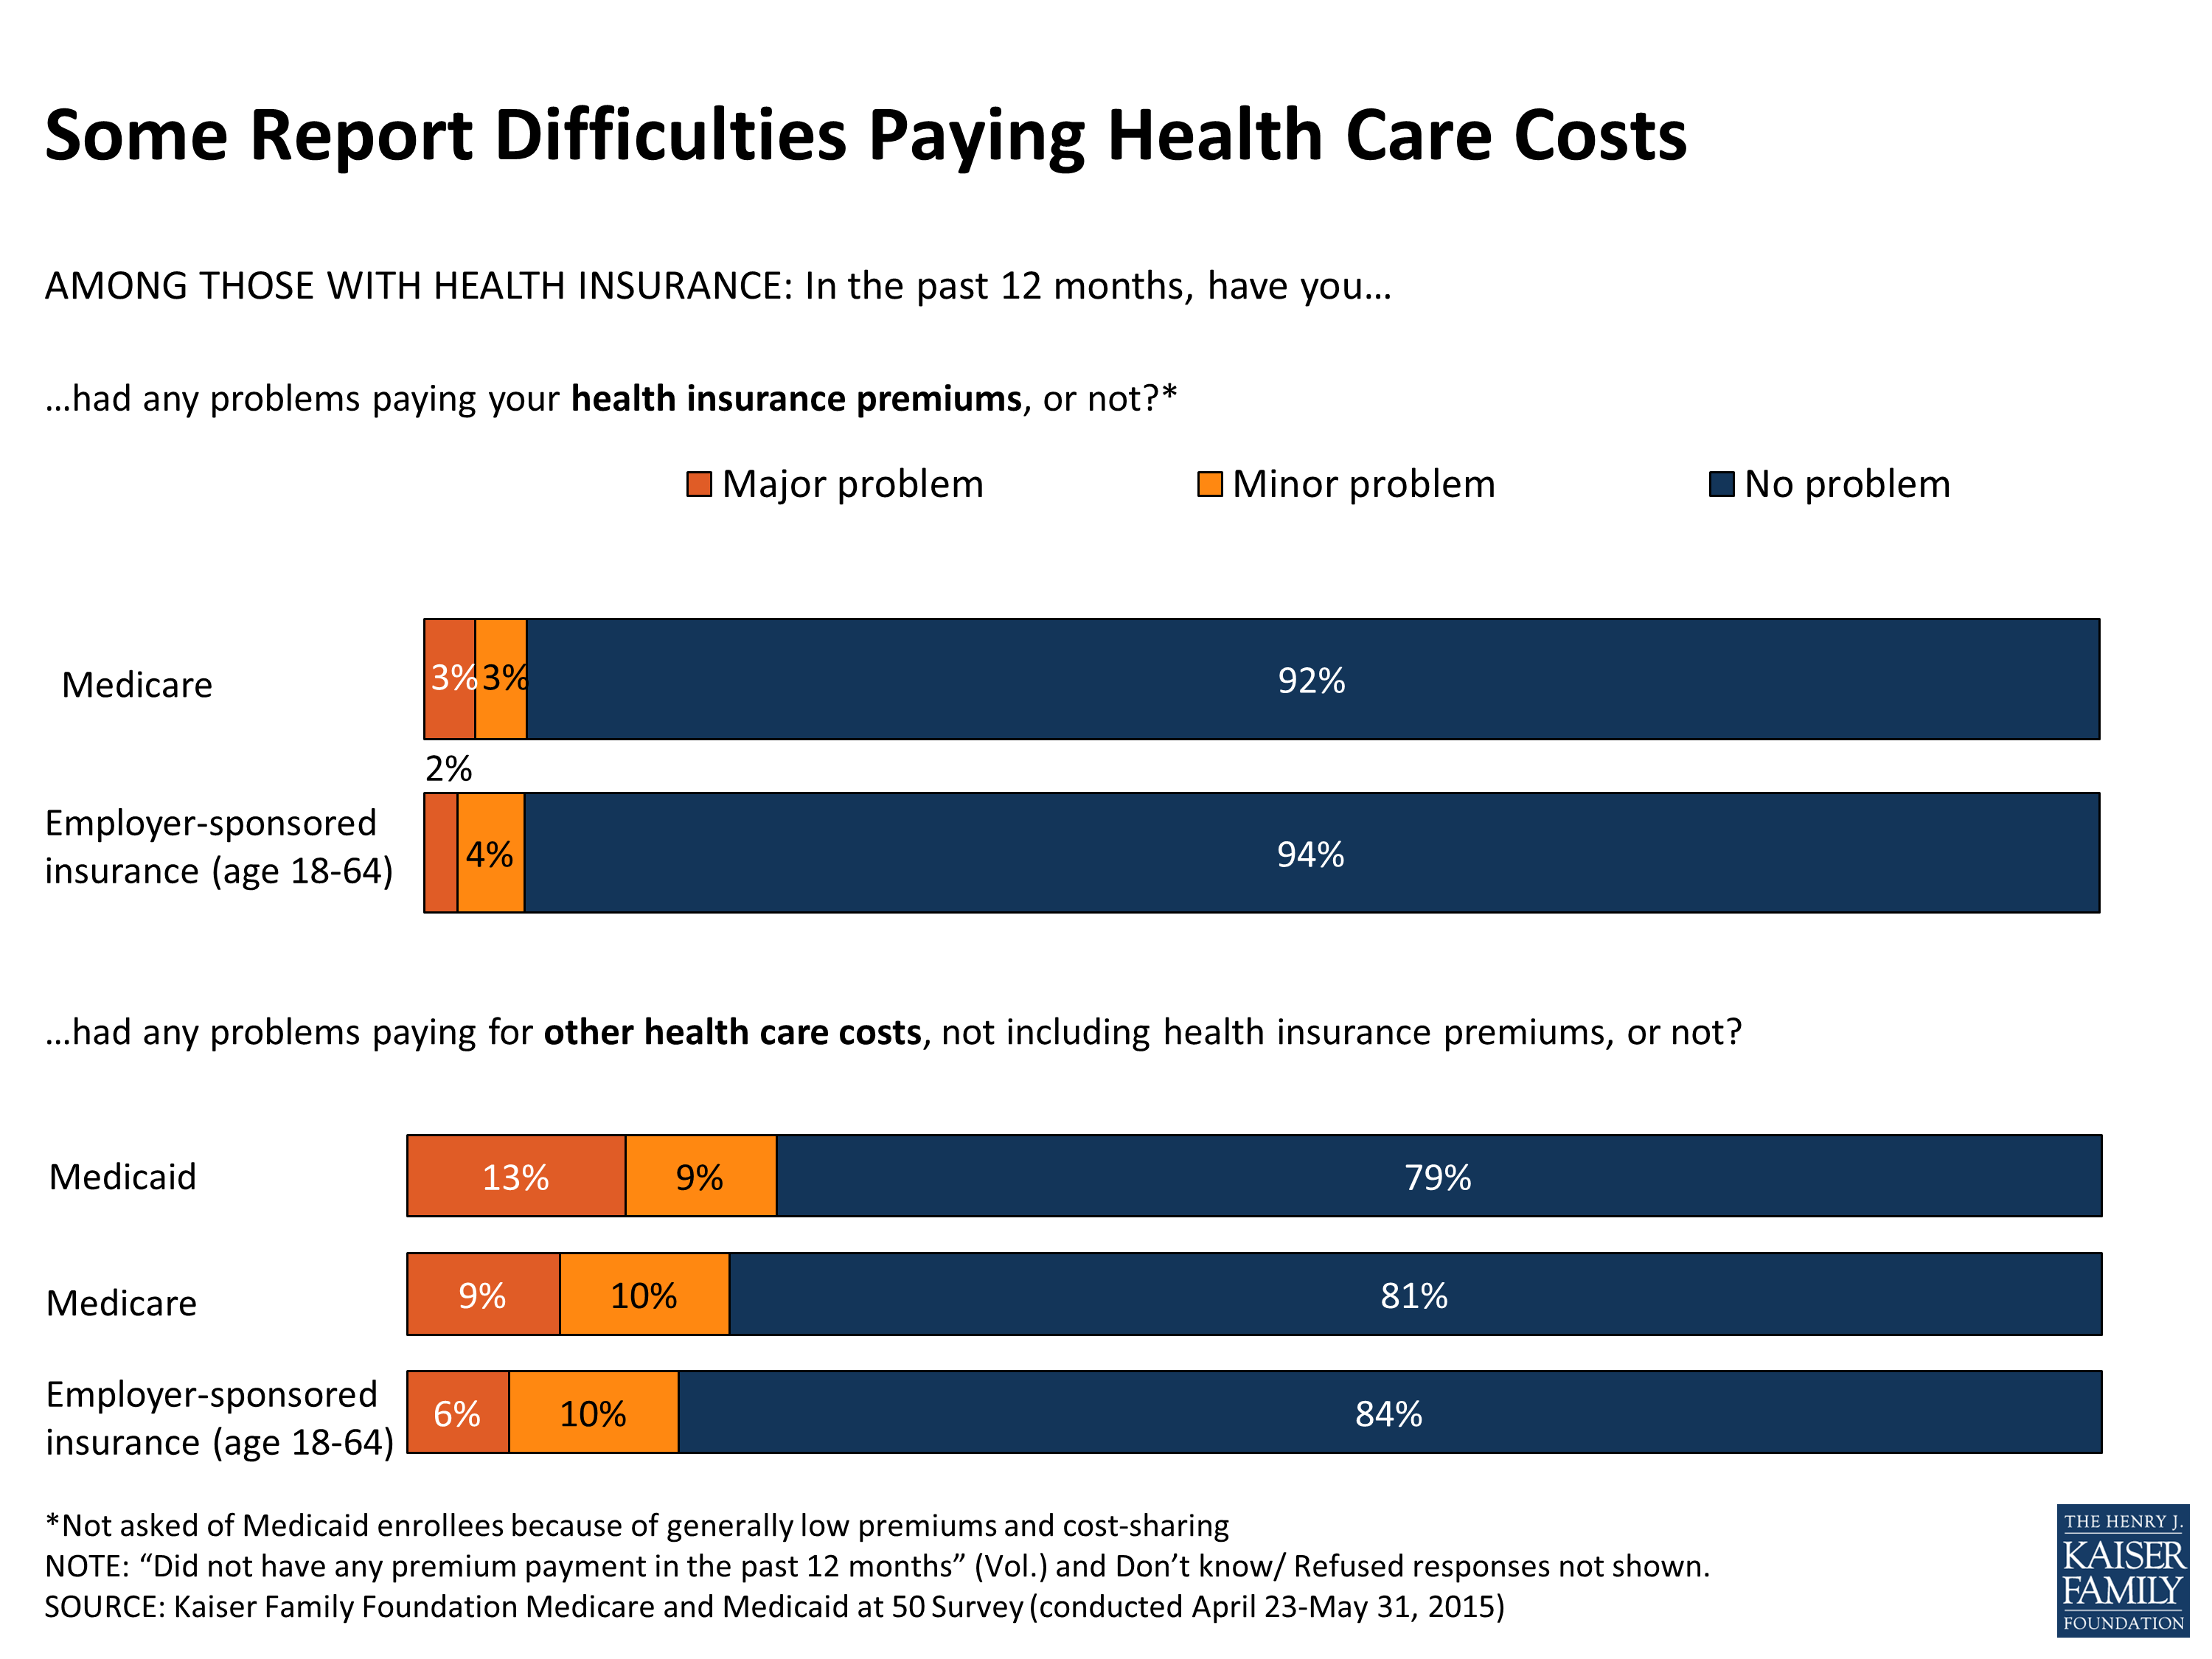
Figure 21
Some Report Problems With Coverage Or Finding Providers
Some insured Americans report difficulty getting their health insurance to pay for care, finding a provider willing to accept their insurance, or getting a referral or appointment to see a specialist. Those with Medicaid are more likely to say they’ve had each of these problems than those with Medicare or employer-sponsored coverage. Nearly a quarter (23 percent) of those with Medicaid report trouble finding a health care provider willing to accept their insurance, compared to about one in ten among those with employer-sponsored insurance or Medicare (9 percent each). More than a third of Medicaid enrollees (37 percent) report having any problems with their coverage, compared to roughly one in five people either covered by Medicare (18 percent) or an employer-sponsored plan (20 percent).
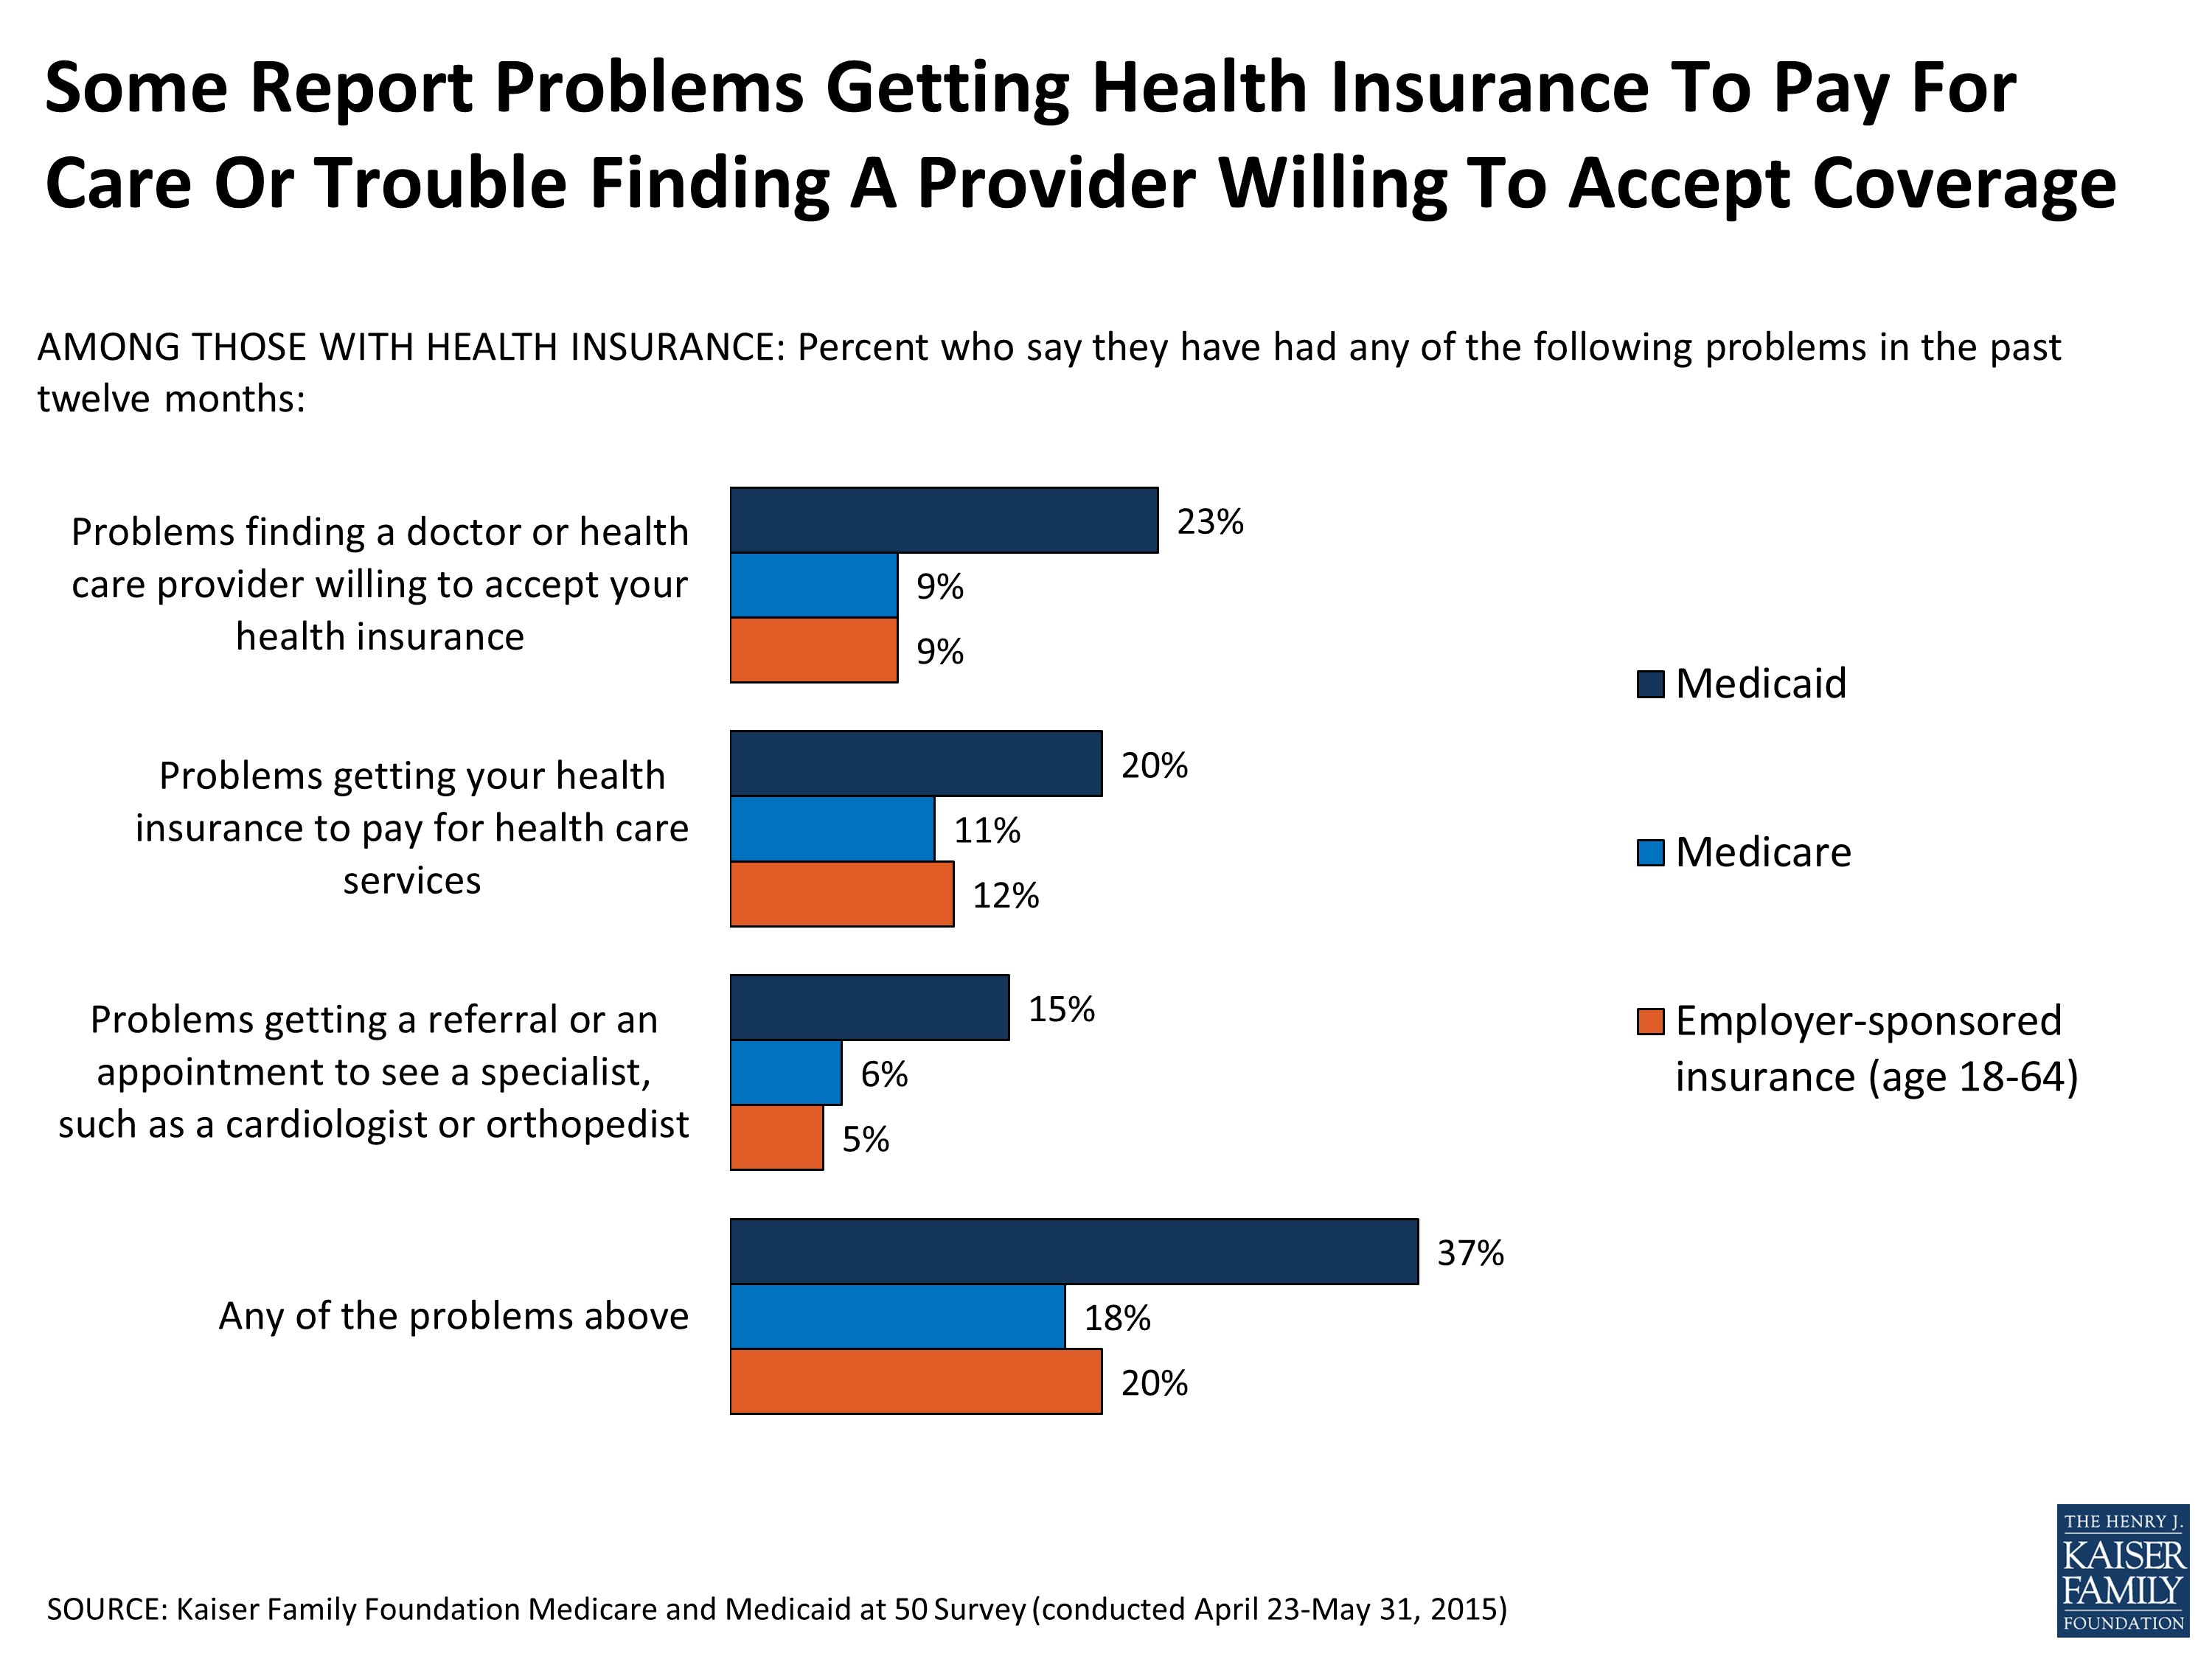
Figure 22
Costs Remain A Barrier To Care, Especially For Uncovered Services
Although large shares say that they haven’t experienced certain barriers to care, still 13 percent of people with Medicaid, and 9 percent of people covered by Medicare, as well as 10 percent of people with employer coverage say that in the past 12 months they’ve delayed or gone without doctor visits because of the cost.
Coverage for dental, vision, and hearing aids is often not included or limited in Medicare, Medicaid and private insurance. Although sometimes covered by Medicare Advantage plans, they are not required benefits, and when plans do offer coverage, it is generally modest. As such, higher shares report delaying or going without dental services, including about three in ten Medicaid enrollees (31 percent) and roughly one in five covered by Medicare (23 percent) or employer-sponsored insurance (19 percent). Similar shares say the same about delaying getting vision care, eyeglasses or hearing aids because of the cost. Fewer Medicare beneficiaries report delaying or foregoing these services because of the cost, compared to those enrolled in Medicaid.
Those without health insurance are particularly vulnerable to cost-related access problems, with more than half (53 percent) saying they’ve had to delay dental care because of the cost, and four in ten (42 percent) saying they’ve had to delay a doctor visit (42 percent) or delay getting eyeglasses or hearing aids (38 percent).
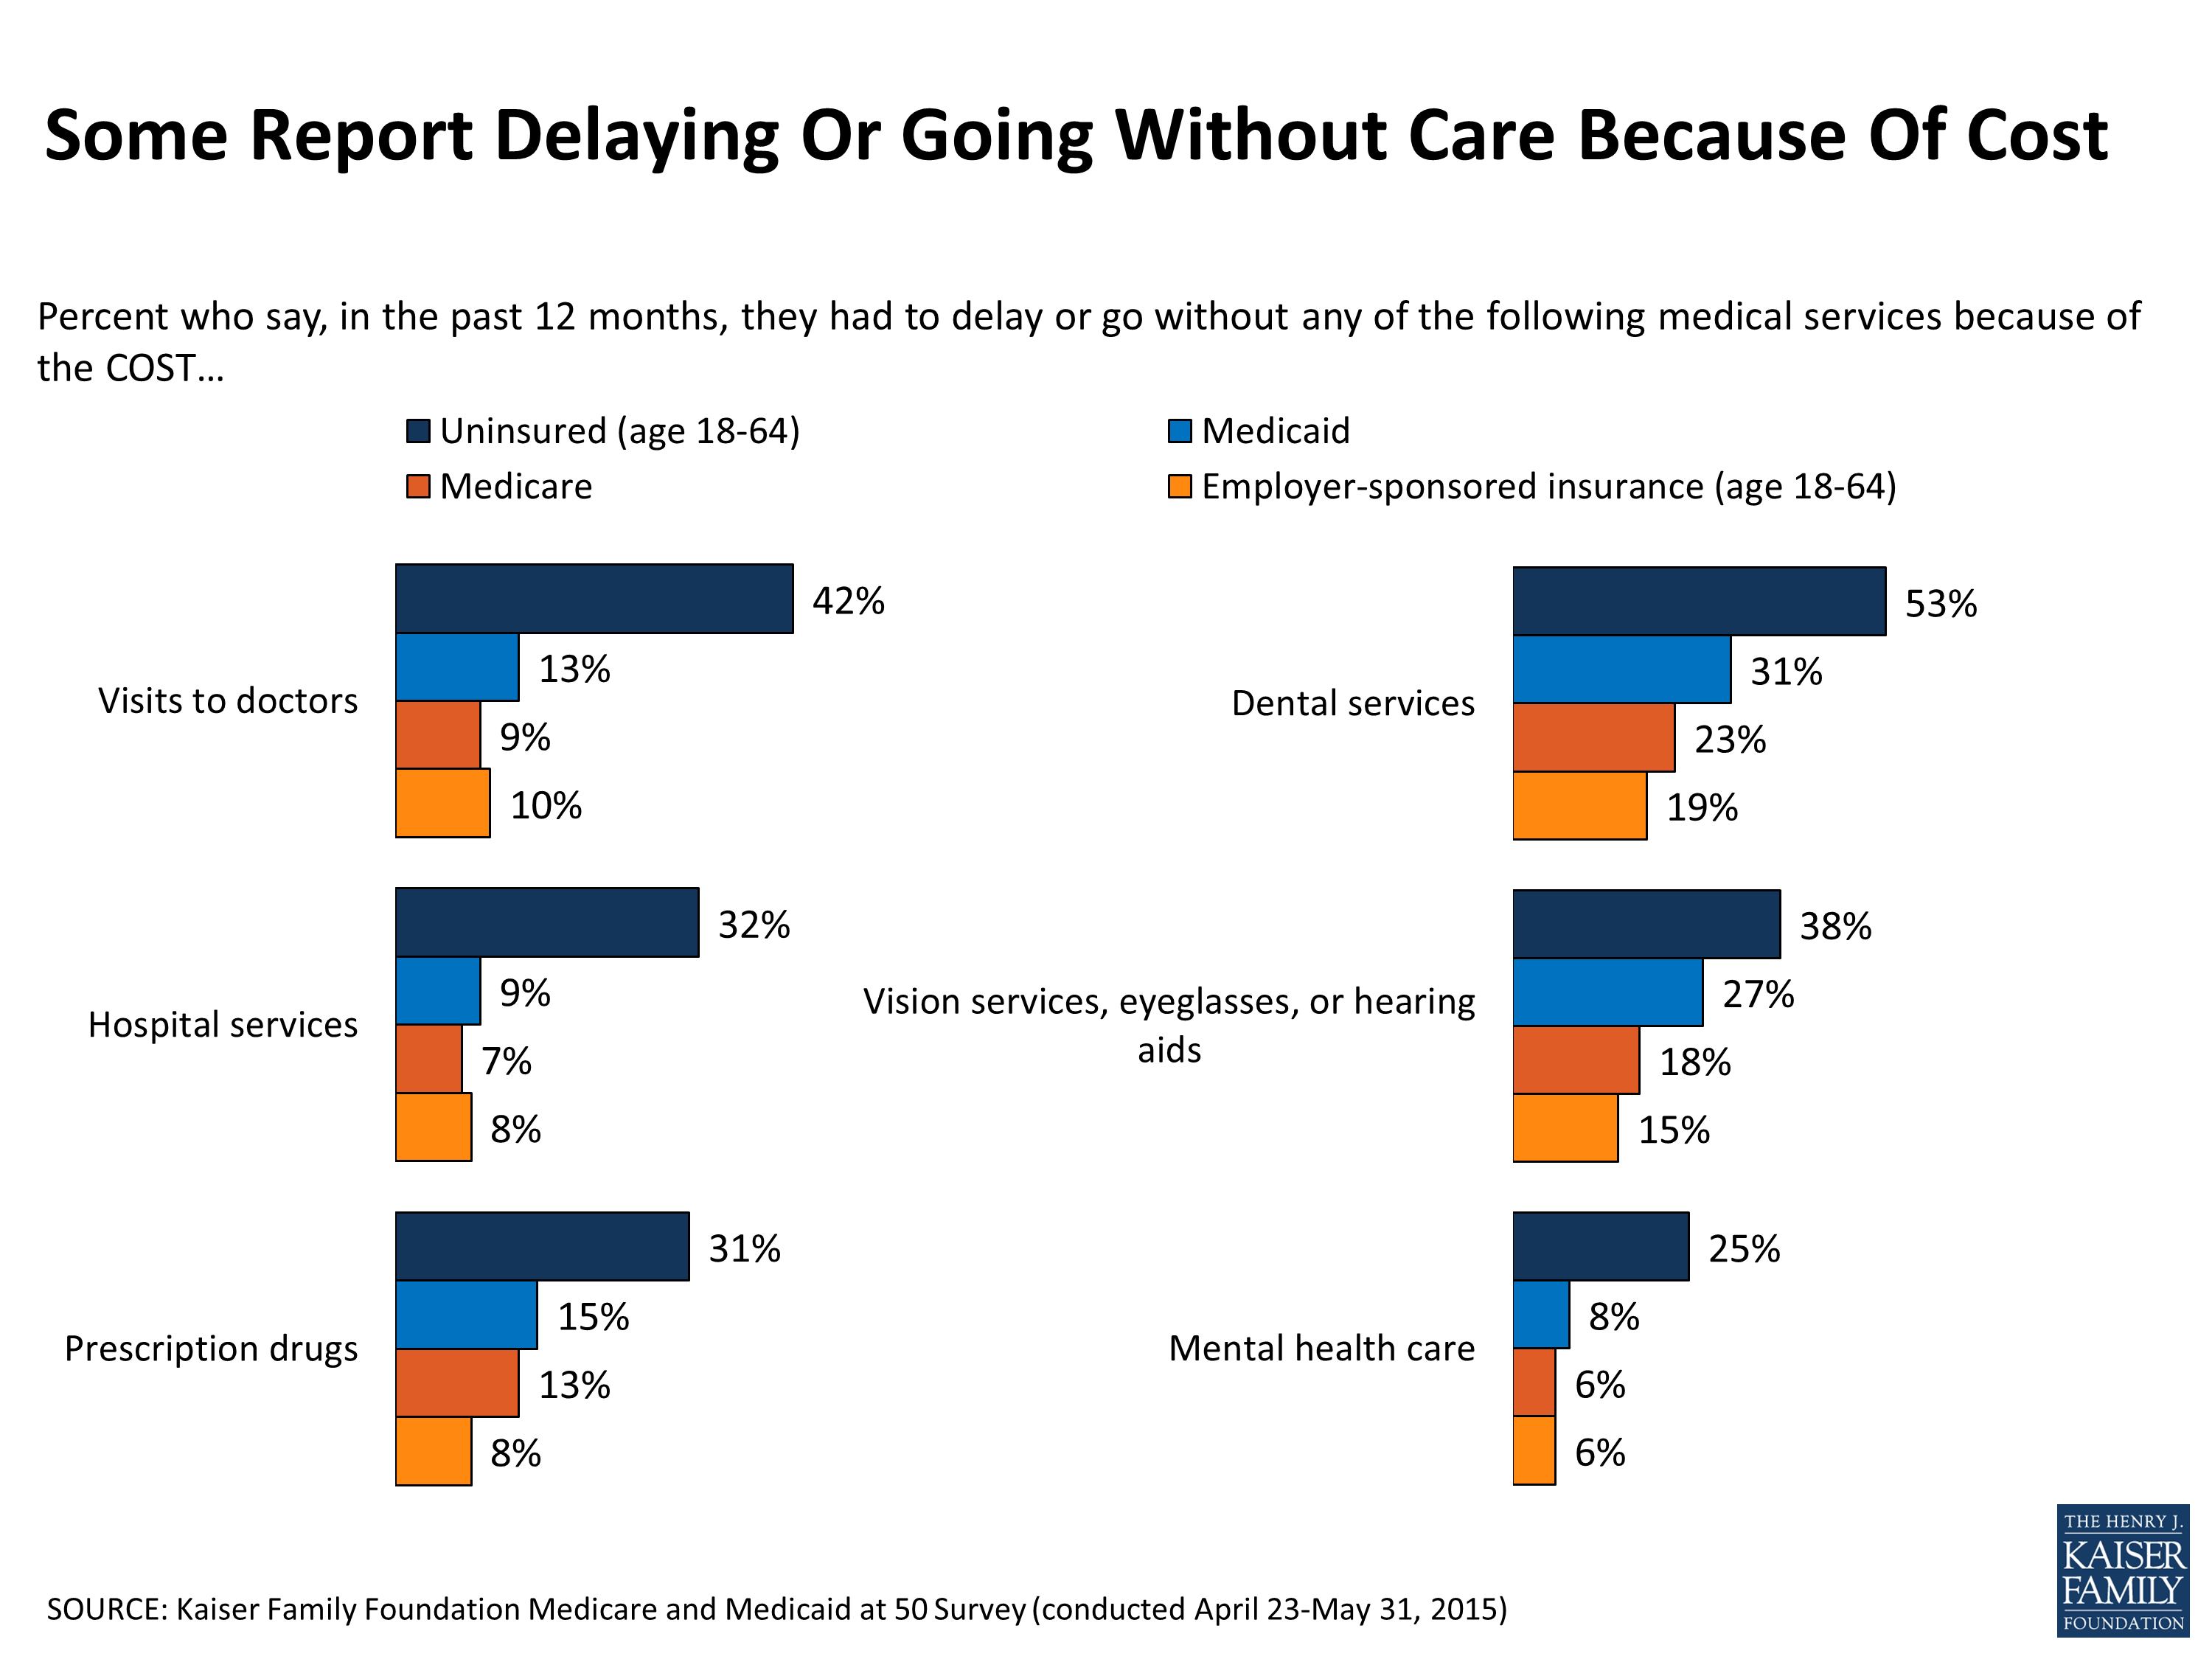
Figure 23
Problems And Affordability Relate To Views Of The Programs
The experiences of those covered by Medicare and Medicaid are linked to their opinions of them. Although relatively small shares overall, people with Medicare or Medicaid who say they’ve had problems with their insurance in the past 12 months are more critical of how well the programs are working. As a group, they are less likely to say each program is working well, although no less likely to express its importance.
Medicare beneficiaries who report experiencing problems with affordability8 (28 percent of those covered by Medicare) say Medicare is not working well at about twice the rate as other Medicare beneficiaries. For instance, about four in ten (41 percent) beneficiaries with affordability issues say the program is not working well, compared to just 14 percent of those who do not report affordability issues. A similar pattern holds for those who report delaying care due to cost or experiencing problems with their coverage such as trouble accessing providers or with covered services.
Looking specifically at Medicaid enrollees, those who say they have had problems affording care (31 percent of those covered by Medicaid) are much more likely than those who don’t report problems to say the Medicaid program is not working well for most low-income people (45 percent versus 20 percent). Similarly, among those covered by Medicaid who report problems with their health coverage (37 percent) or having to delay getting care because of the cost (46 percent), about four in ten say Medicaid is not working well, compared to closer to two in ten who don’t report difficulties.
| Views Among People Covered By The Programs Who Report Problems | |||
| Percent of people covered by Medicare in each group who say Medicare is working well for most seniors | |||
| Yes, working well | No, not working well | Don’t know | |
| Problems affording care in past 12 months | |||
| Any problems (28 percent) | 58% | 41% | 1% |
| No problems (72 percent) | 82% | 14% | 4% |
| Problems accessing providers or with covered services in past 12 months | |||
| Any problems (18 percent) | 59% | 39% | 2% |
| No problems (82 percent) | 78% | 18% | 4% |
| Delay in care in past 12 months | |||
| Any delay (32 percent) | 61% | 35% | 4% |
| No delay (68 percent) | 82% | 15% | 3% |
| Percent of people covered by Medicaid in each group who say Medicaid is working well for most low-income people | |||
| Yes, working well | No, not working well | Don’t know | |
| Problems affording care in past 12 months | |||
| Any problems (31 percent) | 50% | 45% | 6% |
| No problems (69 percent) | 73% | 20% | 7% |
| Problems accessing providers or with covered services in past 12 months | |||
| Any problems (37 percent) | 55% | 37% | 8% |
| No problems (63 percent) | 71% | 23% | 6% |
| Delay in care in past 12 months | |||
| Any delay (46 percent) | 60% | 37% | 3% |
| No delay (54 percent) | 70% | 20% | 10% |
Conclusion
Medicare and Medicaid are government financed programs largely valued by the general public and many say they are personally important because of the role they play in providing coverage for seniors, adults with disabilities and those with low-incomes. Many say the programs are working well, however the minority of people who report difficulties paying for care or accessing services are more likely to say the programs are not working well, demonstrating some of the ongoing challenges the programs face. Over the last 50 years, the programs have changed and evolved and are often the subject of political controversy as lawmakers debate who and what the programs should cover as well as how they should be financed. While the public generally would like to see federal spending on the programs increase or stay the same and prefers the status quo over restructuring the programs, policymakers must grapple with competing priorities and visions for the nation’s health care system that can sometimes be at odds with the public’s preferences.