Medicaid Restructuring Under the American Health Care Act and Nonelderly Adults with Disabilities
Issue Brief
Key Takeaways
This brief describes Medicaid’s role for nearly 7 million nonelderly adults with disabilities living in the community to help inform the debate about the American Health Care Act’s proposals to end enhanced federal funding under the ACA and reduce federal Medicaid funding under a per capita cap.
Medicaid covers more than three in 10 nonelderly adults with disabilities, providing a broad range of medical and long-term care services that enable people with disabilities to live and work in the community.
- Over half of nonelderly Medicaid adults with disabilities live below the federal poverty level, and nearly 85% have incomes below 200% of poverty ($24,120/year for an individual in 2017).
- Nonelderly Medicaid adults with disabilities are four times as likely to receive nursing or other health care at home, more than 2.5 times as likely to have three or more functional limitations, and more than 1.5 times as likely to have 10 or more health care visits in a year compared to people with disabilities who are privately insured.
People with disabilities account for 15% of total Medicaid enrollment but 42% of program spending due to their greater health needs and more intensive service use.
Medicaid spending per enrollee for people with disabilities is substantially higher than for those without disabilities, due to their greater health needs and reliance on Medicaid for expensive but necessary services, especially long-term care in the community and nursing homes, that are generally unavailable through private insurance and too costly to afford out-of-pocket. Medicaid spending per enrollee for people with disabilities also varies substantially by state (from $10,142 in AL to $33,808 in NY in 2011).
Nonelderly adults with disabilities may be particularly affected by Medicaid changes in the American Health Care Act (AHCA), including the fundamental shift to per capita capped financing.
- Most Medicaid disability-related coverage pathways and community-based long-term care services are provided at state option, making them subject to cuts as states adjust to substantial federal funding reductions under a per capita cap. The CBO estimates that the AHCA will reduce Medicaid spending by $880 billion from 2017 to 2026.
- The AHCA also would end enhanced federal funding for the ACA’s Medicaid expansion, which covers some nonelderly adults with disabilities, and Community First Choice attendant care services for people with disabilities, which could jeopardize states’ ability to continue to finance these options.
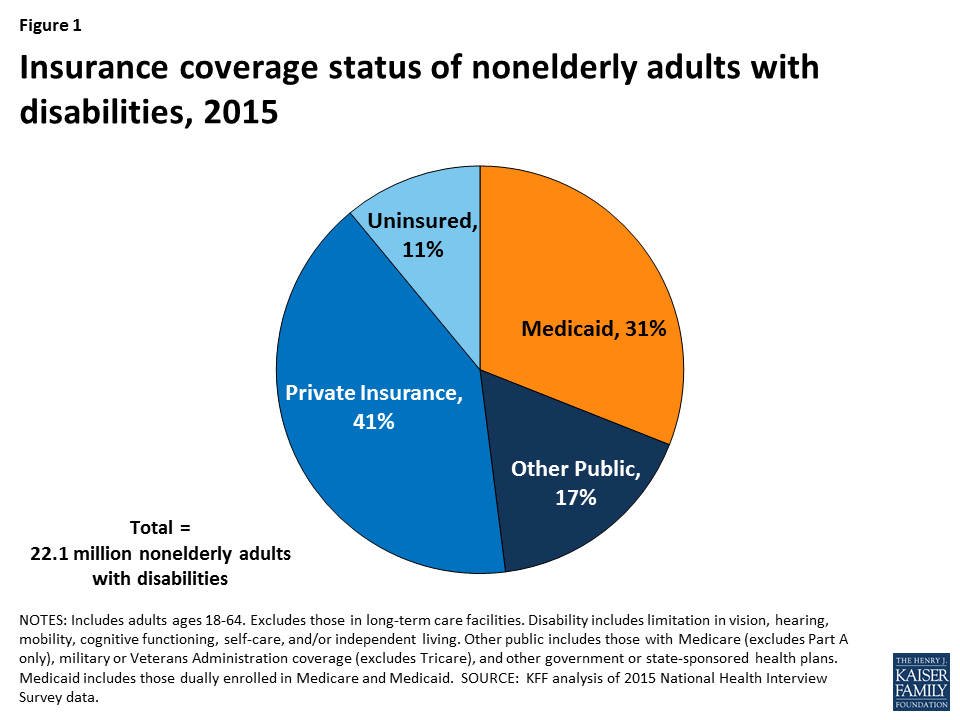
Over 22 million nonelderly adults, or 12% of adults ages 18 to 64, living in the community in the United States have a disability as of 2015.1 They include people with physical disabilities, such as cerebral palsy, multiple sclerosis, and traumatic brain or spinal cord injuries; intellectual or developmental disabilities (I/DD), such as Down syndrome and autism; and mental illness. Some people live with a disability from birth or childhood, while others have a disability onset later in life resulting from an injury or chronic illness. Medicaid plays an important role by providing health insurance coverage for more than one in three nonelderly adults with disabilities (Figure 1).
The House American Health Care Act bill calls for changes to Medicaid that could affect nonelderly adults with disabilities. Some nonelderly adults with disabilities have gained Medicaid eligibility through the ACA’s expansion, and the House bill calls for eliminating the expansion’s enhanced federal matching funds.2 The House bill also contains changes to Medicaid’s financing structure in ways that would limit federal funding through a per capita cap. While states could be offered increased flexibility beyond what is available under current law in future legislation, states may look to cuts in Medicaid eligibility, benefits, and provider reimbursement as a result of the associated federal funding reductions. People with disabilities have higher Medicaid spending relative to other populations due to their greater health needs and more intensive service use. Nonelderly adults with disabilities could be particularly affected by potential cuts, as many of them rely on Medicaid coverage pathways and services that are offered at state option. This issue brief describes the role that Medicaid plays for nonelderly adults with disabilities. The appendix table contains per enrollee spending and take-up of selected eligibility and service options relevant to nonelderly adults with disabilities by state.
Background
The U.S. Census Bureau defines a disability as a limitation in vision, hearing, mobility, cognitive functioning, self-care, and/or independent living. Self-care includes activities such as bathing and dressing. Independent living includes the ability to move around the community, such as visiting a doctor’s office or going shopping. People with disabilities have a range of medical and long-term care needs as a result of functional limitations. They may need attendant care for help with getting out of bed, bathing, dressing, and eating; assistive technology such as power wheelchairs and speech generating devices; medical equipment and supplies; mental health counseling; and/or supportive services to maintain community-based housing or employment.
What Type of Health Insurance Do Nonelderly Adults with Disabilities Have?
Among people who are working, nonelderly adults with disabilities are significantly less likely to have a job that offers health insurance compared to those without disabilities (Figure 2). Overall, nonelderly adults with disabilities are about half as likely to be working for pay than those without disabilities. The ability of nonelderly adults with disabilities to work likely is limited as a result of their greater health needs and functional limitations, although with appropriate supports, many people with disabilities can and do work. However, among those who are working, nonelderly adults with disabilities are significantly less likely to be working full-time and to have access to employer-sponsored health insurance.

Non-elderly adults with disabilities are significantly more likely to have Medicaid and significantly less likely to have private insurance than those without disabilities (Figure 3). Those with disabilities are about three times as likely to be covered by Medicaid and about half as likely to have private insurance compared to those without disabilities. These differences are influenced by the greater health needs of people with disabilities and the fact that they are less likely to have access to employer-sponsored coverage. Nonelderly adults with disabilities also are significantly less likely to be uninsured than those without disabilities, reflecting the important role that Medicaid plays in covering this population.

How Do Nonelderly Adults with Disabilities Qualify for Medicaid?
Some nonelderly adults with disabilities are eligible for Medicaid through the ACA’s Medicaid expansion, based solely on their low income, in the 32 states (including DC) that have adopted the expansion as of 2017.3 The ACA expands Medicaid eligibility to nearly all nonelderly adults with income up to 138% FPL ($16,643/year for an individual in 2017) without an asset limit and provides enhanced federal matching funds for states to cover this group.4 Although having a disability is not required to qualify for Medicaid under the ACA’s expansion or other poverty-related pathways, more than three in 10 (35%) Medicaid adults who are not working report that they have an disability or illness. People with disabilities may receive Medicaid as expansion adults while they are waiting for a disability determination, which can take a substantial amount of time, or they may have a disability that does not meet Supplemental Security Income (SSI) medical criteria but is nonetheless limiting, or they may not financially qualify for SSI.5 Some expansion adults with disabilities are working, and a recent study found that working-age adults with disabilities are significantly more likely to be employed if their state has adopted the Medicaid expansion, compared to states that have not expanded.6
Some nonelderly adults with disabilities qualify for Medicaid through a disability-related pathway based on both their low income and functional limitations (Figure 4).7 All states generally must provide Medicaid to SSI beneficiaries, although this pathway does not include all people with disabilities. Only 36% of nonelderly Medicaid adults with disabilities receive SSI,8 meaning that nearly 2/3 of nonelderly Medicaid adults with disabilities qualify through another pathway. States can choose to extend Medicaid financial eligibility for people with disabilities up to 100% of the federal poverty level (FPL, $12,060 for an individual in 2017). In addition, states can expand financial eligibility for people who need long-term care services, in nursing homes and/or in the community, up to three times the SSI benefit rate (equivalent to 219% FPL or $26,460/year for an individual in 2017). States also can allow working people with disabilities at higher incomes to buy into Medicaid coverage by paying a premium. The disability-related pathways also generally have asset limits set by the state, which typically are at the SSI level of $2,000 for an individual.

What are the Characteristics of Non-Elderly Adults with Disabilities Receiving Medicaid?
Nonelderly adults with disabilities who receive Medicaid have very low incomes, with more than half living below the federal poverty level (Figure 5). Nearly 85% of nonelderly Medicaid adults with disabilities have incomes below 200% FPL (less than $24,120/year for an individual in 2017). Their low incomes reflect the fact that people with disabilities generally are poorer than those without disabilities as well as the low income eligibility limits associated with the Medicaid program. Nearly six in 10 nonelderly adults with disabilities receiving Medicaid are white, about one-quarter are black, and 16% are Hispanic. Just under three in 10 are between ages 55 to 64, and another three in 10 are between ages 45 to 54. About one-fifth are between ages 35 to 44, and one-quarter are ages 18 to 34.

Nonelderly adults with disabilities who receive Medicaid are significantly more likely to have multiple functional limitations compared to people with disabilities who have private insurance or those who are uninsured (Figure 6). About one-third of nonelderly Medicaid adults with disabilities have three or more functional limitations, more than two and one-half times the rate of privately insured nonelderly adults with disabilities and more than double the rate for those who are uninsured. By contrast, nonelderly Medicaid adults with disabilities are significantly less likely to have limited functioning in only one area compared to those who are privately insured. For an example of a Medicaid beneficiary with multiple functional limitations, see Nicholas’s story below.

| Nicholas, age 33, North Carolina | |
| Nicholas was diagnosed with multiple sclerosis at age 29, and the disease is advancing. He cannot walk more than a few feet, his hearing and vision are impaired, and he has difficulty using his hands. He experiences a lot of pain on a daily basis. Medicaid covers the medications he takes to control symptoms, doctor visits, and his power wheelchair. Nicholas lives in an apartment that is physically inaccessible, and he was injured after a fall when he was trying to transfer from the bathroom to his wheelchair. His Medicaid case plan includes help with making the shower accessible, home delivered meals, and a car hook-up for his power wheelchair so that he can more easily go out into the community. |  |
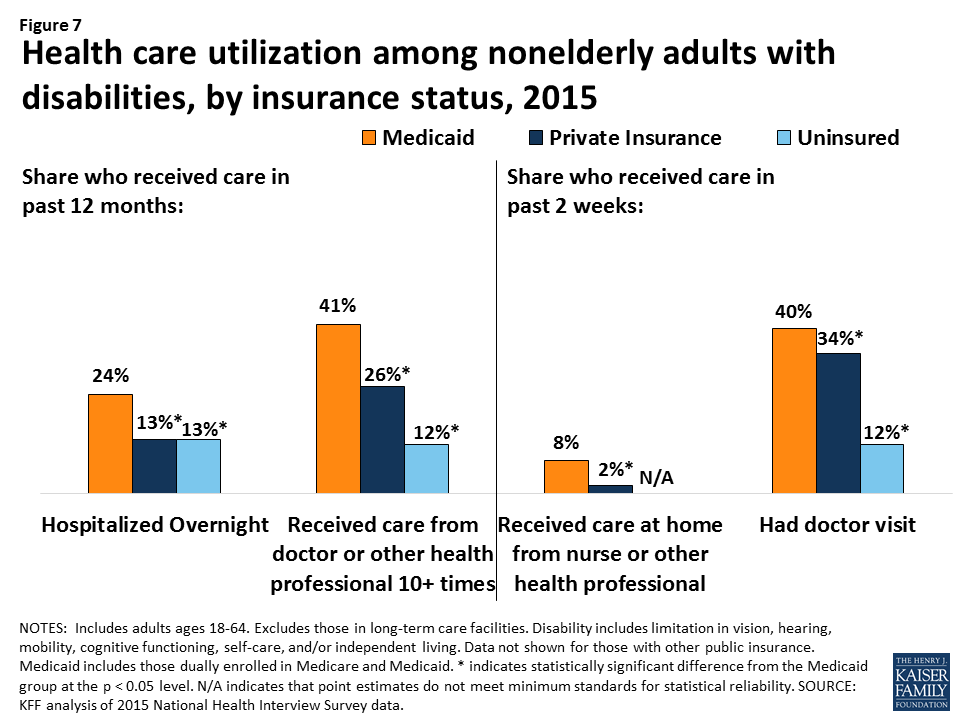
Nonelderly adults with disabilities receiving Medicaid are significantly more likely to use health care services than those with private insurance or those who are uninsured (Figure 7). They are four times as likely to receive nursing or other health care at home, nearly twice as likely to be hospitalized overnight, and more than one and one-half times as likely to have 10 or more health care visits in a year compared to those with private insurance. This increased utilization likely reflects their greater health needs and functional limitations as well as the fact that certain services, such as care at home, are more likely to be covered by Medicaid than by private insurance.
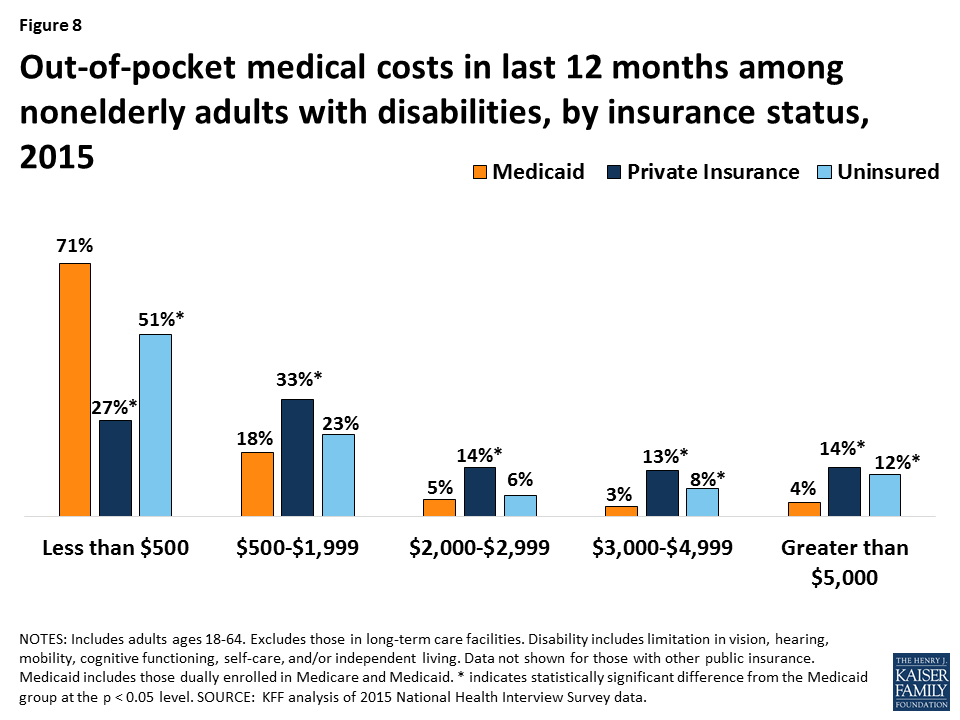
Nonelderly adults with disabilities receiving Medicaid are significantly more likely to have lower out-of-pocket medical costs compared to people with disabilities who are privately insured (Figure 8). Those with Medicaid are nearly three times as likely to incur costs of less than $500 per year compared to those with private insurance. Those with Medicaid also were more than three times less likely to have the highest out-of-pocket costs (more than $5,000/year) compared to those with private insurance. These differences are likely due to Medicaid’s cost-sharing rules, which are designed to protect people with low incomes from burdensome out-of-pocket costs, which can create financial barriers to receiving needed care. The lower out-of-pocket costs among people with Medicaid also reflect their low incomes. People with out-of-pocket medical expenses whose income exceeds Medicaid financial eligibility limits may become eligible for Medicaid through a “spend down’ by subtracting incurred medical expenses from their income.
What Services Does Medicaid Provide for Nonelderly Adults with Disabilities?
Medicaid covers a broad range of medical and long-term care services to meet the diverse needs of nonelderly adults with disabilities (Figure 9). Through Medicaid, nonelderly adults with disabilities have access to regular preventive care as well as medical care for illnesses and chronic conditions. States must provide certain minimum services for adults, such as inpatient and outpatient hospital, physician, lab and x-ray, and nursing home services. States also can choose to provide a broad range of optional services, many of which are important to people with disabilities, such as prescription drugs, physical therapy, private duty nursing, personal care, rehabilitative services, and case management. Most home and community-based services (HCBS) are provided at state option.9

Medicaid provides long-term care services that support people with disabilities’ ability to live independently and safely in the community. Medicaid is the primary payer for long-term services and supports and plays a key role in helping states finance services to meet their community integration obligations under the Americans with Disabilities Act and the Supreme Court’s Olmstead decision.10 Many of these services are unavailable through private insurance, and they are too costly for people to afford out-of-pocket, especially given the low incomes of most people with disabilities. For example, Medicaid covers personal and attendant care services that assist people with disabilities with the tasks necessary for daily living, such as eating, bathing, dressing, preparing meals, and going grocery shopping.11 Medicaid also covers habilitative services that help people with disabilities learn independent living skills; assistive technology, such as lifts, wheelchairs, and speech-generating devices; supportive housing services that help people with disabilities obtain and retain community housing; and community-based mental health services, which help people with mental illness remain out of institutions. For an example of a Medicaid beneficiary relying on long-term mental health services, see Bill’s story below.
| Bill, age 42, Arizona | |
| Bill was going to school and working as a nurse when he had his first mental break at age 27. While he was hospitalized, he was diagnosed with bipolar disorder and found out that he qualified for Medicaid. Medicaid covers the day treatment program that he attends for 30 hours a week, along with medication and doctor visits, to manage his condition. Bill says that Medicaid means he has “been given a second chance.” |  |
Medicaid covers services that enable people with disabilities to work. In addition to providing personal care and transportation services that help people with disabilities get ready for the day and get to work, states also can cover supported employment services, such as job coaching, to help people with disabilities work in the community.
The ACA offers states new and expanded options to provide community-based long-term care services. The ACA created the Community First Choice option to provided attendant care services and supports with 6% enhanced federal matching funds; eight states elect this option as of 2016. The ACA also expanded states’ ability to offer HCBS through the Section 1915 (i) option, which allows states to serve people with functional limitations that do not yet rise to an institutional level of care. This enables states to offer services in efforts to retain people in the community and prevent the need for costlier and more intensive services in the future. As of 2015, 17 states are using this option to provide targeted services to particular populations, such as people with mental health needs and those with I/DD. The ACA also created the Medicaid health homes option, which enables states to provide care coordination services for people with chronic conditions at a 90% enhanced federal match for the first two years; 22 states offer health homes as of 2016. For an example of a beneficiary receiving Medicaid community-based services, see Curtis’s story below.
| Curtis, age 20, Kansas | |
| Curtis lives with his mother and is diagnosed with autism, intellectual disabilities, and sensory integration issues. He functions on the level of a 2nd or 3rd grader and recently has started to read. While he has a very easy-going personality, he cannot be left alone and needs help with shaving, bathing, and taking medication. Medicaid provides attendant care services that help him to learn basic life skills at home, such as making his bed and dusting his room, while his mother is at work. His attendant also accompanies him to the library, to get his hair cut, to community events, and to the book store where his favorite activity is looking at picture books. |  |
Medicaid helps make coverage affordable for nonelderly adults with disabilities. Federal minimum standards limit Medicaid beneficiaries’ out-of-pocket costs to prevent them from encountering financial barriers to accessing necessary care. States can charge premiums to those with incomes above 150% FPL. Copayment levels vary based on income and generally are limited to nominal amounts for those below poverty. People who receive long-term care services, such as those in nursing homes, may be required to contribute most of their income toward the cost of their care, except for a small personal needs allowance to pay for items that Medicaid does not cover, such as clothing.
How Much Does Medicaid Spend on People with Disabilities?
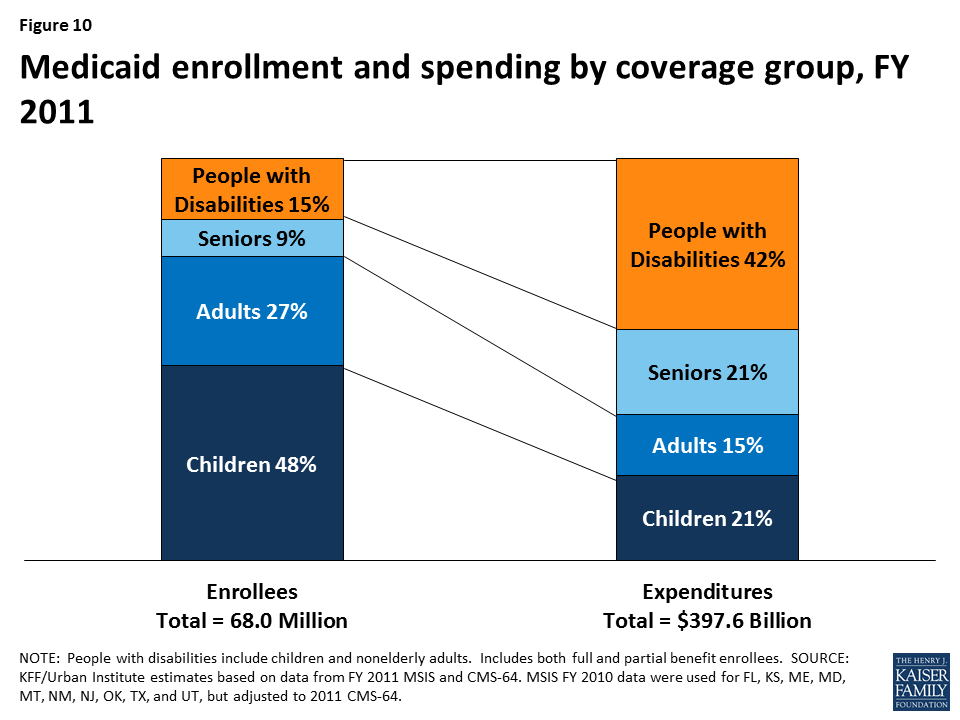
Medicaid spending on people with disabilities is disproportionate to their enrollment in the program (Figure 10). Unlike the data presented earlier in this paper, which are limited to nonelderly adults with disabilities, the Medicaid enrollment and spending data for people with disabilities in this section include both nonelderly adults and children with disabilities. As of 2011, people with disabilities accounted for 15% of total Medicaid enrollment but 42% of program spending. This discrepancy is likely due to their greater health needs and more intensive use of services compared to those without disabilities.
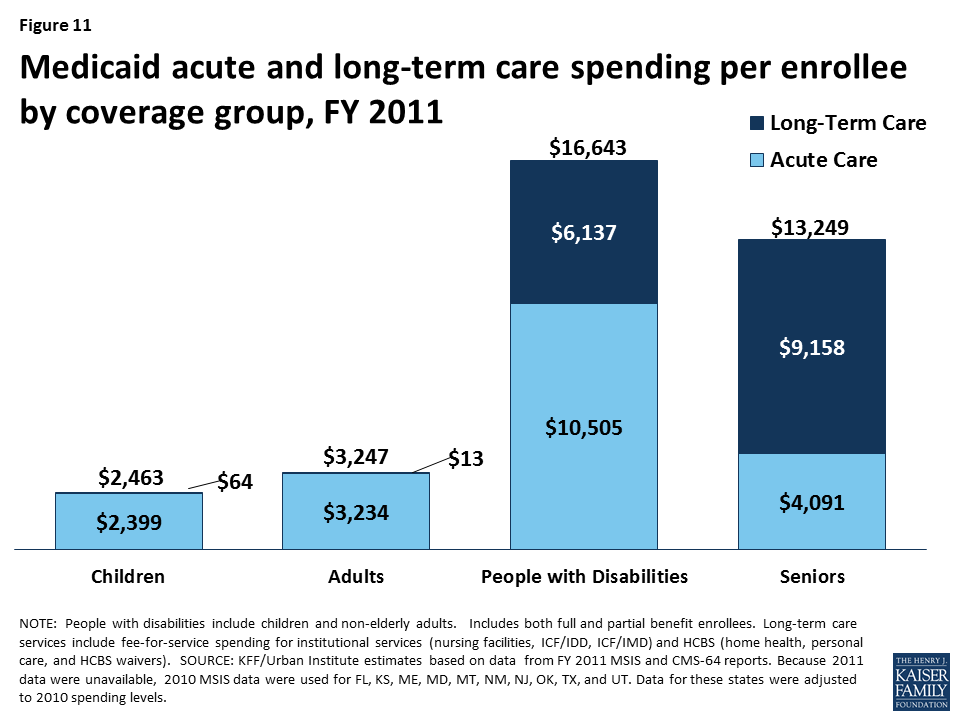
Per enrollee spending for people with disabilities is substantially higher than for those without disabilities (Figure 11). Per enrollee spending for people with disabilities totaled $16,643 in 2011, more than five times higher than for adults without disabilities ($3,247) and nearly seven times higher than for children without disabilities ($2,463). Some of this difference is due to people with disabilities’ greater use of both institutional and community-based long-term care services ($6,137) compared to those without disabilities, who have per enrollee long-term care spending at negligible amounts. This is because some people enrolled in Medicaid through a pathway based solely on their low income also have disabilities and use long-term care services. In addition to having higher per enrollee long-term care spending, people enrolled through a disability-related pathway also have higher per enrollee spending for acute care services ($10,505), more than eight times that of adults without disabilities ($3,234) and more than four times that of children without disabilities ($2,399).
Per enrollee spending for people with disabilities varies substantially by state, ranging from $10,142 in AL to $33,808 in NY in 2011 (Figure 12 and Appendix Table). Over half of states spend between $15,000 to $19,999 per enrollee for people with disabilities, and another third of states spend between $20,000 to $34,999 per enrollee for people with disabilities. This variation is due to state choices about eligibility and services, as many disability-related coverage pathways and most home and community-based long-term care services are offered at state option.

As of 2011, 80% of nonelderly people with disabilities who use Medicaid long-term care are served in the community, with the remaining 20% in institutions (Figure 13). Over the last several decades, states have made substantial progress in serving more nonelderly adults with disabilities in the community instead of in nursing homes. HCBS typically are less expensive than nursing homes and are preferred by many nonelderly adults with disabilities. However, state Medicaid programs must cover nursing home services, while nearly all HCBS are optional, making HCBS vulnerable to cuts if states are faced with funding reductions.

Looking Ahead
Medicaid covers more than three in 10 nonelderly adults with disabilities, providing a broad range of medical and long-term care services to meet their diverse needs and making coverage affordable. Over half of nonelderly Medicaid adults with disabilities live below the federal poverty level, and nearly 85% have incomes of less than 200% FPL, or $24,120 per year for an individual in 2017. They are significantly more likely to use health care services, including care at home, and to have lower out-of-pocket medical costs than nonelderly adults with disabilities who are privately insured, reflecting their lower incomes and greater functional limitations. Medicaid spending for this population is disproportionate to their program enrollment, due to their greater health needs and reliance on Medicaid for expensive but necessary services, especially long-term care in the community and nursing homes, that are generally unavailable through private insurance and too costly to afford out-of-pocket.
The American Health Care Act, as approved by the House Energy and Commerce Committee, would fundamentally change Medicaid’s financing structure to a per capita cap, resulting in an estimated $880 billion reduction in federal Medicaid spending from 2017 to 2026. People with disabilities may be especially affected by a per capita cap as most disability-related coverage pathways and many services important to people with disabilities, such as community-based long-term care, are provided at state option, making them subject to cuts if states are faced with federal funding reductions. States’ delivery system reform efforts that affect people with disabilities, such as those that seek to improve care coordination; integrate physical, behavioral health, and long-term care services; and serve more people in the community instead of institutions also could be curtailed if federal Medicaid funding is limited.
While per enrollee Medicaid spending for both acute and long-term care services is substantially higher for people with disabilities compared to those without disabilities, it also varies substantially across states. A per capita cap, as proposed in the American Health Care Act, could lock in historical state differences in scope of coverage and spending for people with disabilities. Changing Medicaid financing to a per capita cap also ties spending levels to a base year, which does not account for future spending increases due to new drug therapies or other medical advances yet to be developed, which could offer important new treatments to improve the lives and functioning of people with disabilities.
The American Health Care Act also ends enhanced federal funding for the ACA’s Medicaid expansion and the Community First Choice (CFC) option, both of which can be important to people with disabilities. The ACA’s Medicaid expansion provides a pathway through which some nonelderly adults with disabilities newly gained coverage, while CFC allows states to offer attendant care services and supports that help people with disabilities live and work in the community. As approved by the House Energy and Commerce Committee, the AHCA repeals the enhanced federal matching funds for the ACA’s expansion enrollees as of January 1, 2020, except for those enrolled as of December 31, 2019, who do not have a break in eligibility of more than one month, and ends the enhanced federal matching funds for CFC as of January 1, 2020. These reductions in federal funding could jeopardize states’ ability to continue to finance the expansion coverage pathway and Community First Choice services.
Unlike nursing home services which are required, many home and community-based services important to people with disabilities are provided through optional waivers, which put them at risk for cuts as states look for ways to limit spending in the face of substantial federal funding reductions. In addition, new flexibility granted to states under Section 1115 Medicaid expansion waivers could further complicate coverage for nonelderly adults with disabilities. Existing Medicaid expansion waivers include provisions not otherwise permitted under current Medicaid rules, such as premiums, copayments above statutory limits, healthy behavior incentives, and health savings accounts. People who are considered “medically frail” are exempt from some of these rules, which can create additional administrative burdens for states, health plans, and beneficiaries in making sure that people with disabilities are appropriately recognized.
Under a per capita cap and the elimination of enhanced federal financing as proposed in the AHCA, states will be faced with budgetary pressures resulting from the substantial reduction in federal Medicaid funds. At the same time, states will continue to be required to meet their community integration obligations for people with disabilities under the Americans with Disabilities Act and the Supreme Court’s Olmstead decision. Medicaid has played a key role in financing community-based long-term care services, but its ability to continue to do so may be limited by the loss of the CFC enhanced funding for attendant care services, along with the broader reductions in federal Medicaid funds under a per capita cap, thereby increasing budgetary pressures on states. Because the AHCA could have significant consequences for enrollees and states, its potential implications warrant careful consideration for their impact on nonelderly Medicaid adults with disabilities.
Appendix
| Appendix Table: State Medicaid Spending and Options for People with Disabilities | |||||||||||
| State | Medicaid Spending Per Enrollee(2011) | Share of Medicaid LTC SpendingDevoted to HCBS (FY 2014) | ACA Expans.(2017) | Optional Disability-Related Eligibility Pathways (2015) | Optional Home and Community-Based Services | ||||||
| >73%-100% FPL | Work Buy-In | LTC to 300% SSI | Pers’l Care(2013) | HCBS Waivers(2017) | CFC(2016) | Sec. 1915 (i)(2015) | Health Homes(2016) | ||||
| States with Republican Governor | |||||||||||
| Alabama | $10,142 | 42% | X | X | X | ||||||
| Arizona | $22,040 | 70% | X | X | X | X | X | ||||
| Arkansas | $14,023 | 50% | X | X | X | X | X | X | |||
| Florida | $15,005 | 33% | X | X | X | X | |||||
| Georgia | $10,639 | 48% | X | X | X | ||||||
| Idaho | $21,781 | 53% | X | X | X | X | X | X | |||
| Illinois | $16,689 | 44% | X | X | X | X | |||||
| Indiana | $19,488 | 31% | X | X | X | X | X | X | |||
| Iowa | $20,242 | 50% | X | X | X | X | X | X | |||
| Kansas | $17,153 | 53% | X | X | X | X | X | ||||
| Kentucky | $12,856 | 41% | X | X | X | X | |||||
| Maine | $16,920 | 55% | X | X | X | X | X | X | |||
| Maryland | $23,798 | 56% | X | X | X | X | X | X | X | X | |
| Massachusetts | $16,927 | 57% | X | X | X | X | X | X | |||
| Michigan | $15,109 | 35% | X | X | X | X | X | X | X | X | |
| Mississippi | $12,960 | 27% | X | X | X | X | |||||
| Missouri | $17,481 | 56% | X | X | X | X | |||||
| Nebraska | $17,449 | 49% | X | X | X | X | |||||
| Nevada | $15,706 | 49% | X | X | X | X | X | X | |||
| New Hampshire | $21,545 | 50% | X | X | X | X | X | ||||
| New Jersey | $19,951 | 41% | X | X | X | X | X | X | X | ||
| New Mexico | $18,500 | 74% | X | X | X | X | X | X | |||
| North Dakota | $28,692 | 41% | X | X | X | X | |||||
| Ohio | $21,892 | 52% | X | X | X | X | X | ||||
| Oklahoma | $15,010 | 44% | X | X | X | X | X | ||||
| South Carolina | $12,830 | 43% | X | X | X | ||||||
| South Dakota | $19,156 | 47% | X | X | X | X | X | ||||
| Tennessee | $14,680 | 53% | X | X | |||||||
| Texas | $17,709 | 57% | X | X | X | X | X | X | |||
| Utah | $19,718 | 48% | X | X | X | X | X | ||||
| Vermont | $17,789 | 68% | X | X | X | X | X | X | |||
| Wisconsin | $16,599 | 64% | X | X | X | X | X | X | |||
| Wyoming | $25,346 | 50% | X | X | X | ||||||
| TOTAL: 33 | N/A | N/A | 16 | 13 | 27 | 30 | 21 | 33 | 2 | 9 | 15 |
| States with Democratic or Independent Governor | |||||||||||
| Alaska | $28,790 | 70% | X | X | X | X | X | ||||
| California | $20,080 | 64% | X | X | X | X | X | X | X | ||
| Colorado | $19,643 | 63% | X | X | X | X | X | ||||
| Connecticut | $31,004 | 48% | X | X | X | X | X | X | |||
| Delaware | $22,972 | 42% | X | X | X | X | X | ||||
| DC | $28,604 | 53% | X | X | X | X | X | X | X | X | |
| Hawaii | $17,035 | 42% | X | X | X | ||||||
| Louisiana | $15,099 | 39% | X | X | X | X | X | X | |||
| Minnesota | $26,890 | 75% | X | X | X | X | X | X | X | ||
| Montana | $16,352 | 57% | X | X | X | X | X | X | X | ||
| New York | $33,808 | 58% | X | X | X | X | X | X | |||
| North Carolina | $15,060 | n/a | X | X | X | X | X | ||||
| Oregon | $18,255 | 79% | X | X | X | X | X | X | X | ||
| Pennsylvania | $16,441 | 44% | X | X | X | X | X | ||||
| Rhode Island | $21,417 | 58% | X | X | X | X | X | X | |||
| Virginia | $18,952 | 55% | X | X | X | X | |||||
| Washington | $16,208 | 66% | X | X | X | X | X | X | X | ||
| West Virginia | $12,993 | 48% | X | X | X | X | X | X | |||
| TOTAL: 18 | N/A | N/A | 16 | 8 | 17 | 14 | 11 | 18 | 6 | 8 | 7 |
| NOTES: Spending per enrollee includes full benefit nonelderly adults and children with disabilities only. Share of LTC spending devoted to HCBS omits managed care spending in CA and MA. % HCBS not calculated for NC due to missing data. Not all states electing the >73%-100% FPL expansion go up to 100% FPL. HCBS waivers include § 1915 (c) and § 1115.SOURCES: KFF, Data Note: Variation in Per Enrollee Medicaid Spending Across States (Feb. 2017); Steve Eiken, Kate Sredl, Brian Burwell, and Paul Saucier, Medicaid Expenditures for Long Term Services and Supports (LTSS) in FY 2014, Table C (Bethesda, MD: Truven Health Analytics, April 2016); KFF, Status of State Action on the Medicaid Expansion Decision (Jan. 1, 2017). KFF, Medicaid Financial Eligibility for Seniors and People with Disabilities in 2015 (March 2016). KFF, Medicaid Home and Community-Based Services Programs: 2013 Data Update (Oct. 2016). KFF, Medicaid Section 1115 Managed Long-Term Services and Supports Waivers: A Survey of Enrollment, Spending, and Program Policies (Jan. 2017). KFF, Section 1915 (k) Community First Choice State Plan Option (March 2016). KFF, Health Home State Plan Option (April 2016). | |||||||||||
Endnotes
- Kaiser Family Foundation analysis of 2015 National Health Interview Survey (NHIS) data. The total number of nonelderly adults with disabilities is likely higher as people living in long-term care facilities are excluded from NHIS. ↩︎
- As approved by the House Energy and Commerce Committee, the bill would eliminate the ACA’s enhanced federal matching funds for expansion enrollees as of January 1, 2020, except for those enrolled as of December 31, 2019, who do not have a break in eligibility of more than one month. ↩︎
- Applicants have their Medicaid eligibility assessed solely on the basis of income as the first step in the eligibility determination process. To the extent that different coverage groups receive different benefit packages, people who qualify for Medicaid both as an expansion adult and in a disability-related group can choose to remain in the expansion group or change their enrollment to the disability-related group so that they can access the benefit package that best meets their needs. 42 C.F.R. § 435.911(c)(2). ↩︎
- The expansion is optional for states, as a result of the Supreme Court’s ruling on the ACA’s constitutionality. Prior to the ACA, there was not a Medicaid coverage pathway for childless adults regardless of how low their income was, and this remains the case in the 19 non-expansion states, except for Wisconsin, which covers childless adults up to 100% FPL. ↩︎
- To be eligible for SSI, beneficiaries must have low incomes, limited assets, and a significant disability that impairs their ability to work at a substantial gainful level. ↩︎
- Jean P. Hall, et al., Effect of Medicaid Expansion on Workforce Participation for People with Disabilities, 107 Amer. J. Pub. Health 262-264 (Feb. 2017), doi: 10.2105/AJPH.2016.303543. ↩︎
- These pathways were not changed by the ACA. ↩︎
- Kaiser Family Foundation analysis of 2015 NHIS data. ↩︎
- States also can provide HCBS through waivers which allow them to target particular populations and limit enrollment. ↩︎
- In Olmstead, the Supreme Court held that the unjustified institutionalization of people with disabilities is illegal discrimination under the ADA. ↩︎
- States have the option to allow beneficiaries to self-direct their services by selecting or dismissing personal care attendants and/or allocating their service budgets among available services. ↩︎