Black Americans and HIV/AIDS: The Basics
Key Facts
- Black Americans have been disproportionately affected by HIV/AIDS since the epidemic’s beginning, and that disparity has deepened over time.1,2
- Although they represent only 12% of the U.S. population, Black people account for a much larger share of HIV diagnoses (43%), people estimated to be living with HIV disease (42%), and deaths among people with HIV (44%) than any other racial/ethnic group in the U.S.3,4
- Among Black Americans, Black women, youth, and gay and bisexual men have been especially hard hit.5,6
- A number of interconnected challenges contribute to the epidemic among Black people, including poverty, lack of access to health care, higher rates of some sexually transmitted infections, smaller sexual networks, lack of awareness of HIV status, and stigma.7
- Despite this impact, recent data indicate some encouraging trends, including declining new HIV diagnoses among Black people overall, especially among women, and a leveling off of new diagnoses among Black gay and bisexual men.8,9 However, given the epidemic’s continued and disproportionate impact among Black people, a continued focus is critical to addressing HIV in the United States.
Overview
- Today, there are more than 1.1 million people living with HIV/AIDS in the U.S., including 476,100 who are Black.10,11,12
- Although Black Americans represent only 12% of the U.S. population,13 they accounted for 43% of new HIV diagnoses in 2018 (see Figure 1) and an estimated 42% of people living with HIV.14
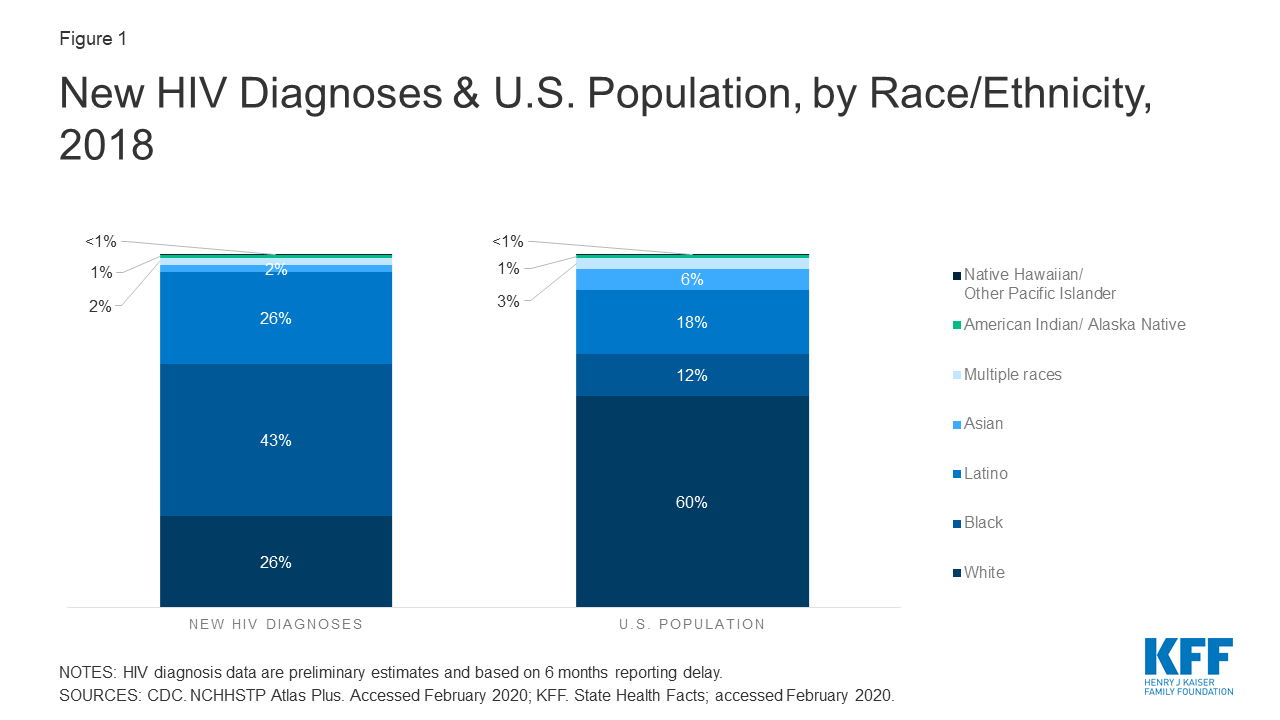
Figure 1: New HIV Diagnoses & U.S. Population, by Race/Ethnicity, 2018
- The rate of new HIV diagnoses per 100,000 among Black adults/adolescents (47.5) was 8 times that of whites (5.6) and more than twice that of Latinos (20.9) in 2018 (see Figure 2).15 The rate for Black men (74.8) was the highest of any group, twice that of Latino men (36.4), the second highest group. Black women (23.1) had the highest rate among women.16
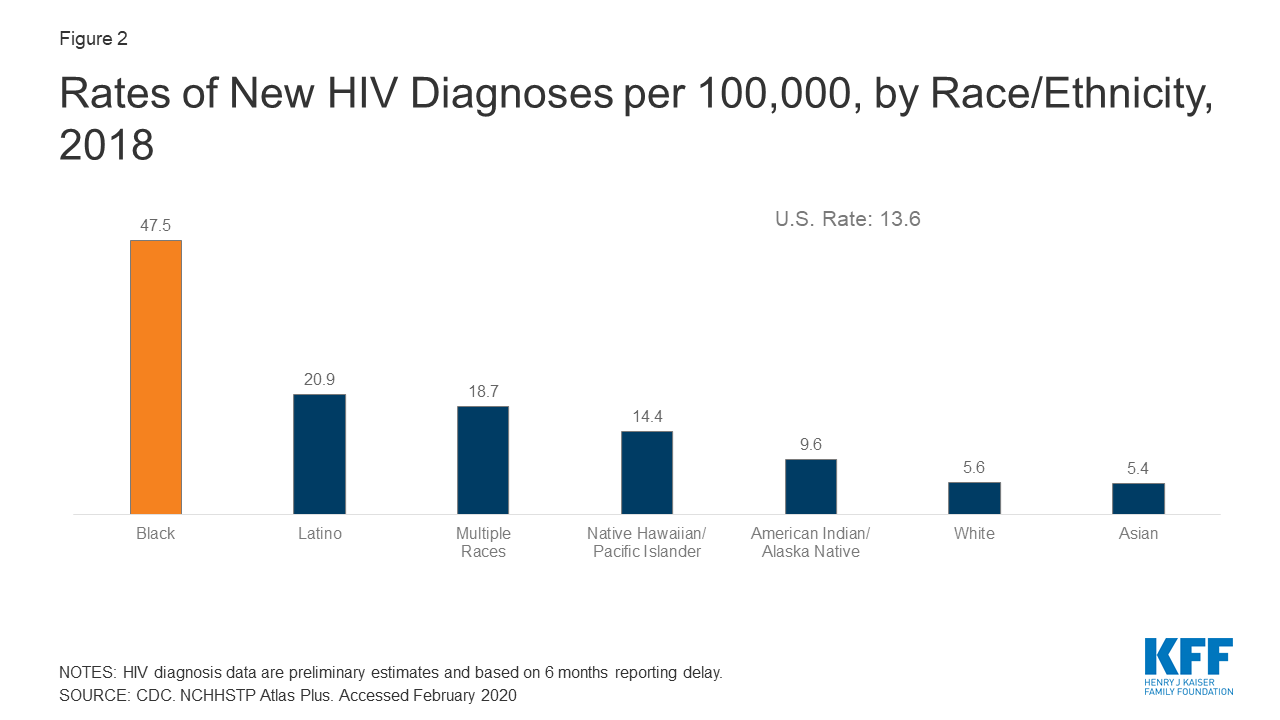
Figure 2: Rates of New HIV Diagnoses per 100,000, by Race/Ethnicity, 2018
- The latest data indicate declines in both the number and rate of annual new diagnoses among Black people in recent years, including among women.17
- Black people accounted for more than 4 in 10 (44%) deaths among people with an HIV diagnosis (deaths may be due to any cause) in 2017.18 The number of deaths among Black people with an HIV diagnosis decreased 8% between 2010 and 2017.19 Despite these declines, HIV was the 6th leading cause of death for Black men ages 25-34 and 8th for Black women ages 35-44 in 2017, ranking higher than for their respective counterparts in any other racial/ethnic group.20
- HIV death rates (deaths for which HIV was indicated as the leading cause of death) are highest among Black people. In 2017, Black people had the highest age-adjusted HIV death rate per 100,000 – 6.6, compared to 0.9 per 100,000 whites.21
Transmission
- Transmission patterns vary by race/ethnicity. While male-to-male sexual contact accounts for the largest share of HIV cases among both Black and White people, proportionately, fewer Black people contract HIV this way and heterosexual sex plays a bigger role among Black people compared with White people. Among Black people, 59% of new HIV diagnoses in 2018 were attributable to male-to-male sexual contact and 34% were attributable to heterosexual sex; among White people, 67% of new HIV diagnoses in 2018 were attributable to male-to-male sexual contact and 15% were attributable to heterosexual sex. The remainder of HIV diagnoses in each group were attributable to other causes, including injection drug use.22
- Black women are most likely to have been infected through heterosexual transmission, the most common transmission route for women overall. Black women are less likely to have been infected through injection drug use than White women.23
Women and Young People
- Among all women, Black women account for the largest share of new HIV diagnoses (4,114, or 58% in 2018), and the rate of new diagnoses among Black women (23.1) is 14 times the rate among white women and almost 5 times the rate among Latinas.24 Black women also accounted for the largest share of women living with an HIV diagnosis at the end of 2017.25
- Although new HIV diagnoses continue to occur disproportionately among Black women, data show a 43% decrease in new diagnoses for Black women between 2008 and 2018.26
- In 2018, Black women represented about one quarter (26%) of new HIV diagnoses among all Black people – a higher share than Latina women and White women (who represented 12% and 16% of new diagnoses among their respective groups).27
- In 2016, more than half of gay and bisexual teens and young adults with HIV were black.28
- According to a national survey of those ages 18-30, about three times as many Black (46%) as White (15%) young adults say HIV today is a “very serious” concern for people they know. Almost twice as many Black young adults (30%) say they know someone who is living with, or has died of, HIV/AIDS, compared to White young adults (16%).29
Gay and Bisexual Men
- Among gay and bisexual men, Black men have been disproportionately affected by HIV and account for 39% of HIV diagnoses attributable to male-to-male sexual contact.30
- In 2018, male-to-male sexual contact accounted for more than half (59%) of new HIV diagnoses among Black people overall and a majority (80%) of new diagnoses among Black men.31
- Young Black gay and bisexual men are particularly affected, with those ages 13-24 representing over half (52%) of new HIV diagnoses among all gay and bisexual men in that age group.32
- In addition, newly diagnosed Black gay and bisexual men are younger than their White counterparts, with those ages 13-24 accounting for 34% of new HIV diagnoses among Black gay and bisexual men in 2018, compared to 16% among White gay and bisexual men .33
- Annual new infections among Black gay and bisexual men have remained stable in recent years, as have new infections among gay and bisexual men overall.34
- A study in 23 major U.S. cities found that HIV prevalence among Black gay and bisexual men was 39%, compared to 23% of gay and bisexual men overall.35
Geography
- Although HIV diagnoses among Black people have been reported throughout the country, the impact of the epidemic is not uniformly distributed.
- Regionally, the South accounts for both the majority of Black people newly diagnosed with HIV (63% in 2018) and the majority living with an HIV diagnosis at the end of 2017 (58%).36,37
- As with the nation as a whole, HIV diagnoses among Black people are clustered in a handful of states, with the 10 states with the highest number of Black people living with an HIV diagnosis accounting for the majority (84%) of cases in this group in 2018 (see Figure 3). Florida and New York top the list. In addition, the District of Columbia had the highest rate of Black people living with an HIV diagnosis at the end of 2017 (3,799.3 per 100,000).38
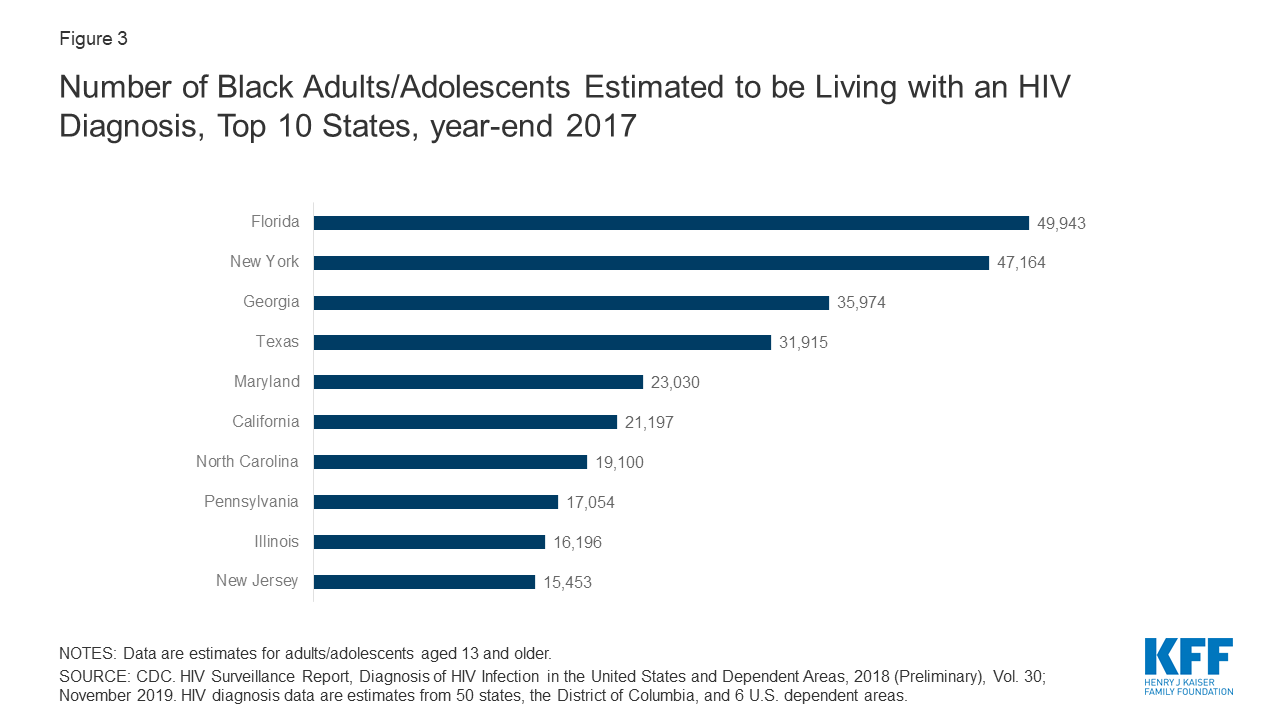
Figure 3: Number of Black Adults/Adolescents Estimated to be Living with an HIV Diagnosis, Top 10 States, year-end 2017
HIV Testing and Access to Prevention & Care
- In 2014, three quarters (76%) of Black people over age 18 report ever having been tested for HIV and they are more likely than Latino people or White people to report having been tested (58% and 50%, respectively).39
- Among those who are HIV positive, 20% of Black people were tested for HIV late in their illness – that is, were diagnosed with AIDS within 3 months of testing positive for HIV; by comparison, 22% of White people and 21% of Latino people were tested late.40
- Looking across the care continuum, from HIV diagnosis to viral suppression, missed opportunities are revealed. Eight-five percent (85%) of Black people with HIV are diagnosed, 60% are linked to care, and 46% are virally suppressed.41 Compared with White people, Black people are less likely to have reached each of these goals in the continuum – diagnosis, linkage to care and viral suppression and thus disparities are likely to persist.42
Endnotes
CDC. Special Data Request; 2006.
CDC. NCHHSTP Atlas Plus. Accessed February 2020.
CDC. NCHHSTP Atlas Plus. Accessed February 2020.
KFF. State Health Facts; accessed February 2020.
CDC. HIV Surveillance Report, Diagnoses of HIV Infection in the United States and Dependent Areas, 2018, Vol. 30; November 2019.
CDC. Fact Sheet: HIV Among African Americans; January 2020.
CDC. Fact Sheet: HIV Among African Americans; January 2020.
CDC. Fact Sheet: HIV Among African Americans; January 2020.
CDC. NCHHSTP Atlas Plus. Accessed February 2020.
CDC. NCHHSTP Atlas Plus. Accessed February 2020
CDC. Fact Sheet: HIV Among African Americans; January 2020.
Includes those diagnosed as well as estimates for those undiagnosed.
KFF. State Health Facts; accessed February 2020.
CDC. NCHHSTP Atlas Plus. Accessed February 2020.
CDC. NCHHSTP Atlas Plus. Accessed February 2020.
CDC. NCHHSTP Atlas Plus. Accessed February 2020.
CDC. NCHHSTP Atlas Plus. Accessed February 2020.
CDC. NCHHSTP Atlas Plus. Accessed February 2020.
CDC. NCHHSTP Atlas Plus. Accessed February 2020.
CDC. NCHS. Deaths: Leading Causes for 2017; June 2019.
CDC. NCHS. Health, United States, 2018; October 2019.
CDC. NCHHSTP Atlas Plus. Accessed February 2020.
CDC. Slide Set: HIV Surveillance in Women (through 2018 preliminary).
CDC. NCHHSTP Atlas Plus. Accessed February 2020.
CDC. HIV Surveillance Report, Diagnoses of HIV Infection in the United States and Dependent Areas, 2018, Vol. 30; November 2019.
CDC. NCHHSTP Atlas Plus. Accessed February 2020.
CDC. NCHHSTP Atlas Plus. Accessed February 2020.
CDC. NCHHSTP Atlas Plus. Accessed February 2020.
KFF. National Survey of Young Adults on HIV/AIDS; November 2017.
CDC. NCHHSTP Atlas Plus. Accessed February 2020.
CDC. NCHHSTP Atlas Plus. Accessed February 2020.
CDC. NCHHSTP Atlas Plus. Accessed February 2020.
CDC. NCHHSTP Atlas Plus. Accessed February 2020.
CDC. HIV Incidence: Estimated Annual Infections in the U.S., 2010-2016; February 2019.
CDC. HIV Surveillance Special Report, HIV Infection Risk, Prevention, and Testing Behaviors among Men Who Have Sex With Men. National HIV Behavioral Surveillance, 23 U.S. Cities, 2017, No. 22; February 2019.
CDC. NCHHSTP Atlas Plus. Accessed February 2020.
CDC. HIV Surveillance Report, Diagnoses of HIV Infection in the United States and Dependent Areas, 2018, Vol. 30; November 2019.
CDC. HIV Surveillance Report, Diagnoses of HIV Infection in the United States and Dependent Areas, 2018, Vol. 30; November 2019.
KFF. Kaiser Health Tracking Poll; July 2014.
CDC. HIV Surveillance Supplemental Report, Monitoring Selected National HIV Prevention and Care Objectives by Using HIV Surveillance Data, Vol. 24, No. 3; June 2019.