Kaiser Health Tracking Poll: September 2013
As the clock counts down on open enrollment and the rollout of the major provisions of the Affordable Care Act (ACA), in the latest Kaiser Health Tracking Poll we asked people who say they don’t have enough information about the law (51 percent of the public overall) what their top questions are about the ACA. Their top two answers: they want more information about how much the law will cost them and how it is paid for; and they want an easily digestible summary of what the law is and how it works. At the same time that they report the need for basic information, most people say news coverage of the law is focused on politics and controversies rather than the impact on people, and more report seeing advertising that makes arguments in favor or against the ACA rather than providing practical information about the law and how to get coverage. Views of the law overall remain split, tilting negative, and those with an unfavorable view mostly want opponents to continue their efforts to repeal the law or stop it from being implemented, though a few say it’s time to accept that it’s the law and move on. At the same time, a majority of the public continues to disapprove of cutting off funding as a way to stop the law’s implementation. Views continue to divide sharply along partisan lines, and the share of Democrats with a positive view – which had been slightly lower throughout 2013 – has rebounded by 8 percentage points this month to two-thirds, closer to levels seen in 2011 and 2012. Among Republicans, those who identify with the Tea Party are much more likely than those who don’t to feel “very unfavorable” about the law, support defunding, and say opponents should continue their efforts to block it.
While policy watchers have been counting down the days until open enrollment in the ACA’s new health insurance marketplaces, just one in eight of the uninsured know that the exchanges open for business on October 1. Public awareness of many of the law’s key provisions has not increased since 2010, and some stubborn misperceptions persist. Finally, as rollout of many of the ACA’s major provisions begins, eight in ten of the uninsured, as well as over half of those with insurance, say they have skipped or postponed some type of health care in the past year due to cost. About half of those with insurance also report experiencing a variety of problems with their current insurance, such as misunderstandings about coverage, problems with billing, and delays or denial of treatment.
Public’s Biggest Questions About ACA Center On Costs and the Need for Basic Information
As has been true since the ACA was passed, the latest Kaiser Health Tracking Poll finds that about half the public (51 percent), and two-thirds of the uninsured (67 percent) continue to say they don’t have enough information about the law to know how it will impact their families. When those who say they don’t have enough information are asked what one question they would like to have answered about the law, the most common responses have to do with costs and what people will have to pay (mentioned by 19 percent of those who say they don’t have enough information) – followed by the need for basic information about what the law is and how it works (18 percent). Other common questions have to do with how the law will improve the health care system (7 percent), the impact on specific groups such as the uninsured or young people (6 percent), general questions about how people will personally be impacted (5 percent), and questions about coverage and benefits (5 percent). Among the uninsured, the mix of questions is similar to those among the public generally.
| FIGURE 1: IN THEIR OWN WORDS | |
| Among the 51% who say they don’t have enough information about the law to understand how it will impact their families: What ONE question would you most like to have answered to help you understand how the health care law will impact you and your family? (Open-ended) | |
| Questions about cost/How much will I have to pay/How is the law paid for? – 19% | “How am I supposed to afford this financially?” “I am having a problem with medication costs. How would this new law help?” “Will the medical insurance be free or will I have to pay?” “Is it going to lower the cost for the average person in the long run?” “How is it going to be sustainable?” “Who is paying for the health care program?” “How is the cost of insurance going to be regulated so that I would only pay what I could afford?” “Why is my company stating that our insurance rate will go up?” |
| Need a general, easy summary, what is it and what will it do/How does it work? – 18% | “Better clarify what it will really means to each American.” “Can you just put it in plain laymen language so we can understand what you’re doing for us?” “I would like to have a non-partisan generated package. I’d like to have the facts rather than a politicized editorial.” “I would like to know more specifics about the law, [such as] where to go to read the law.” |
| How will the law make the health care system better/Who benefits (most)? – 7% | “What does it make better and how is it better than the old law?” “Who really benefits from it?” |
| What impact will it have on a specific group (uninsured, young people, undocumented, Seniors) – 6% | “How will it affect the middle class working people? Will we be better off or worse off?” “How will it affect those already retired?” “What will happen to all of us who don’t have papers in this country?” |
| How will it impact me/my family? – 5% | “Am I going to get better services?” “How is my care going to change?” “How it would impact me being age 21 personally?” |
| Questions about benefits, coverage, or available plans – 5% | “Does it take care of major illnesses?” “I do not understand the limits on benefits. What does it cover?” |
| How will the law impact my current insurance arrangements? – 4% | “How is it going to change my health insurance that my employment pays for? Am I going to have to pay for insurance?” “I would like to know if I can maintain my health care insurance exactly as it is now.” |
| Other | “What happens if we’re unable to afford it? I’ve heard we can go to jail.” “Who is eligible for health care under the health care law, specifically if they [do] not have a source of income?” “Will it change my Medicare?” “If it is so good why is Congress not subject to this law?” “How is this constitutional?” “How does it affect business owners? Do we have to buy or provide [insurance] for employees?” “Are the end of life panels included in the health care law and what is their purpose?” |
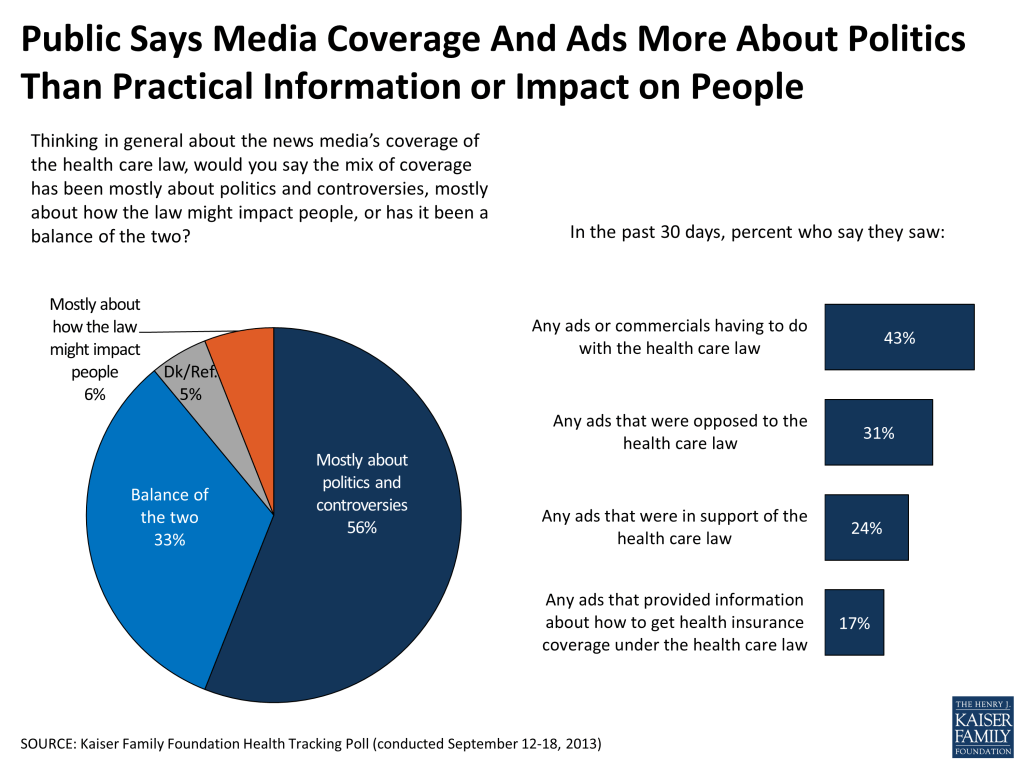
Public Says Media Coverage And Ads More About Politics Than Practical Info Or Impact On People
At the same time that much of the public reports a need for basic information on the ACA, a majority (56 percent) say the news media’s coverage of the law has been focused on politics and controversies, while very few (6 percent) say coverage has been mostly about how the law will impact people. A third say it’s been a balance of the practical and the political. Similarly, when it comes to advertising about the law, people are more likely to report seeing ads that are opposed to the law (31 percent) or in favor of it (24 percent), rather than those that provide information about how to get coverage (17 percent).
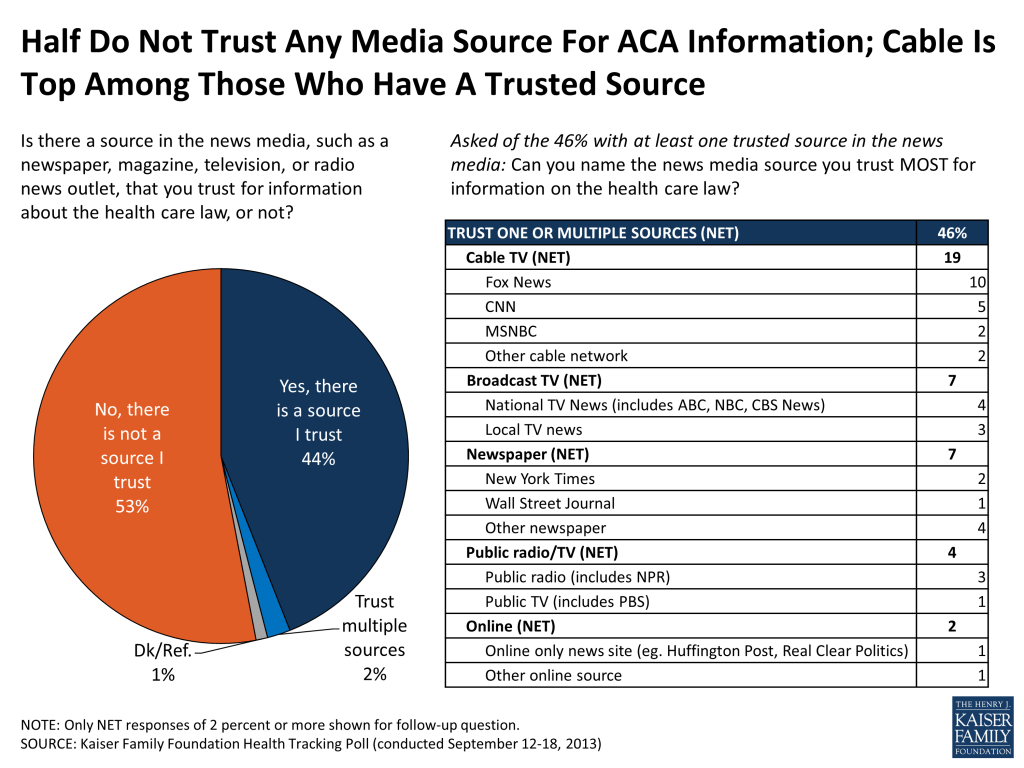
When asked to name a source in the news media that they trust for information about the health care law, more than half (53 percent) say they don’t trust any source, while 46 percent say there is at least one news media source they find trustworthy. Cable TV networks top the list of trusted sources (including 10 percent who name Fox News and 5 percent who name CNN), followed by broadcast TV news (7 percent) and newspapers (7 percent).
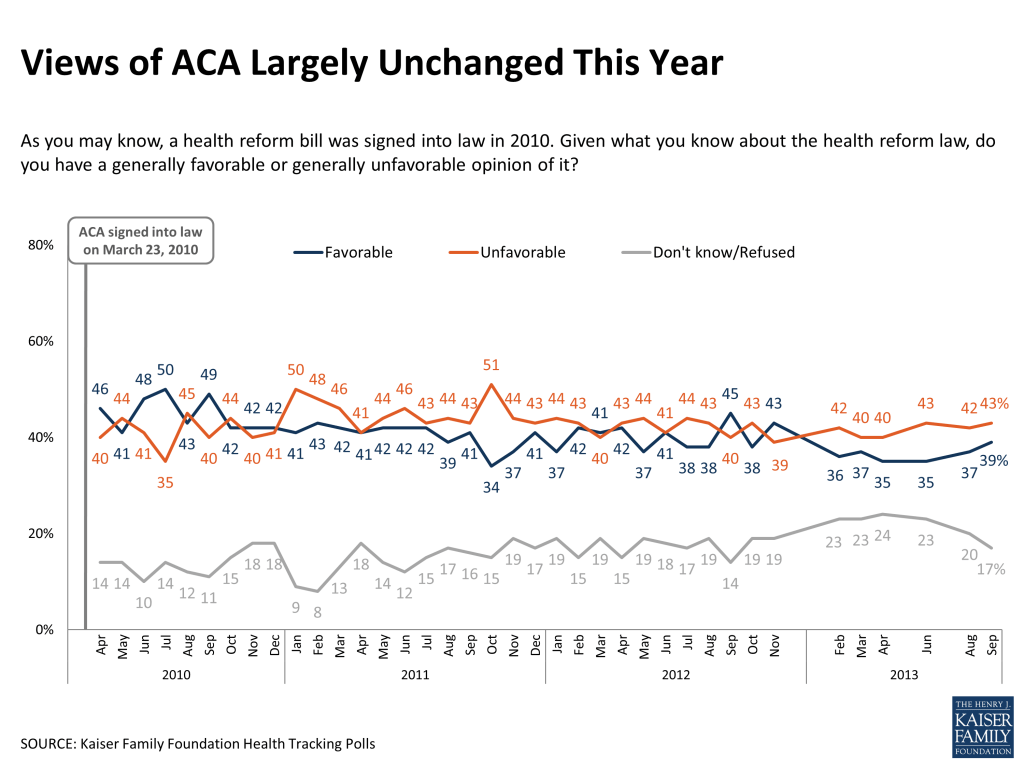
Overall Opinion on the Law Remains Divided, Tilting Negative, but a Majority Disapprove of Defunding
The public’s overall view of the ACA in September looks much like it has throughout 2013, with 43 percent expressing an unfavorable view of the law, 39 percent holding a favorable view, and 17 percent declining to offer an opinion.
Among those with an unfavorable view of the law, the large majority (representing 35 percent of the public overall) say opponents should continue their efforts to either repeal it or stop it from being implemented. A small share (7 percent of the public overall) say opponents should accept that it’s the law of the land and move on to other things.

Still, a majority (56 percent) of the public continues to disapprove of cutting off funding as a strategy for stopping the law from being implemented, including about a third of Republicans (34 percent) and a similar share of those with an unfavorable view of the law overall (31 percent). The survey was in the field from September 12-18, before the House voted to approve a spending bill that stripped all funding for the ACA on September 20.
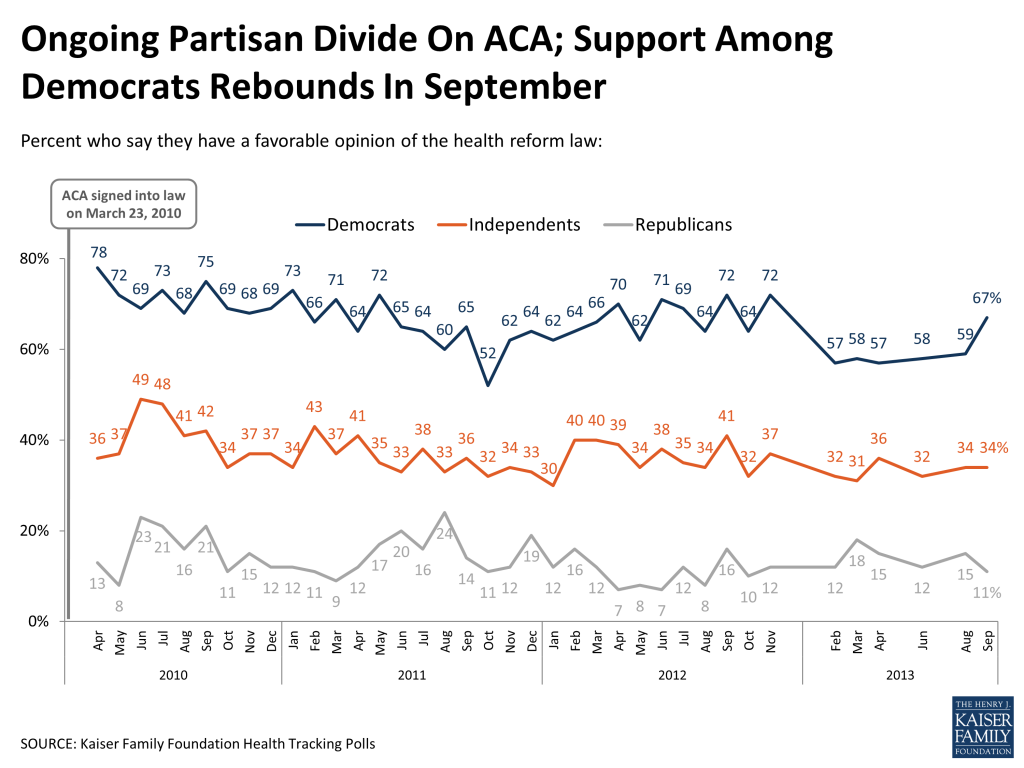
Partisanship: Democrats Look Slightly More Positive This Month; Divisions Among Republicans by Tea Party Identification
As it has since it was passed, the ACA continues to split the country on partisan lines, with a solid majority of Democrats expressing a favorable view and a large share of Republicans viewing it unfavorably. The share of Democrats who say they like the law – which dropped somewhat following the 2012 election and has hovered just below six in ten for most of this year – appears to have rebounded this month. Currently, two-thirds (67 percent) of Democrats say they have a favorable view of the law, up from 59 percent last month, and closer to levels measured in 2011 and 2012.
Deep partisan divides on the ACA are nothing new, but this month’s tracking poll also illuminates some differences in intensity of opinion between Republicans who identify with the Tea Party and those who don’t. For example, seven in ten Tea Party Republicans say they feel “very unfavorable” about the law, compared with half of Republicans who don’t consider themselves part of the Tea Party. Similarly, over three-quarters (77 percent) of Tea Party Republicans say they don’t like the law and want opponents to keep up their efforts to repeal it or stop it from being implemented, compared with just over half (55 percent) of non-Tea Party Republicans. Finally, while a large majority (78 percent) of Tea Party Republicans say they approve of defunding as a strategy to stop the law from being implemented, Republicans who don’t identify with the Tea Party are more divided (51 percent approve, 44 percent disapprove).
| FIGURE 7: INTENSITY GAP AMONG REPUBLICANS BY TEA PARTY IDENTIFICATION | |||
| All Republicans | Republicans who identify with Tea Party | Republicans who don’t identify with Tea Party | |
| Percent who say they have a “very unfavorable” opinion of the health care law | 57% | 70% | 50% |
| Percent who say they have an unfavorable opinion of the health care law and think opponents should continue their efforts to either repeal the law or stop it from being implemented | 62 | 77 | 55 |
| Percent who say they APPROVE of cutting off funding as a way to stop all or some of the law from being put into place | 60 | 78 | 51 |
| Percent who say they DISAPPROVE of cutting off funding as a way to stop all or some of the law from being put into place | 34 | 21 | 44 |
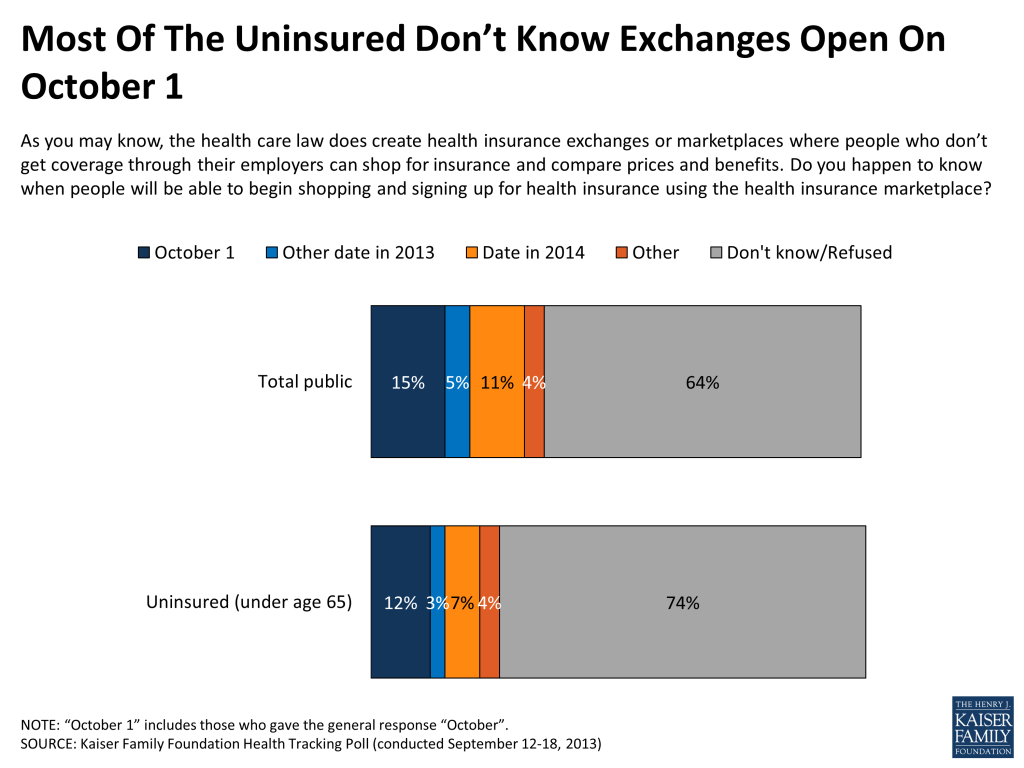
Most Uninsured Don’t Know Insurance Exchanges Are Opening In October, and Overall Awareness of Provisions Has Not Increased Since 2010
With open enrollment in the ACA’s health exchanges just around the corner, nearly two-thirds of the public – including almost three-quarters of the uninsured – say they don’t know when people will be able to begin shopping for health insurance using the new marketplaces. While about a third are willing to guess, just 15 percent of the public overall – and 12 percent of the uninsured – are able to correctly answer that the marketplaces will open in October.
More broadly, the public’s level of awareness about exactly which provisions are – and are not – included in the health care law has generally not increased in the three and a half years since the law was passed. Of the provisions asked about, only one – the individual mandate – is recognized by a larger share now than in 2010 as being part of the law (79 percent now, up from 71 percent). Levels of awareness of other key provisions have either remained stable or declined over time. For example, the shares who are aware of the law’s subsidies, Medicaid expansion, and closing of the Medicare prescription drug “doughnut hole” have all decreased since right after the law’s passage in 2010 (by 12 percentage points, 6 percentage points, and 7 percentage points, respectively). This leaves substantial shares unaware that the law includes each of these key provisions. Among the uninsured, nearly half are unaware that the law expands Medicaid in some states and provides financial help to lower-income people to help them purchase insurance, and more than one in three are unaware that it creates health insurance marketplaces where people can shop for coverage.
| FIGURE 9: AWARENESS OF PROVISIONS INCLUDED IN THE ACA | |||
| Right after ACA passage (2010)* | Now (Sept. 2013) | ||
| Percent who are aware that the law does each of the following: | Total public | Total public | Uninsured, age<65 |
| Individual mandate/penalty | 71% | 79% | 77% |
| Health insurance exchanges | 62 | 65 | 64 |
| Subsidy assistance to individuals | 75 | 63 | 54 |
| Guaranteed issue | 64 | 59 | 55 |
| Medicaid expansion | 64 | 58 | 53 |
| Close Medicare “doughnut hole” | 49 | 42 | 50 |
| *Results are from April 2010, except for “doughnut hole” question, which is from July 2010. Note: Question wording abbreviated. For full question wording, see topline document. | |||
At the same time, many misperceptions about the law stubbornly persist. More than half the public (52 percent) think the law creates a government-run insurance plan to compete with private plans (the so-called “public option” which was debated but ultimately not included in the final package), and another 16 percent are unsure if it does. About four in ten believe the law allows undocumented immigrants to receive government help in purchasing insurance, establishes a government panel to make end-of-life decisions for people on Medicare, or cuts benefits for people in the traditional Medicare program, with another two in ten saying they don’t know whether the law does each of these things.
| FIGURE 10: MISPERCEPTIONS ABOUT PROVISIONS NOT INCLUDED IN THE ACA | |||
| CORRECT | INCORRECT | ||
| To the best of your knowledge, would you say the health reform law does or does not do each of the following? | No, the law does not do this | Yes, the law does this | Don’t know |
| Create a new government run insurance plan to be offered along with private plans | 32% | 52% | 16% |
| Allow undocumented immigrants to receive financial help from the government to buy health insurance | 35 | 43 | 21 |
| Establish a government panel to make decisions about end-of-life care for people on Medicare | 38 | 42 | 20 |
| Cut benefits for people in the traditional Medicare program | 40 | 42 | 18 |
Those With and Without Insurance Report Problems Putting Off Care Due to Cost
As coverage expansions under the ACA get set to be implemented, the survey highlights some of the problems people continue to have accessing care and dealing with their insurance companies. Overall, just over half the public (57 percent) reports putting off or skipping some sort of health care in the past year because of the cost. Most common among these are skipping dental care (37 percent), relying on home remedies or over-the-counter drugs instead of going to the doctor (35 percent), and putting off or postponing needed care (34 percent).
Reports of skipping or delaying care due to cost are more common among the uninsured (83 percent), those in fair or poor health (80 percent), and those with lower incomes (70 percent of those living in households making less than $40,000 a year). Women (64 percent) are also somewhat more likely than men (49 percent) to report postponing or forgoing some sort of needed care because they couldn’t afford it.
| FIGURE 11: OVER HALF REPORT SKIPPING OR DELAYING SOME TYPE OF CARE IN THE PAST YEAR BECAUSE OF THE COST | ||||||||||
| By Insurance Status | By Household Income | By Health Status | By Gender | |||||||
| Total | Insured (ages 18-64) | Uninsured (ages 18-64) | <$40,000 | $40,000-<$90,000 | $90,000+ | Excellent/ very good/ Good | Fair/ poor | Men | Women | |
| Percent who say in the past 12 months, they or another family member living in their household have done each because of the cost | ||||||||||
| Skipped dental care or checkups | 37% | 33% | 65% | 51% | 34% | 16% | 32% | 62% | 30% | 44% |
| Relied on home remedies or over the counter drugs instead of going to see a doctor | 35 | 32 | 62 | 49 | 31 | 17 | 30 | 57 | 29 | 42 |
| Put off or postponed getting health care you needed | 34 | 30 | 63 | 46 | 29 | 19 | 29 | 53 | 27 | 40 |
| Not filled a prescription for a medicine | 27 | 23 | 48 | 39 | 21 | 14 | 20 | 54 | 22 | 32 |
| Skipped a recommended medical test or treatment | 26 | 24 | 49 | 37 | 22 | 13 | 22 | 47 | 20 | 33 |
| Cut pills in half or skipped doses of medicine | 19 | 16 | 35 | 29 | 16 | 6 | 13 | 46 | 15 | 23 |
| Had problems getting mental health care | 12 | 11 | 23 | 19 | 8 | 5 | 8 | 28 | 10 | 14 |
| Yes to any above | 57 | 54 | 83 | 70 | 54 | 37 | 51 | 80 | 49 | 64 |
While putting off care due to cost is more common among the uninsured, those with insurance are not immune to these types of problems. In fact, over half (54 percent) of those with coverage say they have delayed or gone without some type of health care in the past year because they couldn’t afford it.
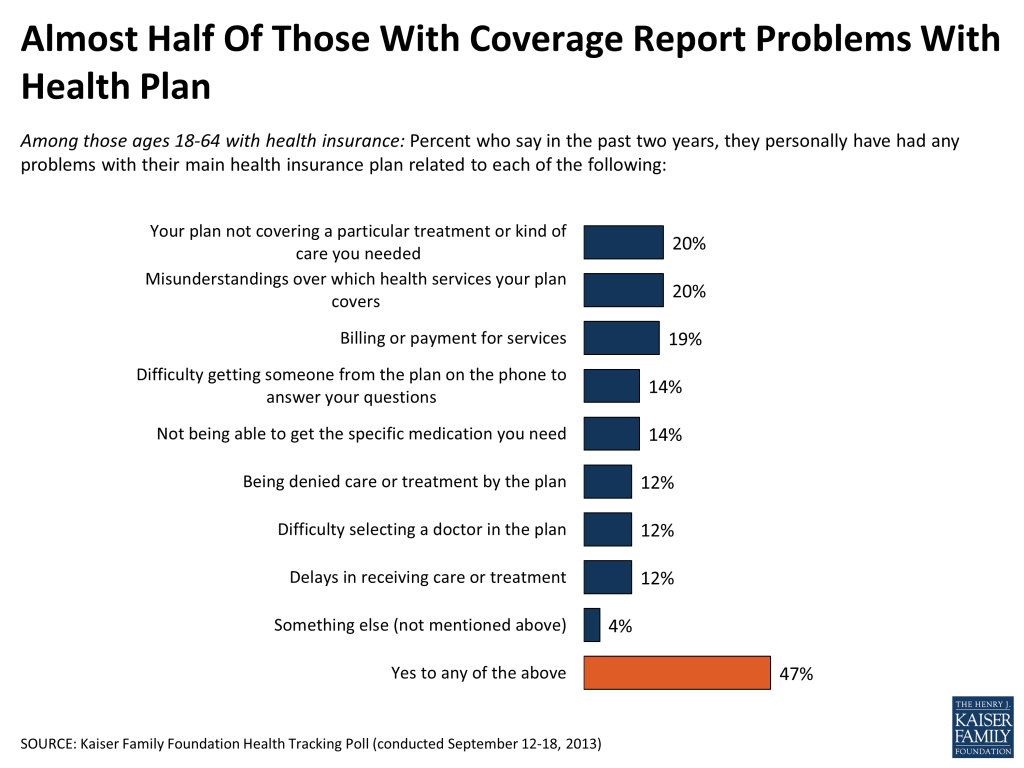
Those with coverage also report experiencing a variety of problems with their health plans. Most common among these are misunderstandings over which services the plan covers (20 percent say this has happened in the past two years), the plan not covering a needed service or treatment (20 percent), and problems related to billing or payment (19 percent). Somewhat fewer report problems getting needed medication (14 percent), difficulty reaching someone to answer questions (14 percent), treatment delays (12 percent) or denials (12 percent), and difficulty selecting a doctor (12 percent). All told, nearly half (47 percent) of those with insurance say they’ve had at least one of these problems in the past two years.
This Kaiser Health Tracking Poll was designed and analyzed by public opinion researchers at the Kaiser Family Foundation (KFF) led by Mollyann Brodie, Ph.D., including Liz Hamel, Claudia Deane, and Sarah Cho. The survey was conducted September 12-18, 2013, among a nationally representative random digit dial telephone sample of 1,503 adults ages 18 and older, living in the United States, including Alaska and Hawaii (note: persons without a telephone could not be included in the random selection process). Computer-assisted telephone interviews conducted by landline (752) and cell phone (751, including 410 who had no landline telephone) were carried out in English and Spanish by Princeton Data Source under the direction of Princeton Survey Research Associates International (PSRAI). Both the random digit dial landline and cell phone samples were provided by Survey Sampling International, LLC. For the landline sample, respondents were selected by asking for the youngest adult male or female currently at home based on a random rotation. If no one of that gender was available, interviewers asked to speak with the youngest adult of the opposite gender. For the cell phone sample, interviews were conducted with the person who answered the phone. KFF paid for all costs associated with the survey.
The combined landline and cell phone sample was weighted to balance the sample demographics to match estimates for the national population using data from the Census Bureau’s 2011 American Community Survey (ACS) on sex, age, education, race, Hispanic origin, nativity (for Hispanics only), and region along with data from the 2010 Census on population density. The sample was also weighted to match current patterns of telephone use using data from the July-December 2012 National Health Interview Survey. The weight takes into account the fact that respondents with both a landline and cell phone have a higher probability of selection in the combined sample and also adjusts for the household size for the landline sample. All statistical tests of significance account for the effect of weighting.
The margin of sampling error including the design effect for the full sample is plus or minus 3 percentage points. Numbers of respondents and margin of sampling error for key subgroups are shown in the table below. For results based on other subgroups, the margin of sampling error may be higher. Sample sizes and margin of sampling errors for other subgroups are available by request. Note that sampling error is only one of many potential sources of error in this or any other public opinion poll.
| Group | N (unweighted) | M.O.S.E. |
| Total | 1,503 | +3 percentage points |
| Uninsured, ages 18-64 | 200 | +7 percentage points |
| Insured, ages 18-64 | 893 | +4 percentage points |
| Democrats | 456 | +5 percentage points |
| Independents | 506 | +5 percentage points |
| Republicans | 342 | +6 percentage points |
| Republicans, Tea Party | 143 | +9 percentage points |
| Republicans, not Tea Party | 168 | +9 percentage points |