Kaiser Health Tracking Poll: August 2013
As outreach efforts for enrollment in the health insurance marketplaces created by the Affordable Care Act (ACA) increase over the summer, the August Kaiser Health Tracking Poll finds that the public’s most trusted sources of information on the law are not necessarily the ones people are most likely to be hearing from. The public is most likely to say they trust health care professionals like doctors, nurses, and pharmacists, as well as federal and state health agencies when it comes to information about the law. Young adults, a key target of outreach efforts, are particularly likely to say they trust official sources of information like state and federal agencies. By contrast, the most common places where people say they’ve actually heard about the law are from the news media, family and friends. A third of the public now says they’ve heard “a lot” or “some” about the health insurance marketplace in their state, up from 22 percent in June. Despite saying they’ve heard about the law from various sources, confusion remains, with more than four in ten saying the law has been repealed or overturned, or being unsure whether it remains the law of the land. And about half say they don’t understand how the law will impact their own families. While negative views on the law continue to outpace positive ones this month, a majority of the public says they disapprove of cutting off funding as a way to stop the law’s implementation. The most commonly chosen reason for opposition to defunding the ACA is that “using the budget process to stop a law is not the way our government should work,” followed by a belief that “without funding the law will be crippled and won’t work as planned,” and feeling that the law will be “a good thing for the country.”
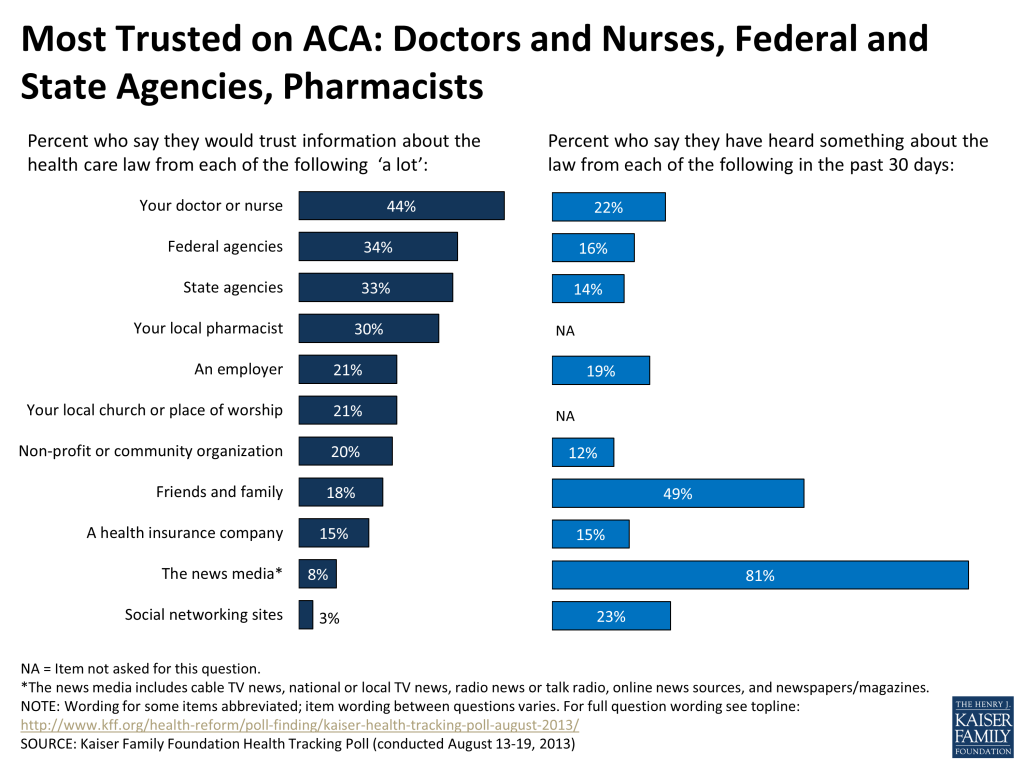
Doctors And Nurses, Federal And State Agencies Are Most Trusted Sources Of Information On ACA
As the October 1st opening of the ACA’s health insurance marketplaces approaches and outreach efforts ramp up, this month’s Kaiser Health Tracking Poll seeks to understand where the public is turning for information about the law, and which sources of information they trust most. Rising to the top of the list of trusted sources are doctors and nurses (44 percent say they would trust them “a lot” for information about the law), federal agencies (34 percent), state agencies (33 percent) and pharmacists (30 percent). About one in five say they would put a lot of trust in information from employers (21 percent), churches (21 percent), non-profit and community organizations (20 percent), and family and friends (18 percent), while fewer feel this way about health insurance companies (15 percent) and the news media (8 percent). At the bottom of the list, just 3 percent say they would trust information about the ACA from social networking sites “a lot.”
Young Adults, Democrats More Likely To Say They Trust Official Sources
Young adults, who have been a key target of outreach efforts and whose participation in the ACA’s health insurance exchanges is seen by many as important to the law’s success, are even more likely than their older counterparts to have confidence in official sources of information about the law. Nearly half of 18-25 year-olds and almost four in ten 26-35 year-olds say they would put “a lot” of trust in information about the ACA from federal and state agencies.
Trust in official sources also divides along partisan lines, with Democrats more than twice as likely as Republicans to say they would trust federal agencies “a lot” (47 percent versus 21 percent). The partisan gap in trust of state agencies is somewhat narrower, but still substantial (41 percent versus 24 percent).
| FIGURE 2: Young Adults, Democrats More Likely To Say They Trust Official Sources Of Information On ACA | ||||||||
| Percent who say they would trust information about the health care law from each of the following “a lot” | BY AGE | BY PARTY ID | ||||||
| TOTAL | 18-25 | 26-35 | 36-64 | 65+ | Dem | Ind | Rep | |
| Federal agencies such as the Department of Health and Human Services | 34% | 49% | 38% | 32% | 23% | 47% | 31% | 21% |
| State agencies such as your state Medicaid office or health insurance marketplace | 33 | 45 | 37 | 29 | 26 | 41 | 30 | 24 |
Most Trusted Sources Are Not Necessarily Where People Are Most Likely To Get Information About The Law
While health professionals and state and federal agencies top the list of trusted information sources on the ACA, the top places where people report actually getting information about the law are the news media (81 percent say they’ve heard about the law from this source in the past month) and family and friends (49 percent), both of which rank lower in terms of the public’s trust.
Behind the news media and family and friends, roughly two in ten say they’ve heard about the law from social networking sites like Facebook or Twitter (23 percent), a doctor or other health professional (22 percent), letters or brochures in the mail (20 percent), an employer (19 percent), and TV shows like “The Daily Show with Jon Stewart” (19 percent). Fewer, but still more than one in ten, say they’ve gotten information from federal agencies (16 percent), email subscriptions (16 percent), health insurance companies (15 percent), posters or billboards (15 percent), state agencies (14 percent), and non-profit groups (12 percent). Less common sources include online videos, mobile apps, and door-to-door visits.
| FIGURE 3: News Media, Family And Friends Top Sources For Hearing About ACA | |
| Percent who say they have heard about the ACA in past 30 days from each of the following | |
| Any news media | 81% |
| National or local TV news | 61 |
| Radio news or talk radio | 53 |
| Cable TV news | 52 |
| Mainly Fox News | 16 |
| Mainly CNN | 12 |
| MSNBC | 6 |
| Mainly Other/DK | 18 |
| A newspaper or magazine | 45 |
| An online news source | 37 |
| Friends and family | 49 |
| Social networking sites like Facebook or Twitter | 23 |
| Your doctor or another health care professional | 22 |
| Letters or brochures you’ve received in the mail | 20 |
| An employer | 19 |
| Shows like ‘The Daily Show with Jon Stewart’ or ‘The Colbert Report’ | 19 |
| Federal agencies such as the Department of Health and Human Services | 16 |
| An email from an organization whose listserv you are subscribed to | 16 |
| A health insurance company | 15 |
| Posters or billboards | 15 |
| State agencies such as your state Medicaid office | 14 |
| A non-profit or community organization | 12 |
| A YouTube video or any other online video | 9 |
| A mobile app on your smartphone or tablet | 7 |
| Someone who came door to door in your neighborhood, or approached you at a supermarket or mall | 2 |
Many Young People Report Getting ACA Information From Social Networking Sites, But Trust In This Information Is Low Across All Age Groups
Nearly a quarter of the public (23 percent) say they have heard something about the ACA from social networking sites like Facebook or Twitter in the past month. Not surprisingly, younger adults are much more likely than their older counterparts to say they have gotten information this way. Still, even among those ages 35 and under, higher shares report getting information from news media and friends and family than from social networking sites. While young adults are more likely to say they have gotten information from these sites, trust in them as a source of information is low across all age groups, with fewer than 5 percent in any age group saying they trust them “a lot.”
| FIGURE 4: Young Adults More Likely To Hear About ACA From Social Media, But Not More Likely To Trust | |||||
| BY AGE | |||||
| TOTAL | 18-25 | 26-35 | 36-64 | 65+ | |
| Percent who say they’ve heard about the health care law in past 30 days from each of the following | |||||
| News media (including cable, national, and local TV, radio, newspaper, and online news) | 81% | 75% | 81% | 84% | 80% |
| Friends and family | 49 | 49 | 52 | 51 | 42 |
| Social networking sites like Facebook or Twitter | 23 | 40 | 36 | 19 | 6 |
| How much would you trust information about the health care law from each of the following? | |||||
| A lot | 3% | 0% | 4% | 4% | <1% |
| Some | 16 | 17 | 20 | 16 | 12 |
| Only a little | 28 | 35 | 31 | 26 | 23 |
| Not at all | 49 | 47 | 45 | 50 | 50 |
| Don’t know/Refused | 5 | 0 | 1 | 4 | 14 |
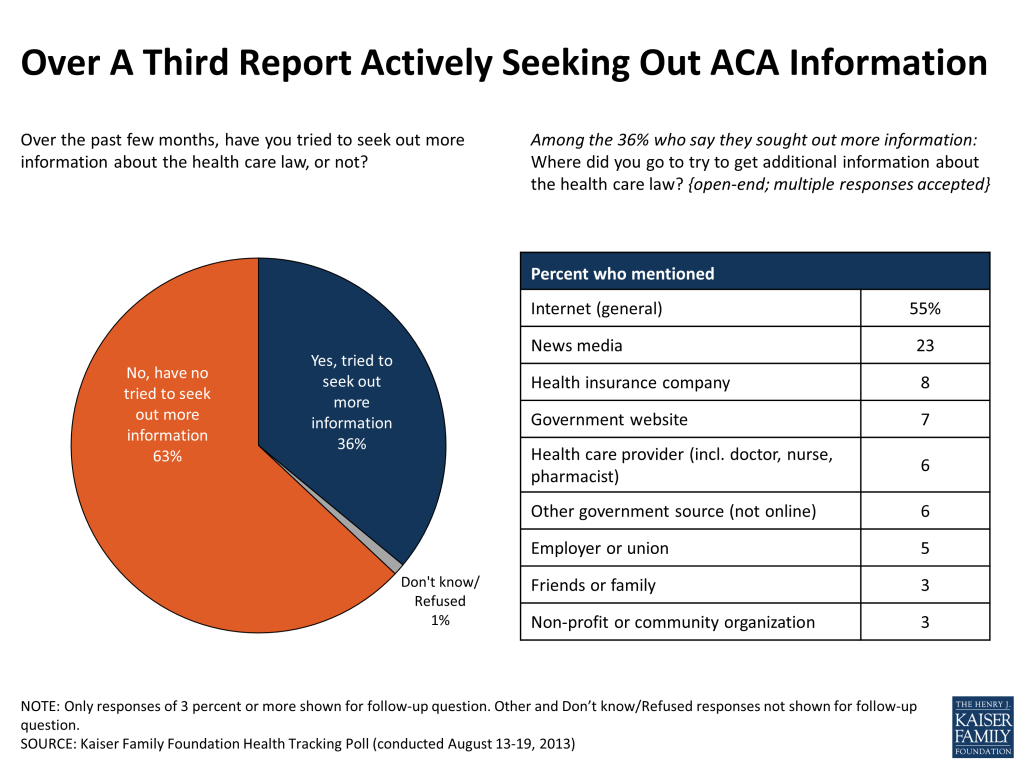
Over A Third Report Actively Seeking Out Information On The ACA
Beyond the information they happen to come across, just over a third (36 percent) of the public say they have tried to get more information about the law, including a similar share of the uninsured (33 percent). Those who have sought out information are most likely to say they turned to a general internet search (55 percent) or the news media (23 percent). Far fewer say they sought information from a health insurance company (8 percent), a government website (7 percent), a health care provider (6 percent) or another government source (6 percent).
One in ten Americans (10 percent) say they have been personally contacted by someone about the health care law through a phone call, email, text message, or door-to-door visit. The share who report being contacted is similar among some key target groups, including the uninsured and those with lower incomes.
| FIGURE 6: One In Ten Report Being Personally Contacted About ACA | |
| Percent who say they’ve been personally contacted about the health care law through a phone call, email, text message, or door-to-door visit | |
| Total | 10% |
| Uninsured, under age 65 | 12 |
| Annual household income under $40,000 | 10 |
| Age 18-25 | 6 |
| Age 26-35 | 9 |
About a quarter (27 percent) of those who reported being personally contacted say the person wanted to give them general information about the law, and about one in ten say they were contacted by someone making arguments against the law (11 percent) or by someone making arguments in favor of it (9 percent).
Confusion About Law Remains
Roughly half the public (51 percent) continues to say they don’t have enough information about the ACA to understand how it will impact them and their family, a share that has been fairly steady since 2010. The share who feel they don’t have enough information is particularly high among Hispanics (64 percent), the uninsured (62 percent), young adults (62 percent of those ages 18-25), and those with lower incomes (60 percent of those with family incomes less than $40,000 a year).
Further, a large share remains confused about the law’s status, with 44 percent either thinking the law has been repealed (8 percent), overturned by the Supreme Court (5 percent), or unsure whether it remains the law or not (31 percent).

Opinion On ACA Continues To Tilt Negative, But Majority Disapproves Of Defunding
Public opinion on the ACA as a whole continues to tilt negative this month, with 37 percent saying they have a favorable view of the law and 42 percent expressing an unfavorable view, shares that have held relatively steady since February of this year.

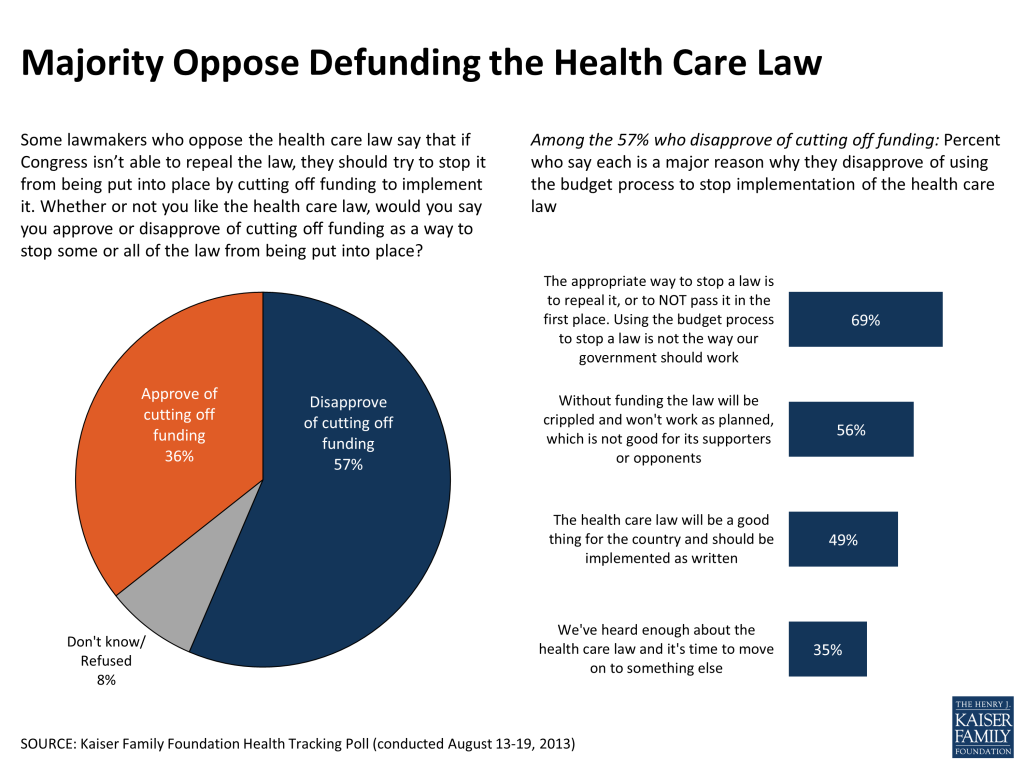
Still, a majority of Americans (57 percent) say they disapprove of the idea of cutting off funding as a way to stop the law from being implemented, a finding that has been consistent in Kaiser Health Tracking Polls since January 2011. Republicans and those with an unfavorable view of the law overall are more likely to approve of attempts to defund the ACA, but even among these groups, about a third (34 percent and 33 percent, respectively) say they disapprove.
| FIGURE 9: Majority disapproves of cutting off funding for ACA | |||||||
| Whether or not you like the health care law, would you say you approve or disapprove of cutting off funding as a way to stop some or all of the law from being put into place? | BY PARTY ID | BY FAVORABILITY OF ACA | |||||
| TOTAL | Dem | Ind | Rep | Favorable | Unfavorable | DK/Ref. | |
| Approve | 36% | 15% | 39% | 60% | 14% | 60% | 24% |
| Disapprove | 57 | 81 | 53 | 34 | 83 | 33 | 58 |
| Don’t know/Refused | 8 | 4 | 7 | 6 | 3 | 6 | 18 |
The most commonly chosen reason for opposition to defunding the ACA is that “using the budget process to stop a law is not the way our government should work,” (named as a major reason by 69 percent in this group), followed by a belief that “without funding the law will be crippled and won’t work as planned,” (56 percent) and feeling that the law will be “a good thing for the country” (49 percent). Fewer (35 percent) say their main reason for opposing defunding efforts is that they’ve “heard enough about the health care law and it’s time to move on to something else.”
More Hearing About Exchanges
With the opening of the ACA’s health insurance marketplaces less than two months away, there has been a recent uptick in the share who say they’ve heard about this particular aspect of the law. This month, a third (33 percent) say they’ve heard “a lot” or “some” about the marketplace in their state, up from 22 percent in June. Among the uninsured and those with lower incomes, two key target groups for the marketplaces, roughly three in ten say they’ve heard more than a little about the health insurance marketplaces so far. A similar share of 26-35 year-olds reports hearing about the marketplaces, though the share is closer to two in ten (21 percent) among those under age 26.
| FIGURE 11: More Report Hearing About Insurance Exchanges | ||||||
| JUNE 2013 | AUGUST 2013 | |||||
| How much, if anything, have you heard about this new health insurance marketplace, [also known as (STATE EXCHANGE NAME)] in your state? | TOTAL | TOTAL | Uninsured, under age 65 | Annual household income under $40,000 | Age 18-25 | Age 26-35 |
| A lot | 8% | 12% | 12% | 10% | 3% | 10% |
| Some | 14 | 21 | 17 | 19 | 18 | 19 |
| Only a little | 34 | 34 | 28 | 32 | 35 | 29 |
| Nothing at all | 45 | 33 | 43 | 38 | 43 | 41 |
This month’s survey also sought to shed light on previous experiences that might be relevant for navigating the ACA’s health insurance exchanges. Overall, about half the public reports having ever compared across health insurance policies to choose a plan, a share that is somewhat lower among the uninsured, those with lower incomes, blacks and Hispanics, and those ages 18-25. Furthermore, a quarter of the public overall either buys their own insurance now or has tried to do so in the past three years, and this experience is actually more common among the uninsured and those with lower incomes.
Most of the public (72 percent) says they have purchased a product online at some point, and over a third (35 percent) say they do this “often.” About six in ten (61 percent) say they’ve used the internet to access health information, including a quarter who report doing so “often.” The uninsured, Hispanics, and those with lower incomes are somewhat less likely to report experience with online purchases and accessing health information, while young adults are more likely to say they often buy products online.
| FIGURE 12: Reported Experiences That May Be Relevant For Navigating Health Insurance Exchanges | |||||||
| TOTAL | Uninsured, under age 65 | Annual household income under $40,000 | Blacks | Hispanics | Age 18-25 | Age 26-35 | |
| Percent who say they have ever had to compare health insurance policies and decide which one to choose | 53% | 39% | 44% | 44% | 36% | 22% | 53% |
| Percent who currently buy insurance on their own or have tried to in past 3 years | 25 | 37 | 30 | 28 | 24 | 19 | 26 |
| Percent who say they have used the internet to buy a product online… | |||||||
| Ever | 72% | 63% | 56% | 66% | 54% | 89% | 79% |
| Often | 35 | 19 | 19 | 31 | 20 | 44 | 45 |
| Percent who say they have used the internet to access health information… | |||||||
| Ever | 61% | 50% | 49% | 56% | 43% | 66% | 69% |
| Often | 24 | 16 | 17 | 16 | 11 | 26 | 28 |
Public Divided On Health Insurance Industry As A Whole, But Favorable About Their Own Insurance Company
The public’s views on health insurance companies as a whole generally tilt negative, with about half (49 percent) of Americans having an unfavorable view and 43 percent having a favorable one. Those who say they have tried to purchase insurance on their own in the past three years have a slightly more negative assessment of health insurance companies (59 percent have an unfavorable opinion). When it comes to their own insurance company, insured Americans are much more positive: 74 percent say they have a have a favorable view of their own insurance company, while just 23 percent are unfavorable.
| Figure 13: Views Of “Your Own” Insurance Company More Positive Than Industry As A Whole | ||||
| Do you have a favorable or unfavorable opinion of… | BY EXPERIENCE PURCHASING INSURANCE | |||
| TOTAL | Currently purchase own insurance or tried to in past 3 years | Have not tried to purchase own insurance in past 3 years | ||
| …health insurance companies | ||||
| Favorable | 43% | 35% | 46% | |
| Unfavorable | 49 | 59 | 45 | |
| …your own health insurance company (among the insured) | ||||
| Favorable | 74% | – | – | |
| Unfavorable | 23 | – | – | |
Asked how they think the ACA will impact insurance companies, a third (33 percent) think the law will leave them worse off, while about three in ten each say these companies will be better off under the law (28 percent) or see no difference (28 percent).
Ability To See One’s Own Doctor And Wide Range Of Covered Services Most Valued Features In A Health Plan
This month’s tracking poll asked what people value most in a health plan. Between a third and four in ten rated all factors we asked about – including having a comprehensive, affordable plan with good customer service, minimal paperwork, and low cost-sharing – as “extremely important”. But when forced to choose which aspect is most important, the ability to see one’s own doctor (17 percent) and having a plan that covers a wide range of services (12 percent) rise slightly higher than other factors.
Cost Both Most Liked And Least Liked Aspect Of Americans’ Health Insurance Policies
Asked specifically what they like best about their policy, a third of the insured (34 percent) mentioned cost-related factors like low out of pocket expenses or low premiums and a quarter (26 percent) named comprehensive benefits and prescription drug coverage.
| FIGURE 15: In Their Own Words: What do you like BEST about your current health insurance policy? | |
| Cost-related (low out of pocket expenses/not too expensive, affordable/someone else pays for it/low premiums/other) – 34% | “The co-pay is really low and the premiums are low.” |
| “That it doesn’t cost me anything and it’s 100% provided by my employer.” | |
| “I have an out of pocket max.” | |
| Coverage-related (good benefits and coverage, provider choice, covers prescription drugs) – 26% | “I have access to a selection of doctors without referrals.” |
| “It covers almost all of the costs of my prescriptions.” | |
| “They cover a lot more than you think they are going to cover.” | |
| Factors related to insurance company (satisfied with insurance company, little paperwork) – 14% | “Don’t have to fill out a whole lot of paperwork.” |
| “I like the statement of benefits they send me and my medical flexible spending and the co-pay statement. I like that they give me that information and I do not have to hunt it down.” | |
| Glad I have coverage/Meets needs – 11% | “I’m just happy to have coverage.” |
| Access to health care – 3% | “Having easy access to a doctor.” |
While many seem to enjoy low costs as the best feature of their plan, a similar share name high costs as the worst feature. A third of the insured (33 percent) say that high cost sharing or rising premiums are the things they like least about their policy, a figure that rises to two-thirds (63 percent) among those who purchase their own insurance.
| FIGURE 16: In Their Own Words: What do you like LEAST about your current health insurance policy? | |
| Cost-related (high cost sharing/premiums too high or going up) – 33% | “I pay a $7500 deductible and I pay about $6000 a year for that – so I don’t know how I could be enthused about that.” |
| “It has a high deductible. I chose that one to make it more affordable.” | |
| “Premiums going up so fast.” | |
| Bad coverage, doesn’t cover a specific benefit, coverage limits – 14% | “Dental care is not covered.” |
| “The restrictions on what is and is not covered” | |
| Provider issues (doctor won’t accept insurance, referrals are necessary, problems getting an appointment) – 9% | “Having to wait to get an appointment” |
| “I have to have referrals and some things have to be approved.” | |
| “Some doctors won’t see me. It’s not good enough.” | |
| Issues related to insurance company (bad communication, too much paperwork) – 7% | “They are not always clear of what they cover and what they don’t cover. They are not always clear up front.” |
| “Amount of paperwork.” | |
| Problems with prescription drugs – cost, coverage, generics – 5% | “Not all prescriptions are covered, and what the doctor prescribes the insurance won’t cover.” |
This Kaiser Health Tracking Poll was designed and analyzed by public opinion researchers at the Foundation led by Mollyann Brodie, Ph.D., including Liz Hamel, Claudia Deane, and Sarah Cho. The survey was conducted August 13-19, 2013, among a nationally representative random digit dial telephone sample of 1,503 adults ages 18 and older, living in the United States, including Alaska and Hawaii (note: persons without a telephone could not be included in the random selection process). Computer-assisted telephone interviews conducted by landline (751) and cell phone (752, including 385 who had no landline telephone) were carried out in English and Spanish by Princeton Data Source under the direction of Princeton Survey Research Associates International (PSRAI). Both the random digit dial landline and cell phone samples were provided by Survey Sampling International, LLC. For the landline sample, respondents were selected by asking for the youngest adult male or female currently at home based on a random rotation. If no one of that gender was available, interviewers asked to speak with the youngest adult of the opposite gender. For the cell phone sample, interviews were conducted with the person who answered the phone. The Kaiser Family Foundation paid for all costs associated with the survey.
The combined landline and cell phone sample was weighted to balance the sample demographics to match estimates for the national population using data from the Census Bureau’s 2011 American Community Survey (ACS) on sex, age, education, race, Hispanic origin, nativity (for Hispanics only), and region along with data from the 2010 Census on population density. The sample was also weighted to match current patterns of telephone use using data from the July-December 2012 National Health Interview Survey. The weight takes into account the fact that respondents with both a landline and cell phone have a higher probability of selection in the combined sample and also adjusts for the household size for the landline sample. All statistical tests of significance account for the effect of weighting. Weighted and unweighted values for key demographic variables are shown in the table below.
| Sample Demographics | ||
| Unweighted | Weighted | |
| Gender | ||
| Male | 48.7% | 48.5% |
| Female | 51.3% | 51.5% |
| Age | ||
| 18-24 | 8.3% | 13.5% |
| 25-34 | 13.8% | 17.6% |
| 35-44 | 11.4% | 16.1% |
| 45-54 | 16.4% | 18.6% |
| 55-64 | 22.8% | 16.6% |
| 65+ | 27.3% | 17.6% |
| Education | ||
| HS Graduate or Less | 29.7% | 41.4% |
| Some College/Assoc. Degree | 28.6% | 30.7% |
| College Grad. | 41.7% | 27.9% |
| Race/Ethnicity | ||
| White, not Hispanic | 75.0% | 67.8% |
| Black, not Hispanic | 10.4% | 11.4% |
| Hisp – US born | 4.9% | 6.9% |
| Hisp – born outside | 4.4% | 6.9% |
| Other, not Hispanic | 5.3% | 7.0% |
| Party Identification | ||
| Democrat | 32.7% | 33.3% |
| Independent | 29.8% | 29.7% |
| Republican | 23.4% | 21.3% |
| Other | 9.4% | 9.8% |
The margin of sampling error including the design effect for the full sample is plus or minus 3 percentage points. For results based on subgroups, the margin of sampling error may be higher. Sample sizes and margin of sampling errors for other subgroups are available by request. Note that sampling error is only one of many potential sources of error in this or any other public opinion poll.
Methodology for Omnibus Supplement
One additional question was asked on the Princeton Data Source omnibus survey. Different research clients purchase space on the omnibus survey and therefore additional questions covering a wide variety of topics may have preceded or followed the question shown on this topline. The Kaiser Health Tracking Poll Omnibus Supplement was conducted August 15-18, 2013, among a nationally representative random digit dial telephone sample of 1,000 adults ages 18 and older, living in the continental United States (note: persons without a telephone could not be included in the random selection process). Computer-assisted telephone interviews conducted by landline (500) and cell phone (500, including 265 who had no landline telephone) were carried out in English by Princeton Data Source under the direction of PSRAI.
The combined landline and cell phone sample was weighted to balance the sample demographics to match estimates for the national population using data from the Census Bureau’s 2011 American Community Survey (ACS) on sex, age, education, race, Hispanic origin, and region along with data from the 2010 Census on population density. The sample was also weighted to match current patterns of telephone use using data from the July-December 2012 National Health Interview Survey.
The margin of sampling error including the design effect for the full sample on the omnibus supplement is plus or minus 4 percentage points. For results based on subgroups, the margin of sampling error may be higher. Sample sizes and margin of sampling errors for other subgroups are available by request. Note that sampling error is only one of many potential sources of error in this or any other public opinion poll.
Full methodological details, including weighted and unweighted values for key demographic variables and response rates are available upon request.