Insurance Coverage Changes for People with HIV Under the ACA
New as of May 20, 2019: An Update on Insurance Coverage Among People with HIV
Prior to the Affordable Care Act (ACA), people with HIV faced limited access to insurance coverage due to several barriers, including pre-existing condition exclusions, high costs, Medicaid eligibility limitations, and other challenges. Several key provisions of the ACA removed these barriers. With discussion underway about the future of the ACA, including repealing it in full or in part, it is important to understand how the ACA has changed coverage for people with HIV.
This brief provides the first national estimates of changes in insurance coverage among people with HIV since the implementation of the ACA.1 ,2 It is based on analysis of data from the Centers for Disease Control and Prevention (CDC). We find that coverage increased significantly for people with HIV due to the ACA’s Medicaid expansion; indeed, increased Medicaid coverage in expansion states drove a nationwide increase in coverage for people with HIV. In addition, the share relying on the Ryan White HIV/AIDS Program also increased. To the extent that ACA repeal efforts include elimination of the Medicaid expansion option for states, most people with HIV who gained this type of insurance could be at risk for losing coverage. In addition, elimination of private market protections- such as bans on preexisting condition exclusions and rate setting tied to health status- would also limit access for this population.
Background
Prior to the ACA, many people with HIV faced limited access to insurance coverage due primarily to three types of barriers:
- Pre-existing conditions exclusions: Insurance issuers were able to deny individuals coverage based on pre-existing conditions (or perceived future conditions) including but not limited to being HIV positive, and HIV was generally considered an uninsurable condition.3 As a result, in most cases people with HIV were effectively barred from the individual market.
- Cost barriers: Even if someone with HIV could obtain private insurance, it was often prohibitively expensive, as rates varied by health status and other factors. In addition, in both the individual and group markets, annual and lifetime limits on coverage posed a particular challenge for people with HIV given the high cost of HIV treatment.
- Medicaid eligibility limitations: Prior to the ACA, to qualify for Medicaid in most states, an enrollee had to be both low income and “categorically eligible,” such as being disabled or pregnant, which excluded many low-income adults from coverage. This presented a “catch-22” for many low-income people with HIV who could not qualify for Medicaid until they were already quite sick and disabled, often as a result of advanced HIV and developing AIDS, despite the fact that early access to treatment could help stave off disability and prevent further transmission.4
Several key provisions of the ACA removed these barriers. These include: eliminating pre-existing conditions exclusions; prohibiting private insurers from denying coverage or charging higher premiums to individuals based on their health status; eliminating annual and lifetime benefits limits; and providing subsidies to assist with purchasing private coverage through the Marketplaces for those between 100% and 400% of the federal poverty level (FPL). In addition, the law required states to expand their Medicaid programs to cover eligible individuals below 138% of FPL, basing eligibility on income and residency status alone and addressing the catch-22 described above. Although a June 2012 US Supreme Court decision effectively made Medicaid expansion a state option, to date, 32 states (including DC) have expanded their programs (where an estimated 60% of people with HIV live).5 Still, the ruling meant that individuals who live in non-expansion states and are below 100% FPL fall into what is known as the “coverage gap” – neither eligible for the Medicaid program nor subsidies to make purchasing coverage through the Marketplaces more affordable. It is estimated that there are over 2.5 million individuals in the coverage gap, including thousands with HIV.6
To better understand how the ACA has affected coverage for people with HIV, we analyzed data from the CDC’s Medical Monitoring Project (MMP), a surveillance system that produces nationally representative information about people with HIV who are in care.7 Since the MMP currently surveys only individuals in care, data in this report is not representative of all people with HIV in the United States. We compared insurance coverage of people with HIV in care in 2012, before the implementation of major ACA expansion reforms, to 2014 (full methodology in Appendix B). In this analysis we looked at nationwide changes as well as changes within states that expanded Medicaid and those that did not expand. We also looked at whether the role of the Ryan White Program changed over this period. Since the major coverage reforms under the ACA were implemented in 2014, this data note provides an early glimpse of the insurance changes that have taken place among people with HIV in the ACA era. As was seen across the nation as a whole, it is likely that coverage gains have been greater in the subsequent years.8
Findings
Nationwide. Medicaid coverage of people with HIV in care increased significantly nationwide, rising from 36% in 2012 to 42% in 2014. The gains in Medicaid coverage were driven by those in Medicaid expansion states in the sample (where the uninsurance rate also dropped – see below). A similar increase in Medicaid coverage was not seen in non-expansion states. The share who were uninsured or with private coverage did not change significantly overall.
There were also changes for some subgroups, including by income level, race/ethnicity, and gender (detail available in Appendix A). For example, those below 100% FPL saw Medicaid coverage rates rise from 53% in 2012 to 60% in 2014, a group that also saw a decrease in uninsurance rates (falling from 22% in 2012 to 15% in 2014).

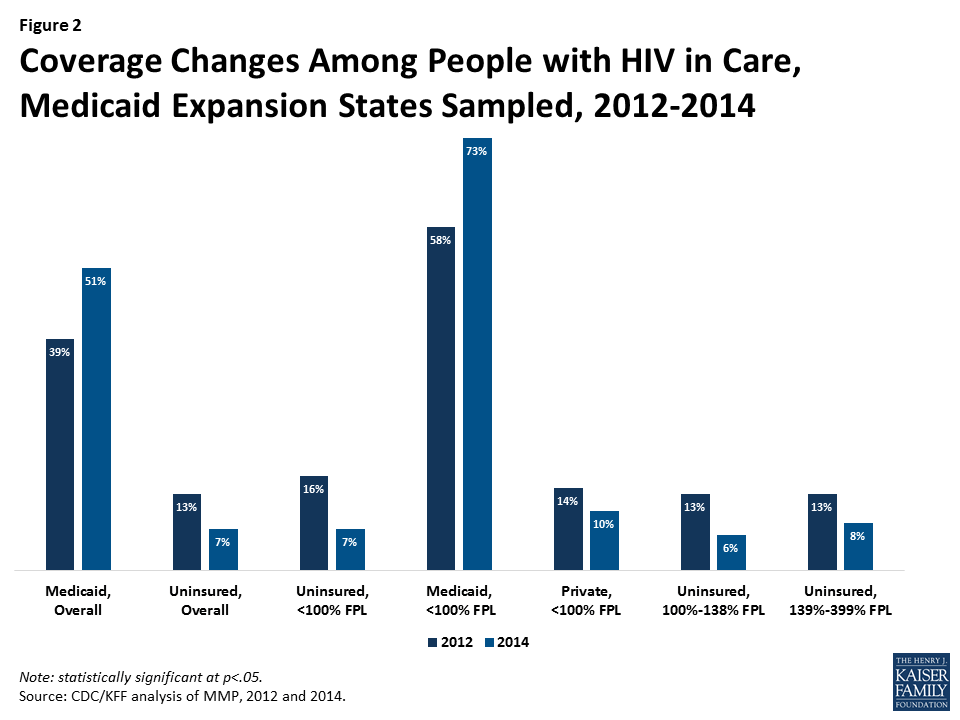
Medicaid Expansion States. In the Medicaid expansion states sampled, Medicaid coverage rose significantly, from 39% in 2012 to 51% in 2014 and the share uninsured decreased from 13% to 7%.9 Significant differences were also observed among subgroups (see Figure 2, additional detail available in Appendix A).
Non-expansion States. Among the non-expansion states sampled,10 no significant gains in coverage or drops in the share of the uninsured occurred between 2012 and 2014, though those below 100% FPL saw gains in private insurance, rising from 5% in 2012 to 13% in 2014 (additional detail available in Appendix A).

Ryan White. The role of the Ryan White Program has increased since implementation of the major coverage reforms under the ACA. Nationwide, the share of people with HIV in care relying on Ryan White rose from 42% in 2012 to 48% in 2014. In particular, the share of those with private insurance relying on the program rose from 23% in 2012 to 38% in 2014. Those with Medicaid also increased their reliance on Ryan White (from 31% in 2012 to 38% in 2014). While the uninsured did not see a significant change in reliance on Ryan White during this period, about 9 in 10 HIV positive uninsured individuals in care were already supported by the program in 2012. Additional coverage changes were observed among some subgroups (see Figure 3, additional detail available in Appendix A).
People with HIV in non-expansion also states saw a significant overall increase in reliance on Ryan White (rising from 42% in 2012 to 55% in 2014) and those with private insurance saw a particularly sharp increase in Ryan White support (rising from 17% to 38% over the same period). In the expansion states sampled, although there was no overall change in reliance on Ryan White, those with private insurance experienced increased reliance on Ryan White support, rising from 27% in 2012 to 39% in 2014.
Discussion
The ACA has played a significant role in increasing insurance coverage for people with HIV through Medicaid expansion. Even though not all states have expanded Medicaid, coverage increases for people with HIV in expansion states drove a nationwide increase. At the same time, there was no significant decrease overall in the share who were uninsured, although this drop was significant in expansion states. This is likely due to the fact that in 2014 53% of people with HIV in non-expansion states had incomes below 100% FPL and fell into the coverage gap11 . Of note, the share relying on Ryan White with Medicaid and private coverage increased, reflecting the program’s significant and growing role in assisting people with HIV who have insurance afford that coverage and providing services that may not be covered such as case management, transportation assistance, and longer more complex provider visits.12
Overall, this analysis suggests that the ACA has had a significant impact on coverage for people with HIV in the U.S., due to Medicaid expansion. To the extent that ACA repeal efforts include elimination of the Medicaid expansion option for states, most people with HIV who gained coverage would likely lose it unless states adopt alternative approaches to retaining the newly covered population in the program.
Appendix A: Tables
| Table 1. Insurance Coverage Changes Among People with HIV, 2012-2014 | |||||||||
| Coverage Type | Nationwide | Medicaid Expansion | Non-Medicaid Expansion | ||||||
| 2012 | 2014 | 2012 | 2014 | 2012 | 2014 | ||||
| Coverage Type, Overall | |||||||||
| Uninsured | 18% | 14% | 13%* | 7%* | 26% | 23% | |||
| Private | 31% | 30% | 34% | 29% | 26% | 32% | |||
| Medicaid | 36%* | 42%* | 39%* | 51%* | 31% | 28% | |||
| Coverage Type, by Gender | |||||||||
| Male | Uninsured | 19% | 14% | 14%* | 7%* | 27% | 24% | ||
| Private | 35% | 34% | 37% | 32% | 31% | 36% | |||
| Medicaid | 30%* | 37%* | 34%* | 47%* | 24% | 23% | |||
| Female | Uninsured | 17%* | 12%* | 11%* | 6%* | 23% | 17% | ||
| Private | 19% | 20% | 23% | 18% | 15%* | 23%* | |||
| Medicaid | 52% | 54% | 57% | 65% | 47% | 41% | |||
| Coverage Type, by Income | |||||||||
| <100% FPL | Uninsured | 22%* | 15%* | 16%* | 7%* | 30% | 26% | ||
| Private | 10% | 11% | 14%* | 10%* | 5%* | 13%* | |||
| Medicaid | 53%* | 60%* | 58%* | 72%* | 47% | 43% | |||
| 100-138% FPL | Uninsured | 17% | 13% | 13%* | 6%* | 23% | 24% | ||
| Private | 17% | 22% | 18% | 18% | 16% | 26% | |||
| Medicaid | 45% | 43% | 51% | 56% | 37%* | 24%* | |||
| 139-399% FPL | Uninsured | 17% | 13% | 13%* | 8%* | 23% | 20% | ||
| Private | 46% | 48% | 48% | 46% | 43% | 51% | |||
| Medicaid | 19% | 21% | 22% | 28% | 15% | 11% | |||
| 400%+ FPL | Uninsured | 4% | – | – | – | 7% | – | ||
| Private | 87% | 90% | 87% | 91% | 86% | 89% | |||
| Medicaid | – | 4% | – | 5% | – | – | |||
| Coverage Type, by Race/Ethnicity | |||||||||
| White | Uninsured | 12%* | 7%* | 8%* | 2%* | 19% | 16% | ||
| Private | 47% | 44% | 49% | 45% | 44% | 44% | |||
| Medicaid | 25%* | 34%* | 26%* | 39%* | 22% | 24% | |||
| Black | Uninsured | 21%* | 14%* | 13%* | 5%* | 29%* | 22%* | ||
| Private | 21% | 25% | 24% | 19% | 18%* | 29%* | |||
| Medicaid | 47% | 48% | 52%* | 63%* | 42% | 35% | |||
| Hispanic | Uninsured | 25% | 22% | 24%* | 17%* | 26% | 30% | ||
| Private | 22% | 21% | 23% | 19% | 20% | 24% | |||
| Medicaid | 32% | 39% | 41%* | 52%* | 17% | 17% | |||
| * Indicates coverage changes statistically significant at p<.05 Note: Medicaid expansion and non-Medicaid expansion data only representative of states sampled and are not generalizable to all states with that expansion decision. Medicaid expansion states sampled are DE, IL, IN, MI, NJ, NY, OR, PA, WA, and CA. The non-expansion states sampled are FL, GA, MS, NC, VA, and TX. | |||||||||
| Table 2. Ryan White Coverage Changes Among People with HIV, 2012-2014 | |||||||||
| Coverage Type | Nationwide | Medicaid Expansion | Non-Medicaid Expansion | ||||||
| 2012 | 2014 | 2012 | 2014 | 2012 | 2014 | ||||
| Coverage Type, Overall | |||||||||
| Uninsured | 88% | 91% | 90% | 88% | 87% | 92% | |||
| Private | 23%* | 38%* | 27%* | 39%* | 17%* | 38%* | |||
| Medicaid | 31%* | 38%* | 32% | 36% | 30% | 42% | |||
| Total | 42%* | 48%* | 42% | 43% | 42%* | 55%* | |||
| Coverage Type, by Gender | |||||||||
| Male | Uninsured | 89% | 90% | 91% | 88% | 87% | 91% | ||
| Private | 23%* | 38%* | 28%* | 38%* | 15%* | 38%* | |||
| Medicaid | 36%* | 43%* | 37% | 42% | 33% | 47% | |||
| Female | Uninsured | 89% | 91% | 85% | 86% | 91% | 93% | ||
| Private | 23%* | 39%* | 23%* | 46%* | 23% | 34% | |||
| Medicaid | 24% | 27% | 23% | 23% | 25% | 34% | |||
| Coverage Type, by Income | |||||||||
| <100% FPL | Uninsured | 88% | 92% | 88% | 87% | 89% | 93% | ||
| Private | 33%* | 56%* | 31%* | 52%* | 40%* | 60%* | |||
| Medicaid | 28% | 34% | 29% | 31% | 26%* | 42%* | |||
| 100-138% FPL | Uninsured | 87% | 87% | 86% | 84% | 87% | 88% | ||
| Private | 44% | 61% | 45%* | 75%* | 43% | 47% | |||
| Medicaid | 36%* | 49%* | 36%* | 51%* | 35% | 41% | |||
| 139-399% FPL | Uninsured | 92% | 89% | 94% | 88% | 89% | 90% | ||
| Private | 31%* | 45%* | 37%* | 49%* | 21%* | 41%* | |||
| Medicaid | 44% | 50% | 46% | 53% | – | 42% | |||
| 400%+ FPL | Uninsured | 83% | 100% | 100% | 100% | 73% | 100% | ||
| Private | 8% | 9% | 12% | 11% | – | – | |||
| Medicaid | 44% | – | 50% | – | – | – | |||
| Coverage Type, by Race/Ethnicity | |||||||||
| White | Uninsured | 91% | 90% | 91%* | 70%* | 91%* | 96%* | ||
| Private | 21%* | 35%* | 26%* | 36%* | – | 33% | |||
| Medicaid | 40%* | 54%* | 41% | 53% | – | 58% | |||
| Black | Uninsured | 87% | 87% | 87% | 79% | 88% | 89% | ||
| Private | 25%* | 41%* | 28%* | 40%* | 21%* | 42%* | |||
| Medicaid | 29% | 33% | 30% | 29% | 27% | 39% | |||
| Hispanic | Uninsured | 87%* | 95%* | 93% | 94% | 79%* | 95%* | ||
| Private | 24%* | 40%* | 25%* | 45%* | 23% | 34% | |||
| Medicaid | 27% | 30% | 26% | 29% | – | 38% | |||
| * Indicates coverage changes statistically significant at p<.05Note: Medicaid expansion and non-Medicaid expansion data only representative of states sampled and are not generalizable to all states with that expansion decision. Medicaid expansion and non-Medicaid expansion data only representative of states sampled and are not generalizable to all states with that expansion decision. Medicaid expansion states sampled are DE, IL, IN, MI, NJ, NY, OR, PA, WA, and CA. The non-expansion states sampled are FL, GA, MS, NC, VA, and TX. | |||||||||
Appendix B: Methods
DATA SOURCE:
This analysis relies on data from the Medical Monitoring Project (MMP), a CDC surveillance system designed to produce nationally representative estimates of behavioral and clinical characteristics of HIV-infected adults (those aged 18 and older) in the United States.13 During 2009–2014, MMP employed a three-stage, complex sampling design in which US states and territories were sampled, followed by facilities providing outpatient HIV clinical care in those jurisdictions, and then HIV-infected adults (aged 18 years and older) receiving care in those facilities. We used MMP data collected from adults with at least one HIV clinical care visit to participating facilities during January to April of 2013 and 2014. Findings describe adults receiving HIV clinical care during these time periods.
Data used in this analysis were collected via face-to-face interviews and medical record abstractions between June 1, 2012 and May 31, 2013 for the 2012 cycle and June 1, 2014 and May 31, 2015 for the 2014 cycle. All sampled states and territories participated in MMP. In 2012, of 548 sampled facilities within these states or territories, 467 participated in MMP (facility response rate 85%), and of 9,394 sampled persons, 4,901 completed both an interview and a linked medical record abstraction (adjusted patient-level response rate 53%)%.14 In 2014, of 561 sampled facilities within these states or territories, 485 participated in MMP (facility response rate 86%), and of 9,400 sampled persons, 5,154 completed both an interview and a linked medical record abstraction (adjusted patient-level response rate 56%).15 Data were weighted based on known probabilities of selection at state or territory, facility, and patient levels. In addition, data were weighted to adjust for non-response using predictors of patient-level response. Although characteristics associated with nonresponse varied over time, the following characteristics were generally associated with nonresponse and informed weighting classes: facility size, private practice, younger age, black and Hispanic race, and shorter time since HIV diagnosis. This analysis includes information on 4,901 participants in 2012 and 5,154 in 2014 who represent all HIV positive individuals receiving care in the United States and Puerto Rico during the time in which they were sampled.
ANALYSIS:
For all respondents in MMP, we examined self-reported insurance coverage as well as payment source for antiretroviral medicines using responses to the following questions “During the past 12 months, what were all the kinds of health insurance or health coverage you had?” and “During the past 12 months, what were the ways your antiretroviral medicines were paid for?” Response options included insurance programs (Medicaid, Medicare, private insurance, Veteran’s Administration, Tricare or CHAMPUS coverage, other public insurance, and other unspecified insurance) as well as medical care, medications and other services paid for by the Ryan White HIV/AIDS Program (Ryan White or the AIDS Drug Assistance Program). “Other specify” responses were extensively recoded to reflect the most accurate coverage type when possible. It is important to note that patients may not be aware of all the services they receive that are paid for by the Ryan White HIV/AIDS Program (the program provides funding directly to service organizations in many cases) and therefore, the estimates of the number of individuals who receive Ryan White HIV/AIDS Program services is likely an underestimate.
We estimated weighted percentages of individuals with the following types of health care coverage: no coverage (uninsured), private insurance, Medicaid, Medicare, and other (specified). Because respondents in MMP may indicate more than one type of coverage, we relied on a hierarchy to group people into mutually-exclusive coverage categories. Specifically, the hierarchy groups people into coverage types in the following order:
- Private coverage
- Medicaid coverage, including those dually eligible for Medicare
- Medicare coverage only
- Other public coverage, including Tricare/CHAMPUS, Veteran’s Administration, or city/county coverage
In most cases, this hierarchy classifies individuals according to the coverage source that serves as their primary payer. People who do not report any of the sources of insurance coverage above are classified as uninsured. As noted above, we separately assess weighted percentages of persons receiving assistance through the Ryan White HIV/AIDS Program by health coverage type. This analysis depicts coverage for those who are uninsured, covered by private insurance, or covered by Medicaid. Findings related to those with other coverage or Medicare were excluded from this analysis given that insurance changes within those categories would not have been impacted by the ACA provisions examined for this work.
We assessed distributions of health coverage type in 2012 compared to 2014, overall and by whether the participant lived in a Medicaid expansion or non-Medicaid expansion state (as of 2014). We further stratified the analysis to examine health coverage types by income, race/ethnicity, and gender. Income is presented as a share of the federal poverty level (FPL); race/ethnicity, and gender was self-reported. Statistical comparisons between the percentage of the population with a particular health coverage type and the percentage receiving Ryan White HIV/AIDS Program assistance in 2012 compared to 2014 were made using chi-square tests.
LIMITATIONS:
MMP is nationally representative only of those with HIV who are in care and does not include those who are diagnosed but not in care or those not yet diagnosed. (MMP is now including those who are diagnosed but not in care in the sample and that data will be available in the future).
MMP only allows for extrapolation to the national level when using the full sample. However, similar extrapolation is not possible when examining coverage changes in and contrasting Medicaid expansion states and non-expansion states. The Medicaid expansion and non-expansion coverage data presented here are representative only of the subset of states sampled that fell into each group.16
It is also important to note that these data reflect only the first two open enrollment periods of the ACA and therefore it is possible that coverage has continued to increase (as it has for the U.S. population overall).
The MMP categorized gender as male, female, or transgender based on self-identification. Participants are also classified as transgender if reported sex at birth and current reported gender differ. Findings by gender are presented only by male and female categories in this analysis due to the limited sample size of transgender individuals and the fact that no coverage changes among this population met statistical significance.
- CDC, special data request, October 16, 2013 and Bradley H, Prejean J, Dawson L, Kates, J, Shouse RL. Health care coverage and viral suppression pre- and post-ACA implementation. Poster (#1012) presented at: the Conference on Retroviruses and Opportunistic Infections (CROI) 2017; February 14, 2017; Seattle, WA. ↩︎
- A subset of the data presented here was also released at the 2017 annual Conference on Retroviruses and Opportunistic Infections (CROI) in February 2017. ↩︎
- Claxton, G., et al. Kaiser Family Foundation. Pre-existing Conditions and Medical Underwriting in the Individual Insurance Market Prior to the ACA. December 2016. Available at: https://modern.kff.org/health-reform/issue-brief/pre-existing-conditions-and-medical-underwriting-in-the-individual-insurance-market-prior-to-the-aca/ ↩︎
- Department of Health and Human Services, Panel on Antiretroviral Guidelines for Adults and Adolescents (2013). Guidelines for the use of antiretroviral agents in HIV-1-infected adults and adolescents, July 14, 2016. Available at: http://aidsinfo.nih.gov/guidelines/html/1/adult-and-adolescent-treatment-guidelines/0/. ↩︎
- Kaiser Family Foundation analysis of CDC surveillance data. ↩︎
- Kaiser Family foundation. State Health Facts. Characteristics of Poor Uninsured Nonelderly Adults in the ACA Coverage Gap. Available at: https://modern.kff.org/health-reform/state-indicator/characteristics-of-poor-uninsured-nonelderly-adults-in-the-aca-coverage-gap/?currentTimeframe=0 and Dept. of Health and Human Service. ASPE Issue Brief. Health Insurance Marketplace Enrollment Projections for 2017. October 2016. Available at: https://aspe.hhs.gov/sites/default/files/pdf/211056/EnrollmentProjections.pdf ↩︎
- For the 2014 data, MMP only collected information on those in care. The MMP is now including those who are diagnosed but not in care in the sample and that data will be available in the future ↩︎
- See for example: Kaiser Family Foundation. State Health Facts. Health Insurance Coverage of the Total Population, 2013-2015. https://modern.kff.org/other/state-indicator/total-population/?currentTimeframe=0 ↩︎
- The Medicaid expansion states sampled by the MMP are Delaware, Illinois, Indiana, Michigan, New Jersey, New York, Oregon, Pennsylvania, Washington and California. ↩︎
- The non-expansion states sampled by the MMP are Florida, Georgia, Mississippi, North Carolina, Virginia and Texas. ↩︎
- Kates, J., et al. Kaiser Family Foundation. Assessing the Impact of the Affordable Care Act on Health Insurance Coverage of People with HIV. January 2014. https://modern.kff.org/hivaids/issue-brief/assessing-the-impact-of-the-affordable-care-act-on-health-insurance-coverage-of-people-with-hiv/view/footnotes/#footnote-97557-6 ↩︎
- See for example: Dawson, L. and Kates, J. Kaiser Family Foundation. The Ryan White Program and Insurance Purchasing in the ACA Era: An Early Look at Five States. April 2015. Available at: https://modern.kff.org/hivaids/issue-brief/the-ryan-white-program-and-insurance-purchasing-in-the-aca-era/ ↩︎
- An Institute of Medicine report commissioned by the White House recommended MMP to help identify data sources for monitoring the effects of the Affordable Care Act (ACA) on HIV care and coverage in the United States. See: IOM (Institute of Medicine). 2012. Monitoring HIV care in the United States: A strategy for generating national estimates of HIV care and coverage. Washington, DC: The National Academies Press. ↩︎
- Centers for Disease Control and Prevention. Behavioral and Clinical Characteristics of Persons Receiving Medical Care for HIV Infection—Medical Monitoring Project, United States, 2014 Cycle (June 2014–May 2015). HIV Surveillance Special Report 17. December 2016. Available at: https://www.cdc.gov/hiv/pdf/library/reports/surveillance/cdc-hiv-hssr-mmp-2014.pdf. ↩︎
- Centers for Disease Control and Prevention. Behavioral and Clinical Characteristics of Persons Receiving Medical Care for HIV Infection—Medical Monitoring Project, United States, 2012. HIV Surveillance Special Report 12. August 2015. Available at: https://www.cdc.gov/hiv/pdf/library/reports/surveillance/cdc-hiv-hssr-mmp-2014.pdf ↩︎
- The Medicaid expansion states sampled by the MMP are Delaware, Illinois, Indiana, Michigan, New Jersey, New York, Oregon, Pennsylvania, Washington and California. The non-expansion states sampled by the MMP are Florida, Georgia, Mississippi, North Carolina, Virginia and Texas. ↩︎