How Affordable Care Act Repeal and Replace Plans Might Shift Health Insurance Tax Credits
Note: As of May 4, 2017, the American Health Care Act would allow states to waive certain consumer protections, including essential health benefits, community rating and age rating. If a state takes up such a waiver, the premium amounts for that state in this brief would no longer be applicable. For example, enrollee costs could depend on their health status, with healthy people paying less and sicker people or those with pre-existing conditions paying more.
An important part of the repeal and replacement discussions around the Affordable Care Act (ACA) will involve the type and amount of subsidies that people get to help them afford health insurance. This is particularly important for lower and moderate income individuals who do not have access to coverage at work and must purchase coverage directly.
The ACA provides three types of financial assistance to help people afford health coverage: Medicaid expansion for those with incomes below 138% of poverty (the Supreme Court later ruled this to be at state option); refundable premium tax credits for people with incomes from 100% to 400% of the poverty level who purchase coverage through federal or state marketplaces; cost-sharing subsidies for people with incomes from 100% to 250% of poverty to provide lower deductibles and copays when purchasing silver plans in a marketplace.
This analysis focuses on alternative ways to provide premium assistance for people purchasing individual market coverage, explaining how they work, providing examples of how they’re calculated, and presenting estimates of how assistance overall would change for current ACA marketplace enrollees. Issues relating to changing Medicaid or methods of subsidizing cost-sharing will be addressed in other analyses.
Premium Tax Credits Under the ACA and Current Replacement Proposals
The ACA and leading replacement proposals rely on refundable tax credits to help individual market enrollees pay for premiums, although the credit amounts are set quite differently. The House Leadership proposal released on March 6, the American Health Care Act, proposes refundable tax credits which vary with age (with a phase-out for high-income enrollees) and grow annually with inflation. The tax credits under the ACA vary with family income and the cost of insurance where people live, as well as age, and grow annually if premiums increase.
These various tax credit approaches can have quite different implications for different groups of individual market purchasers. For example, the tax credits under the ACA are higher for people with lower incomes than for people with higher incomes, and no credit is provided for individuals with incomes over 400% of poverty. The current replacement proposal, in contrast, is flat for incomes up to $75,000 for an individual and $150,000 for a married couple, and so would provide relatively more assistance to people with upper-middle incomes. Similarly, the ACA tax credits are relatively higher in areas with higher premiums (like many rural areas), while the replacement proposal credits do not vary by location. If premiums grow more rapidly than inflation over time (which they generally have), the replacement proposal tax credits will grow more slowly than those provided under the ACA.
What is a Tax Credit, and How is it Different from a Deduction?
A tax credit is an amount by which a taxpayer can reduce the amount they owe in federal income tax; for example, if a person had a federal tax bill of $2,500 and a tax credit of $1,000, their tax liability would be reduced to $1,500. A refundable tax credit means that if the amount of the tax credit is greater than the amount of taxes owed, the taxpayer receives a refund of the difference; for example, if a person had a federal tax bill of $1000 and a tax credit of $1,500, they would receive a refund of $500. Making the credit refundable is important if a goal is to assist lower-income families, many of whom may not owe federal income tax. An advanceable tax credit is made available at the time a premium payment is owed (which similarly benefits lower-income families so that they can receive the financial assistance upfront). The ACA and a number of replacement proposals allow for advance payment of credits.
A tax credit is different from a tax deduction. A deduction reduces the amount of income that is taxed, while a credit reduces the amount of tax itself. For example, if a person has taxable income of $30,000, a $500 deduction reduces the amount of taxable income to $29,500. If the person’s marginal tax rate is 15%, the deduction reduces the person’s taxes by 15% of $500, or $75. Because people with lower incomes have lower marginal tax rates than people with higher incomes – and, typically don’t itemize their deductions – tax credits are generally more beneficial to lower income people than deductions.
The next section describes the differing tax credit approaches in more detail and draws out some of the implications for different types of purchasers.
How the Different Tax Credits Are Calculated
The ACA provides tax credits for individuals with family incomes from 100% to 400% of poverty ($11,880 to $47,520 for a single individual in 2017) if they are not eligible for employer-provided or public coverage and if they purchase individual market coverage in the federal or a state marketplace. The tax credit amounts are calculated based on the family income of eligible individuals and the cost of coverage in the area where the live. More specifically, the ACA tax credit for an eligible individual is the difference between a specified percentage of his or her income (Table 1) and the premium of the second-lowest-cost silver plan (referred to as the benchmark premium) available in the area in which they live. There is no tax credit available if the benchmark premium is less than the specified percentage of income (which can occur for younger purchasers with relatively higher incomes) or if family income falls outside of the 100% to 400% of poverty range. For families, the premiums for family members are added together (including up to 3 children) and compared to specified income percentages. ACA tax credits are made available in advance, based on income information provided to the marketplace, and reconciled based on actual income when a person files income taxes the following.
| Table 1: Affordable Care Act Tax Credit Premium Cap, by Income in 2017 | |
| Income % Poverty | Premium Cap (maximum % of income one must pay for second-lowest silver plan available to in their area) |
| Under 100% | No Cap |
| 100% – 133% | 2.04% |
| 133% – 150% | 3.06% – 4.08% |
| 150% – 200% | 4.08% – 6.43% |
| 200% – 250% | 6.43% – 8.21% |
| 250% – 300% | 8.21% – 9.69% |
| 300% – 400% | 9.69% |
| Over 400% | No Cap |
| Source: Kaiser Family Foundation | |
Take, for example, a person age 40 with income of $30,000, which is 253% of poverty. At this income, the person’s specified percentage of income is 8.28% in 2017, which means that the person receives a tax credit if he or she has to pay more than 8.28% of income (or $2,485 annually) for the second-lowest-cost silver premium where he or she lives. If we assume a premium of $4,328 (the national average benchmark premium for a person age 40 in 2017), the person’s tax credit would be the difference between the benchmark premium and the specified percentage of income, or $4,328 – $2,485 = $1,843 (or $154 per month).
The American Health Care Act takes a simpler approach and specifies the actual dollar amounts for a new refundable tax credit that could be used to purchase individual market coverage. The amounts vary only with age up until an income of $75,000 for a single individual, at which point they begin to phase out. Tax credits range from $2,000 for people under age 30, to $2,500 for people ages 30 to 39, $3,000 for people age 40 to 49, $3,500 for people age 50 to 59, and $4,000 for people age 60 and over starting in 2020. Eligibility for the tax credit phases out starting at income above $75,000 for single individuals (the credit is reduced, but not below zero, by 10 cents for every dollar of income above this threshold, reaching zero at an income of $95,000 for single individuals up to age 29 or $115,000 for individuals age 60 and older). For joint filers, credits begin to phase out at an income of $150,000 (the tax credit is reduced to zero at an income of $190,000 for couples up to age 29; it is reduced to zero at income $230,000 for couples age 60 or older; and it is reduced to zero at income of $290,000 for couples claiming the maximum family credit amount). People who sign up for public programs such as Medicare, Medicaid, public employee health benefit programs, would not be eligible for a tax credit. The proposal further limits eligibility for tax credits to people who do not have an offer available for employer-provided health benefits.
Table 2 shows how projected ACA tax credits in 2020 compare to what would be provided under the American Health Care Act for people at various incomes, ages, and geographic areas. To show the ACA amounts in 2020, we inflated all 2017 premiums based on projections for direct purchase spending per enrollee from the National Health Expenditure Accounts. This method applies the same premium growth across all ages and geographic locations. Note that the table does not include cost-sharing assistance under the ACA that lowers deductibles and copayments for low-income marketplace enrollees. For example, in 2016, people making between 100 – 150% of poverty enrolled in a silver plan on healthcare.gov received cost-sharing assistance worth $1,440; those with incomes between 150 – 200% of poverty received $1,068 on average; and those with incomes between 200 – 250% of poverty received $144 on average.
| Table 2: Projected Annual Premium Tax Credit available in the Individual Market under the Affordable Care Act and the American Health Care Act, 2020 | |||||||
| Income (2020 FPL) | Age | Affordable Care Act | American Health Care Act | ||||
| Reno, NV | US Average | Mobile, AL | Reno, NV | US Average | Mobile, AL | ||
| $20,000 (160% FPL) | 27 | $2,899 | $3,225 | $4,522 | $2,000 | $2,000 | $2,000 |
| 40 | $3,745 | $4,143 | $5,725 | $3,000 | $3,000 | $3,000 | |
| 60 | $9,030 | $9,874 | $13,235 | $4,000 | $4,000 | $4,000 | |
| $40,000 (320% FPL) | 27 | $0 | $103 | $1,400 | $2,000 | $2,000 | $2,000 |
| 40 | $623 | $1,021 | $2,603 | $3,000 | $3,000 | $3,000 | |
| 60 | $5,908 | $6,752 | $10,113 | $4,000 | $4,000 | $4,000 | |
| $75,000 (600% FPL) | 27 | $0 | $0 | $0 | $2,000 | $2,000 | $2,000 |
| 40 | $0 | $0 | $0 | $3,000 | $3,000 | $3,000 | |
| 60 | $0 | $0 | $0 | $4,000 | $4,000 | $4,000 | |
| $100,000 (800% FPL) | 27 | $0 | $0 | $0 | $0 | $0 | $0 |
| 40 | $0 | $0 | $0 | $500 | $500 | $500 | |
| 60 | $0 | $0 | $0 | $1,500 | $1,500 | $1,500 | |
| Source: Kaiser Family Foundation analysis. Notes: In the 2017 ACA exchange markets, premiums in Reno, NV and Mobile, AL are approximately representative of the 25th and 75th percentile, respectively. 2017 ACA premiums were increased according to National Health Expenditure projections for direct purchase. Under the ACA, people with incomes below 250% of the poverty level receive additional financial assistance for cost-sharing (not shown above). | |||||||
Under the ACA in 2020, we project that a typical 40-year-old making $20,000 per year would be eligible for $4,143 in premium tax credits (not including the additional cost-sharing subsidies to lower his or her deductibles and copayments), while under the American Health Care Act, this person would be eligible $3,000. For context, we project that the average ACA premium for a 40-year-old in 2020 would be $5,101 annually (meaning the tax credit in the ACA would cover 81% of the total premium) for a benchmark silver plan with comprehensive benefits and reduced cost-sharing. A $3,000 tax credit for this same individual under the American Health Care Act would represent 59% of the average 40-year-old benchmark silver premium under the ACA.
Generally, the ACA has higher tax credit amounts than the replacement plan for lower-income people – especially for those who are older and live in higher-cost areas – and lower credits for those with higher incomes. Unlike the ACA, the replacement plan provides tax credits to people over 400% percent of the poverty level (phasing out around 900% of poverty for a single person), as well as to people current buying individual market coverage outside of the marketplaces (not included in this analysis).
While replacement plan tax credits vary by age – by a factor of 2 to 1 for older adults relative to younger ones – the variation is substantially less than under the ACA. The big differences in ACA tax credits at different ages is due to the fact that premiums for older adults can be three times the level of premiums for younger adults under the ACA, but all people at a given income level are expected to pay the same percentage of their income towards a benchmark plan. The tax credit fills in the difference, and this amount is much higher for older adults. These differences by age would be even further magnified under the American Health Care Act (which permits premiums to vary by a factor of 5 to 1 due to age). Before the ACA, premiums for older adults were typically four or five times the premiums charged to younger adults.
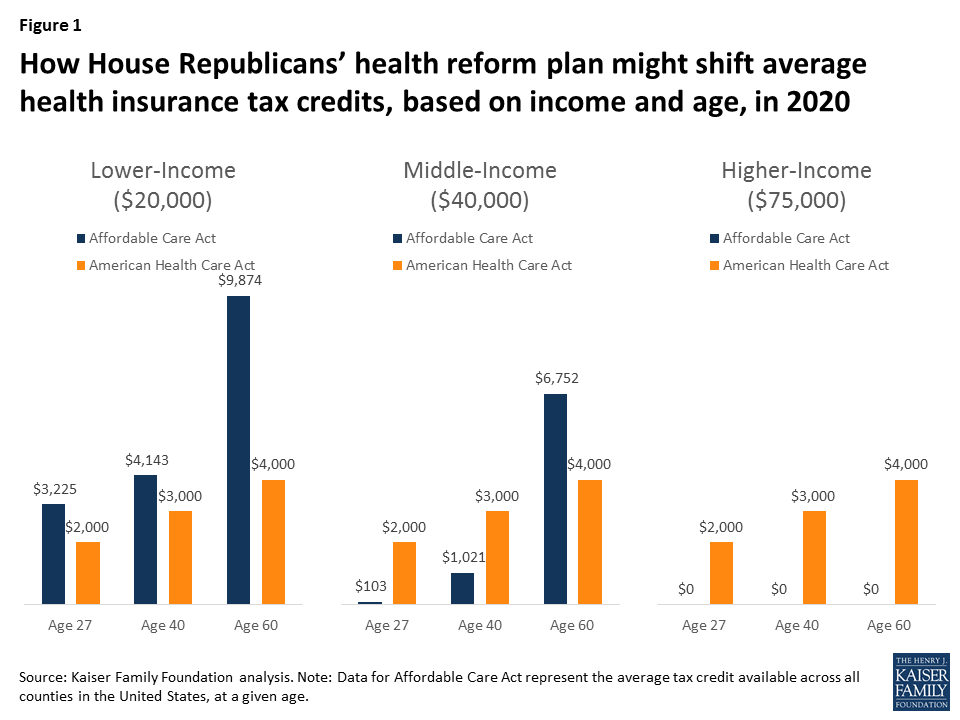
Figure 1: How House Republicans’ health reform plan might shift average health insurance tax credits, based on income and age, in 2020
The tax credits in the ACA vary significantly with premium costs in an area (see Table 2 and Figure 2). At a given income level and age, people receive bigger tax credits in a higher premium area like Mobile, Alabama and smaller tax credits in a lower premium area like Reno, Nevada. Under the ACA in 2017, premiums in Mobile, Alabama and Reno, Nevada approximately represent the 75th and 25th percentile, respectively.
The disparities between the ACA tax credits and those in the American Health Care Act will therefore vary noticeably across the country. For more on geographic differences between the ACA and the replacement plan, see Tax Credits under the Affordable Care Act vs. the American Health Care Act: An Interactive Map.
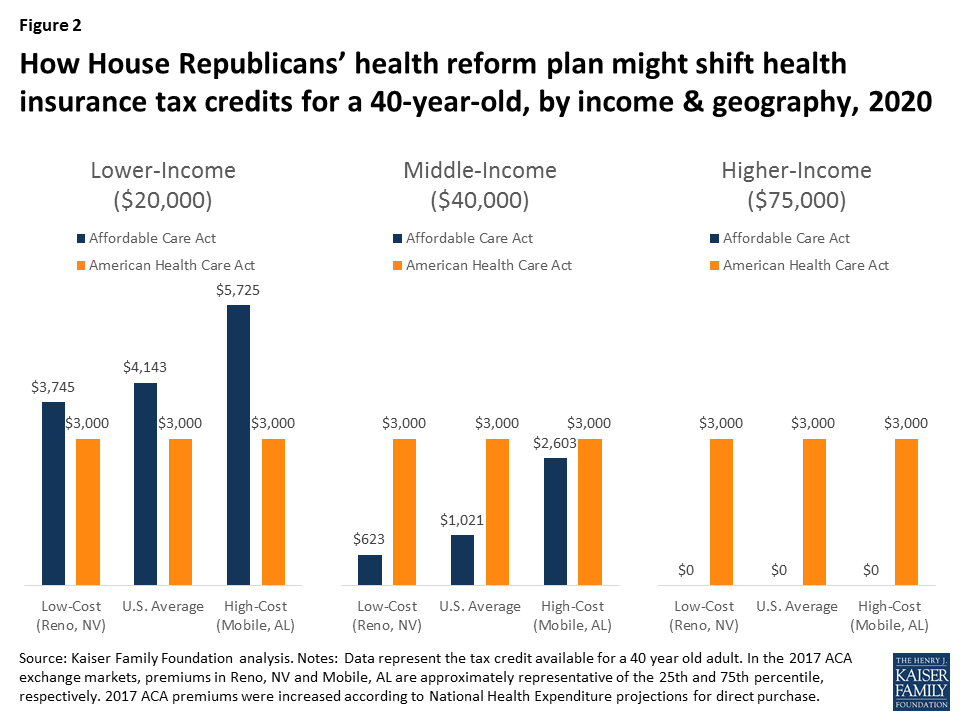
Figure 2: How House Republicans’ health reform plan might shift health insurance tax credits for a 40-year-old, by income & geography, 2020
The same general pattern can be seen for families as individuals, with lower-income families – and particularly lower-income families in higher-cost areas – receiving larger tax credits under the ACA, while middle-income families in lower-cost areas would receive larger tax credits under the American Health Care Act (Figure 3).
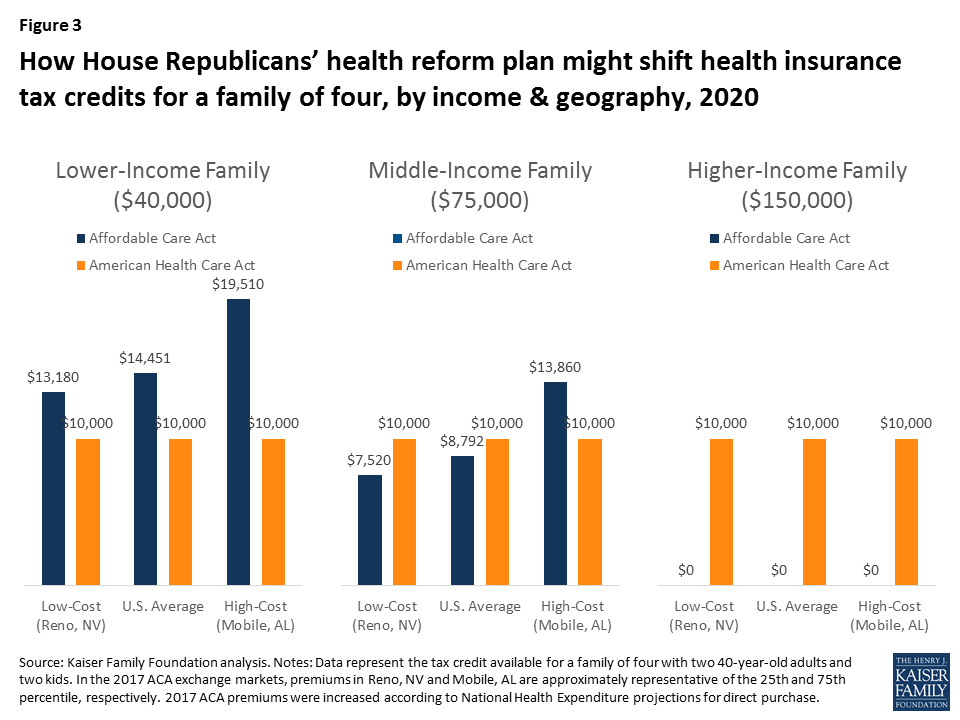
Figure 3: How House Republicans’ health reform plan might shift health insurance tax credits for a family of four, by income & geography, 2020
Figure 4 below shows how tax credits under the ACA differ from those in the American Health Care Act for a couple in their 60’s with no children. In this scenario, because premiums for older adults are higher and the ACA ties tax credits to the cost of premiums, a 60-year-old couple would receive larger tax credits under the ACA than the American Health Care Act at lower and middle incomes, but would receive a larger tax credit under the American Health Care Act at higher incomes.
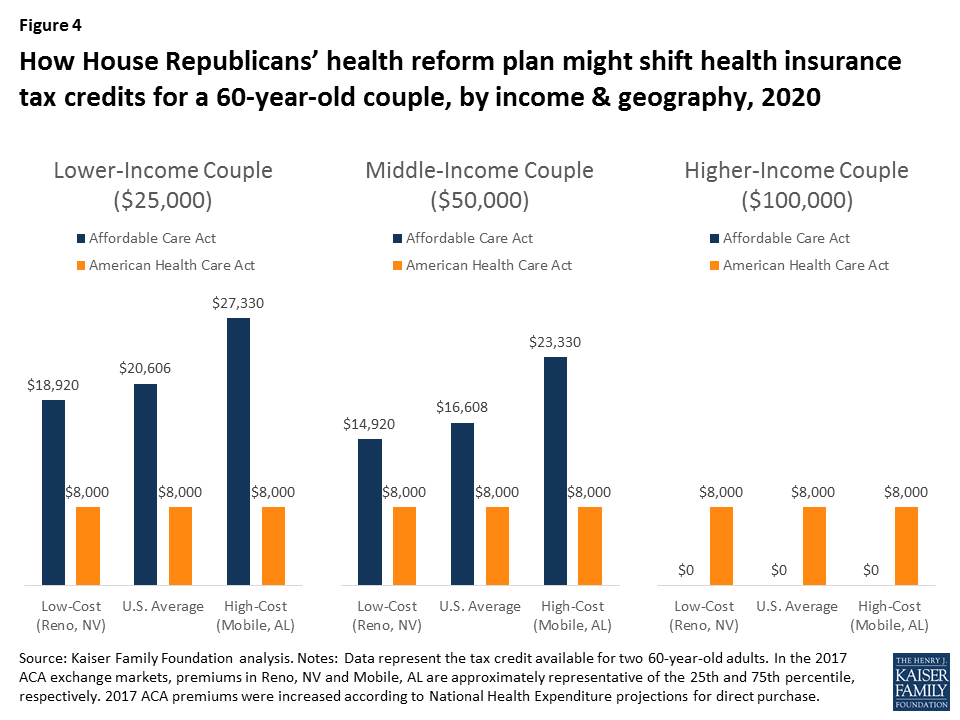
Figure 4: How House Republicans’ health reform plan might shift health insurance tax credits for a 60-year-old couple, by income & geography, 2020
Estimates of Tax Credits Under the ACA and the American Health Care Act Over Time
We estimated the average tax credits that current ACA marketplace enrollees are receiving under the ACA and what they would qualify for if the American Health Care Act were in place.
| Table 3: Average Annual Premium Tax Credit for Current Marketplace Enrollees under the Affordable Care Act (ACA) and the American Health Care Act 3-year, 5-year, and 10-year projections | |||
| Year | Affordable Care Act | American Health Care Act | Change from ACA |
| 2020 (3 years) | $4,615 | $2,957 | -36% |
| 2022 (5 years) | $5,342 | $3,160 | -41% |
| 2027 (10 years) | $6,648 | $3,729 | -44% |
| Source: Kaiser Family Foundation analysis of data from Healthcare.gov, state-based exchanges, and Congressional Budget Office. Note: Amounts above represent the average tax credit received based on the age distribution of current Marketplace enrollees. | |||
The average estimated tax credit received by ACA marketplace enrollees in 2017 is $3,617 on an annual basis, and that this amount will rise to $4,615 by 2020 based on projected growth rates from the Congressional Budget Office. This includes the 81% who receive premium subsidies as well as the 19% who do not.
We estimate – based on the age distribution of marketplace enrollees – that current enrollees would receive an average tax credit under the American Health Care Act of $2,957 in 2020, or 36% less than under the ACA (see Table 3 and Figure 3). While many people would receive lower tax credits under the Affordable Health Care Act, some would receive more assistance, notably the 19% of current marketplace enrollees who do not qualify for ACA subsidies.
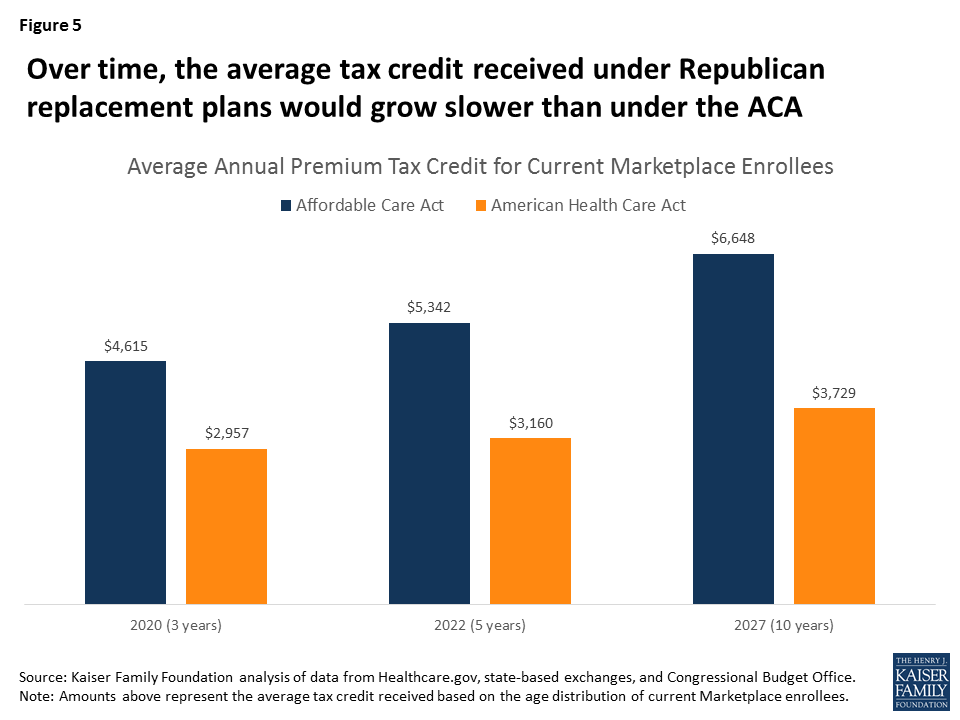
Figure 5: Over time, the average tax credit received under Republican replacement plans would grow slower than under the ACA
While ACA tax credits grow as premiums increase over time, the tax credits in the American Health Care Act are indexed to inflation plus 1 percentage point. Based on CBO’s projections of ACA tax credit increases and inflation, the disparity between the average credits under the ACA and the two replacement plans would widen over time. The average tax credit current marketplace enrollees would receive under the American Health Care Act would be 41% lower than under the ACA in 2022 and 44% lower in 2027.
Discussion
Like the ACA itself, the American Health Care Act includes refundable tax credits to help make premiums more affordable for people buying their own insurance. This might seem like an area where a replacement plan could preserve a key element of the ACA. However, the tax credits are, in fact, structured quite differently, with important implications for affordability and which groups may be winners or losers if the ACA is repealed and replaced.
For current marketplace enrollees, the American Health Care Act would provide substantially lower tax credits overall than the ACA on average. People who are lower income, older, or live in high premium areas would be particularly disadvantaged under the American Health Care Act. People with incomes over 400% of the poverty level – including those buying individual market insurance outside of the marketplaces – do not get any financial assistance under the ACA but many would receive tax credits under the replacement proposal.
The underlying details of health reform proposals, such as the size and structure of health insurance tax credits, matter crucially in determining who benefits and who is disadvantaged