Kaiser Health Tracking Poll: January 2016
Findings
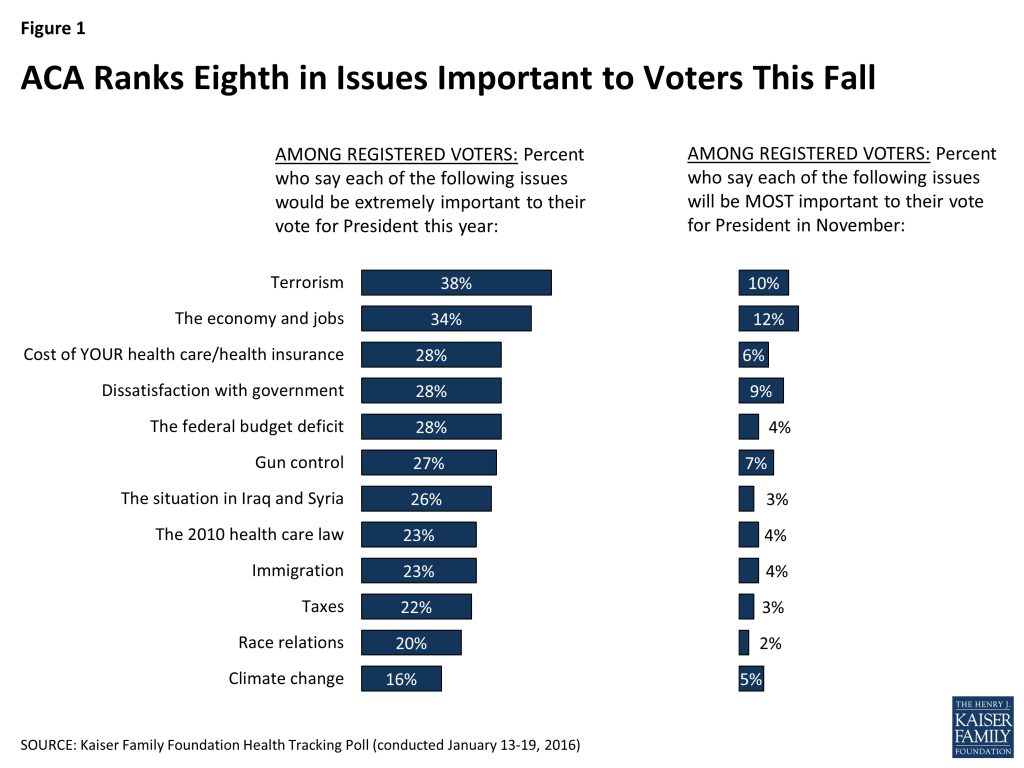
Despite the ongoing debate between Republican lawmakers and President Obama on the future of the 2010 health care law, the January Kaiser Health Tracking Poll finds the Affordable Care Act (ACA) is only one of many issues that may impact voting decisions, with nearly a quarter (23 percent) saying it’s extremely important, but only four percent choosing it as the MOST important issue. Across all issues included in the poll, terrorism and the economy/jobs are the top two issues for voters at this point in the election. Across parties, the ACA does not rank higher than fourth in what voters say will be most important.
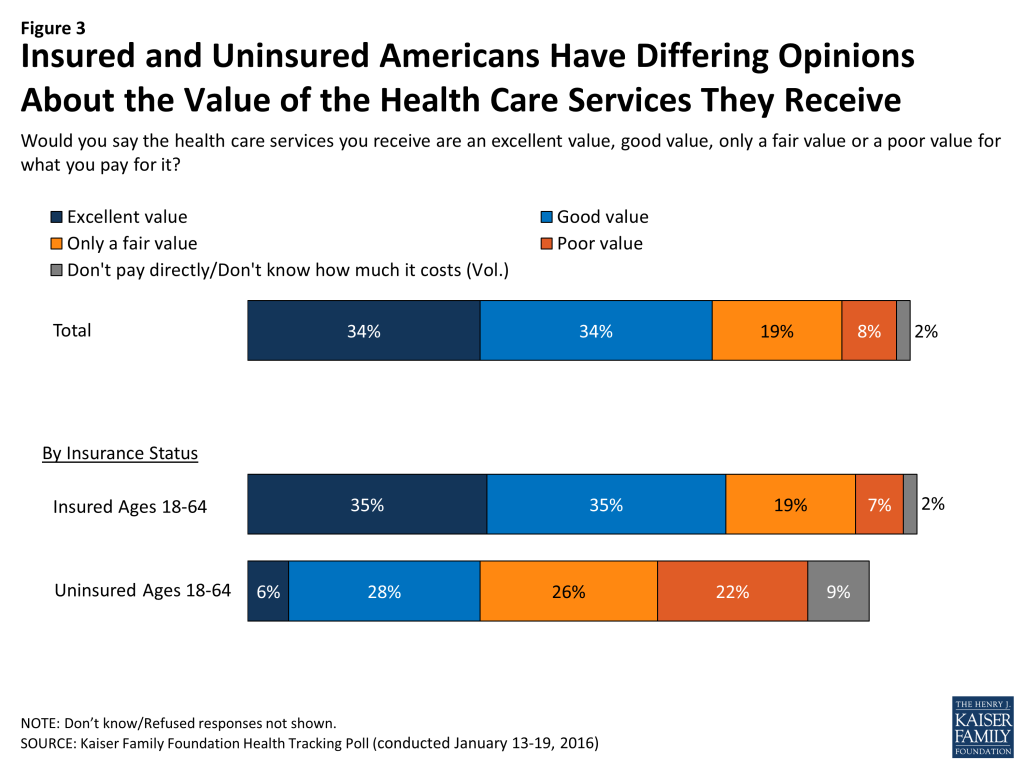
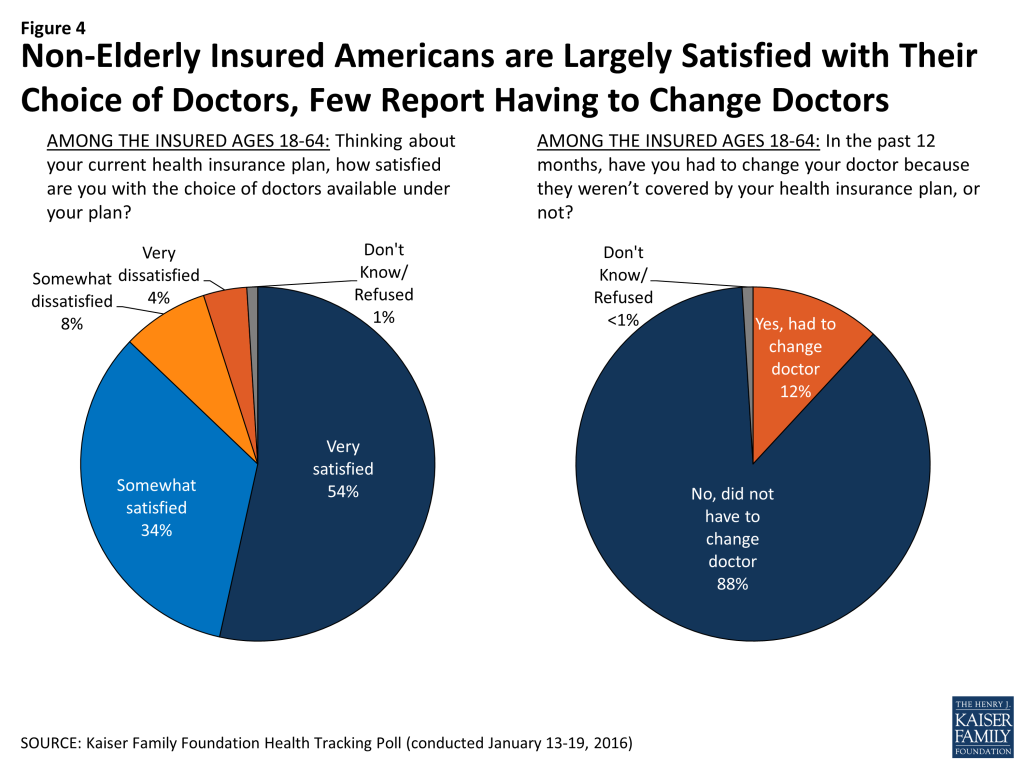
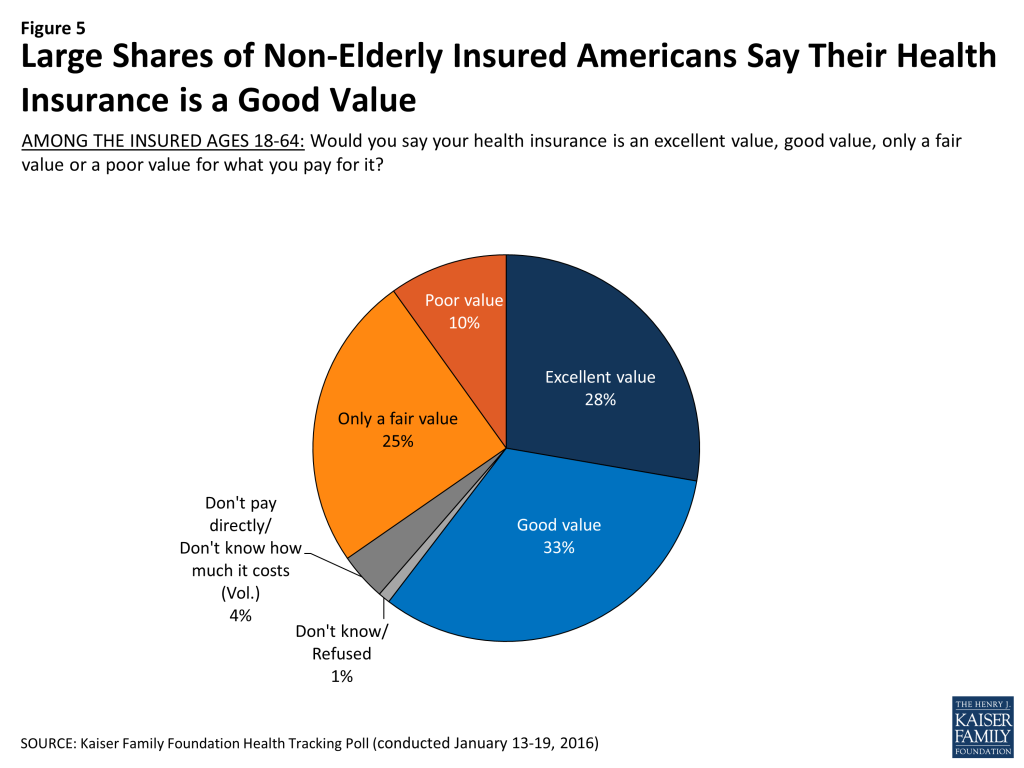
While there has been recent focus on improving the value of health care, those with insurance under 65 years old largely say the health care services they receive are at least a good value for what they pay for them (71 percent). In addition, despite recent attention in the media and among policymakers to narrow networks and limited provider choice, a large majority (87 percent) of the non-elderly with coverage are also satisfied with the choice of doctors available under their plan, and just 12 percent say they have had to change doctors in the past year because their doctor wasn’t covered by their health plan. Overall, most non-elderly Americans with insurance (74 percent) say that health insurance is worth the money it costs, and six in ten (61 percent) say their plan is an “excellent” or “good” value for what they pay for it.
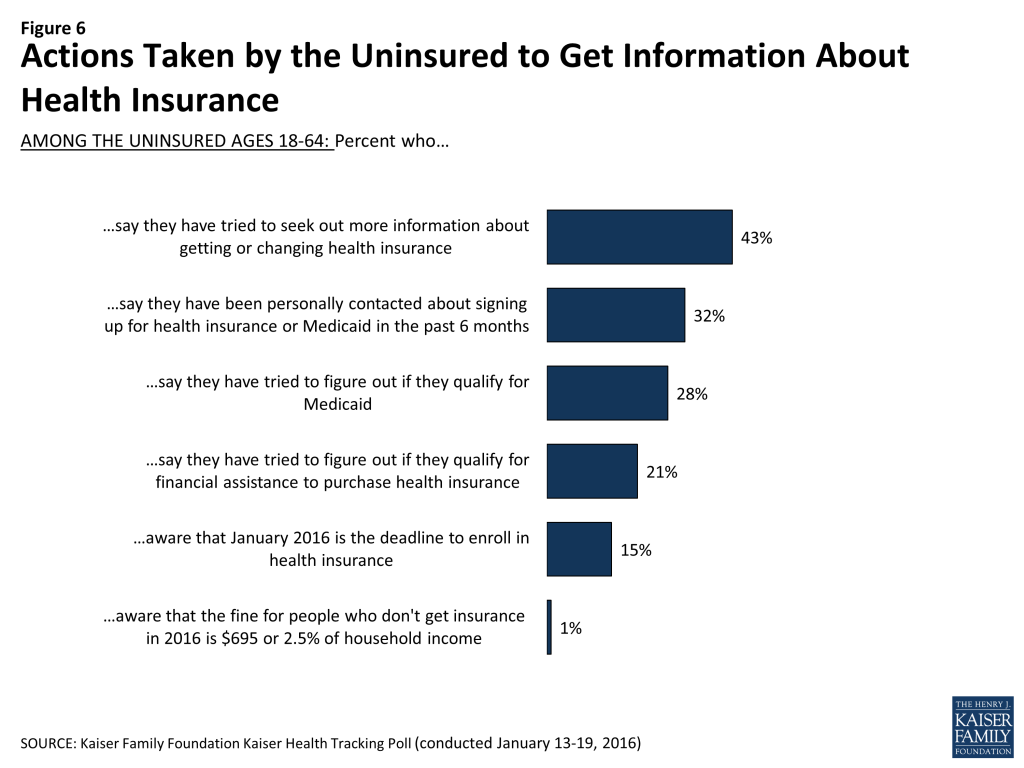
In the final days of the 2016 open enrollment period, many uninsured are largely disengaged from the health care system and opportunities for coverage, with large majorities being unaware of the date for the upcoming deadline to enroll or of the fine for not having health insurance in 2016. While nearly half of the uninsured say they have been without coverage for two years or more, about 3 in 10 (28 percent) say that in the past six months they have tried to figure out if they qualify for Medicaid and 21 percent say they have tried to figure out if they qualify for financial assistance to purchase health insurance.
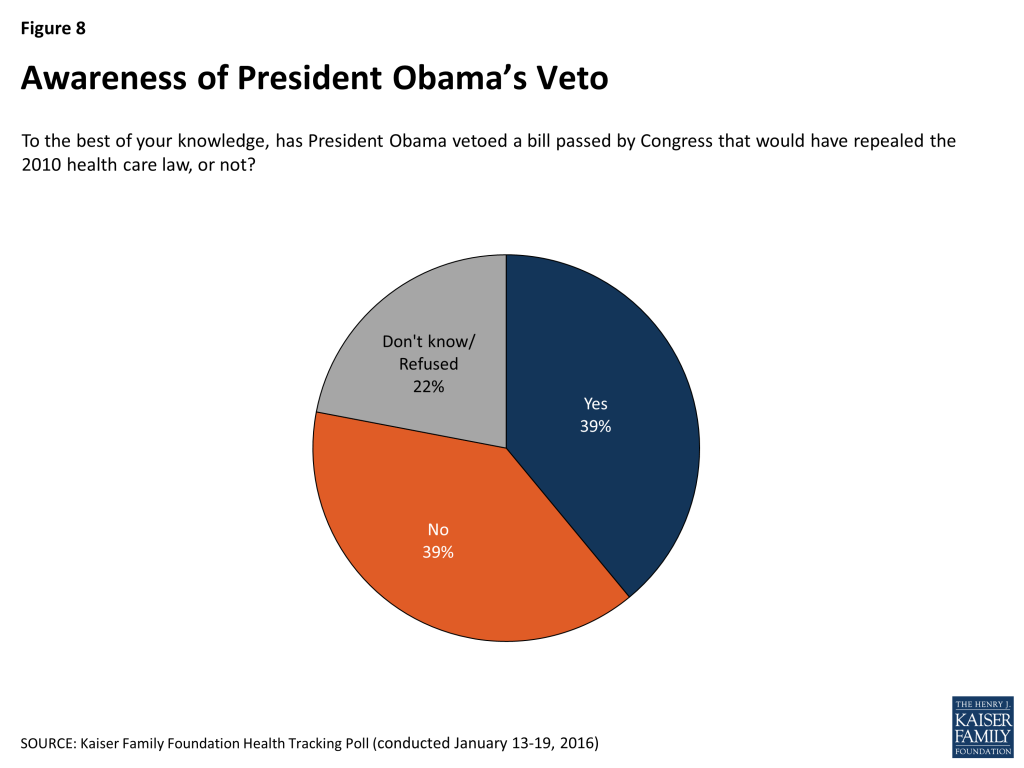
For the first time, Republicans in Congress sent a bill repealing the Affordable Care Act to President Obama’s desk that was subsequently vetoed in early 2016. While half of Americans say they followed news on this legislation closely, equal shares of Americans (39 percent) are aware of President Obama’s veto as are unaware of it. Additionally, public opinion of the health care law did not change significantly this month, with 44 percent of the public reporting an unfavorable view of the law and 41 percent reporting a favorable view.
Election Watch: The Role of Health Care Issues in 2016 U.S. Presidential Election
Despite the ongoing debate between Republican lawmakers and President Obama on the future of the 2010 health care law, the ACA is only one of many issues that may impact voting decisions, with nearly a quarter (23 percent) saying it’s extremely important, but only four percent choosing it as the MOST important issue. Across all issues included in the poll, terrorism (38 percent) and the economy/jobs (34 percent) are the top two issues for voters at this point in the election. In addition, about 3 in 10 voters (28 percent) say the personal cost of health care and health insurance is extremely important and six percent say it is MOST important, which is similar to the shares of voters who say the same about a number of other issues. Across parties, neither the ACA nor the cost of their health care rank higher than fourth in what voters say will be most important.
Partisan Differences on the Role of Health Care Issues in Presidential Vote Choice
When asked specifically about how some health care issues may impact their vote for president, at this point in the campaign, there’s not a single health care issue that voters coalesce around with more than 4 in 10 saying a number of different health care issues may be important to their vote. Topping the list with roughly 6 in 10 voters saying the issue may be at least very important is the cost of health care, health insurance, and prescription drugs (64 percent), Medicare (61 percent), and the future of the 2010 health care law (57 percent). About half say the same about Medicaid (55 percent), creating a Medicare-for-all single payer plan (54 percent), an idea Senator Sanders has called for on the Democratic primary campaign trail, and providing health coverage for the uninsured (49 percent). Just under half say reproductive health care services (47 percent) and abortion (45 percent) may be at least very important. However, less than 1 in 10 say any of these health care issues will be the single most important factor in their vote.
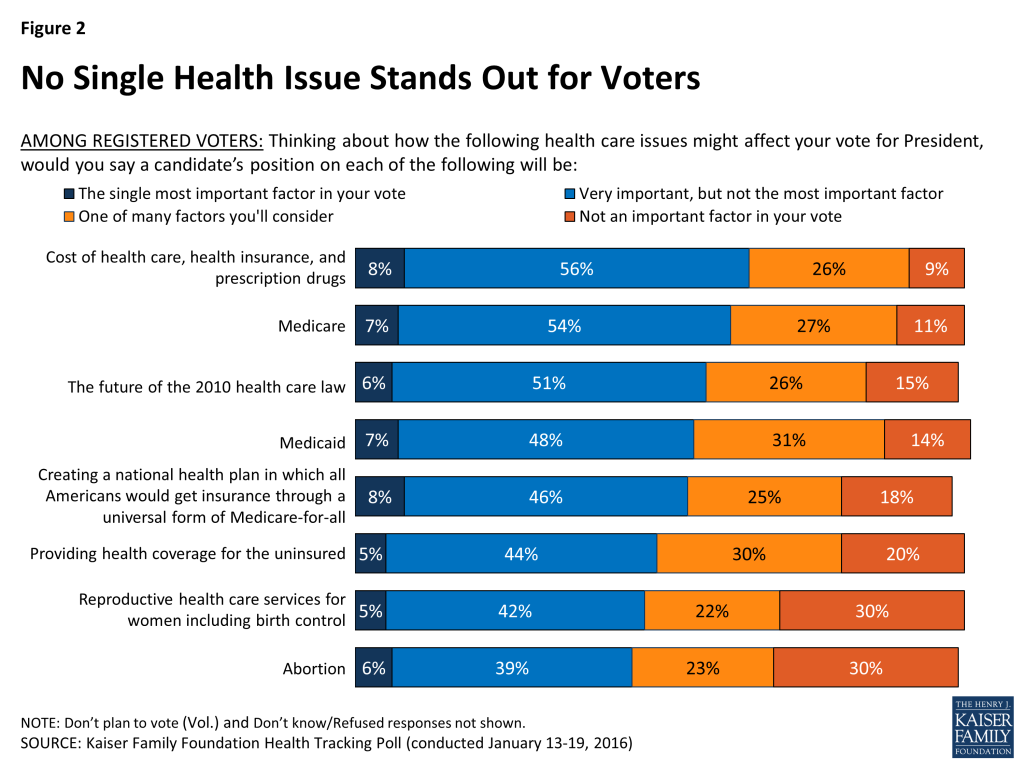
These health care issues resonate most with Democrats with more Democratic voters saying it may be important than Republican voters and independent voters. The issues with the biggest partisan divide between Democrats and Republicans are reproductive health care services (63 percent vs. 26 percent), Medicaid (69 percent vs. 38 percent), and providing health coverage for the uninsured (65 percent vs. 34 percent).
| Table 1: Importance of a Candidate’s Position on Health Issues in Voters’ Picks for President | ||||
| Percent who say a candidate’s position on the following health care issues will be “the single most important factor” or “a very important factor” in their vote for president: | All Registered Voters | Democratic Registered Voters | Independent Registered Voters | Republican Registered Voters |
| The cost of health care, health insurance, and prescription drugs | 64% | 74% | 63% | 54% |
| Medicare, the government health program for people 65 and older | 61 | 72 | 54 | 57 |
| The future of the 2010 health care law | 58 | 68 | 51 | 57 |
| Creating a national health plan in which all Americans would get their insurance through an expanded, universal form of Medicare-for-all | 55 | 68 | 52 | 42 |
| Medicaid, the government health insurance and long term care program for certain low-income adults and children | 54 | 69 | 52 | 38 |
| Providing health coverage for the uninsured | 49 | 65 | 48 | 34 |
| Reproductive health care services for women including birth control | 47 | 63 | 47 | 26 |
| Abortion | 45 | 53 | 41 | 44 |
Perceptions of the Value of Health Insurance and Services
Although the cost of health care is a common concern for the public and health policymakers have recently focused on improving the value of services, those with insurance say they are largely content with the value of the health care services they receive. About 7 in 10 (71 percent) of those with insurance under 65 years old say the health care services they receive are an “excellent” or “good” value for what they pay for them. The uninsured, however, tell a different story; a third (34 percent) of the uninsured say the services they receive are an “excellent” or “good” value compared to nearly half (48 percent) who say they are “only a fair” or “poor” value for what they pay for them.
Recent media and political discussions have touched on concerns about narrow networks and limited provider choice. However, those with insurance are largely satisfied with the choice of doctors available under their plan. Nearly 9 in 10 (87 percent) of the non-elderly insured say they are “very” or “somewhat” satisfied, while just 12 percent say they are “very” or “somewhat” dissatisfied. Just 12 percent of the non-elderly insured say they have had to change doctors in the past 12 months because their doctor wasn’t covered by their health insurance plan, including 5 percent who say the change was a big problem for them, 5 percent who say it was a small problem and 1 percent who say it was not a problem.
When asked about the value of health insurance coverage generally, 7 in 10 Americans (70 percent) say health insurance is worth the money it costs, while about 3 in 10 (27 percent) say it is not. This opinion varies starkly by insurance status however, with about three-quarters of the non-elderly insured (74 percent) saying health insurance is worth the cost and fewer than half of the uninsured (45 percent) saying the same. Additionally, those with insurance also give their personal health insurance positive value ratings. Six in 10 non-elderly insured (61 percent) say their health insurance is an “excellent” or “good” value for what they pay for it, while about a third (35 percent) say their health insurance is “only a fair” or “poor” value. For additional data on the public’s worries and challenges related to health care, see the Topline and Methodology.
The Uninsured in the Last Month of 2016 Open Enrollment
Knowledge of Enrollment Deadline and Fine For Not Having Insurance
As the Affordable Care Act’s third open enrollment period comes to a close at the end of this month, most of the uninsured are disengaged from the ongoing enrollment process. Just 15 percent of the uninsured can correctly say when the deadline to enroll is. The majority (57 percent) of the uninsured say they don’t know the deadline and small shares incorrectly believe the deadline is some other time in 2016 (16 percent) or that it has already passed (12 percent). Additionally, only 1 percent correctly name the 2016 fine amount of $695 per person or 2.5% of household income.
Although they largely do not know the fine amount, nearly half (47 percent) of the uninsured anticipate that they will have to pay a fine for not having health insurance in 2015. An identical share (47 percent) say that they do not think they will have to pay a fine and the remaining 6 percent say they don’t know. Some uninsured may in fact be exempt from the fine because of hardship exemptions available under the law.
In terms of enrollment engagement and efforts to get coverage, most of the uninsured say they have not been contacted about signing up for coverage (67 percent) or that they have not tried to get more information on their own (57 percent). More specifically, most uninsured say they have not taken steps to figure out if they are eligible for the two main coverage expansions under the ACA — Medicaid and financial assistance to purchase health insurance through the healthcare marketplaces. Over 7 in 10 saying they have not tried to figure out if they qualify for Medicaid (72 percent) or for financial assistance to purchase health insurance (79 percent) in the past 6 months. On the other hand, about 3 in 10 (28 percent) uninsured say they have in fact tried to figure out if they qualify for Medicaid and 21 percent say they have tried to figure out if they qualify for financial assistance, but they remain without coverage.
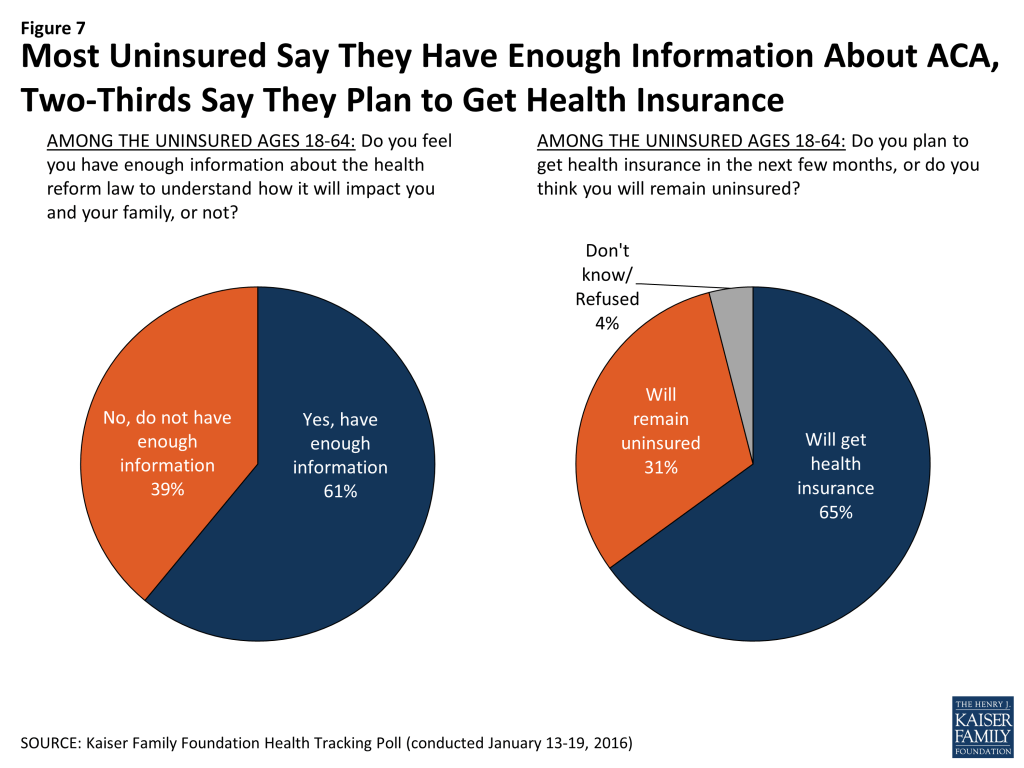
Despite many uninsured reporting that they have not been contacted or actively searched for information themselves, most (61 percent) of the uninsured say they feel like they have enough information about the health care law to understand how it will impact them. In addition, nearly two-thirds (65 percent) say they plan to get health insurance in the next few months, despite the fact that nearly half (46 percent) of the uninsured say they have been without coverage for two years or more.
Views of the ACA
The ACA has been the topic of much political and media attention in the past couple of months with both the Senate and the House successfully passing legislation repealing the law and President Obama subsequently vetoing the legislation.1 The January Kaiser Health Tracking poll finds that an equal share of Americans (39 percent) are aware of President Obama’s veto as are unaware of it, while 2 in 10 are not sure. These shares are similar for Democrats, Republicans, and independents. Those who say they followed news coverage of the repeal bill “very” or “fairly” closely are more likely than those who say they were not following coverage closely to be aware that the President vetoed the legislation (49 percent vs. 29 percent).
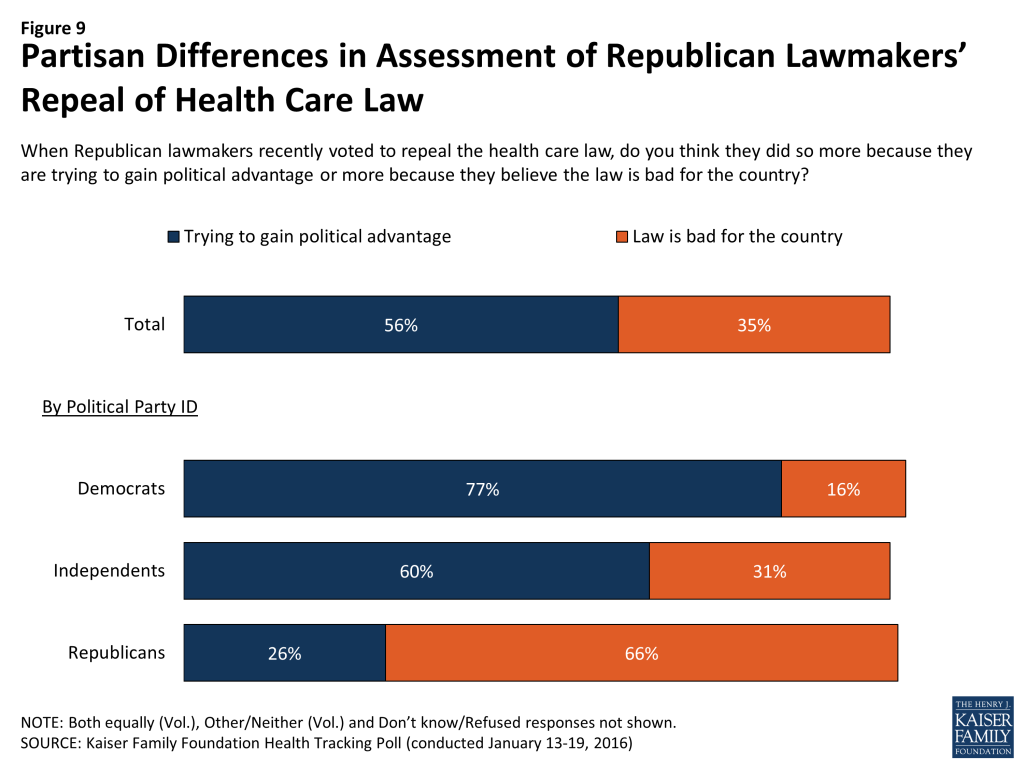
While most Americans are either unaware of President Obama’s veto or not sure, the majority of the public (56 percent) say Republican lawmakers repealed the health care law because they are trying to gain political advantage rather than because they believe the law is bad for the country (35 percent). Majorities of Democrats (77 percent) and independents (60 percent) say that Republicans lawmakers were trying to gain political advantage by voting to repeal the ACA, while two-thirds of Republicans (66 percent) say that lawmakers’ recent repeal is because they believe the law is bad for the country.
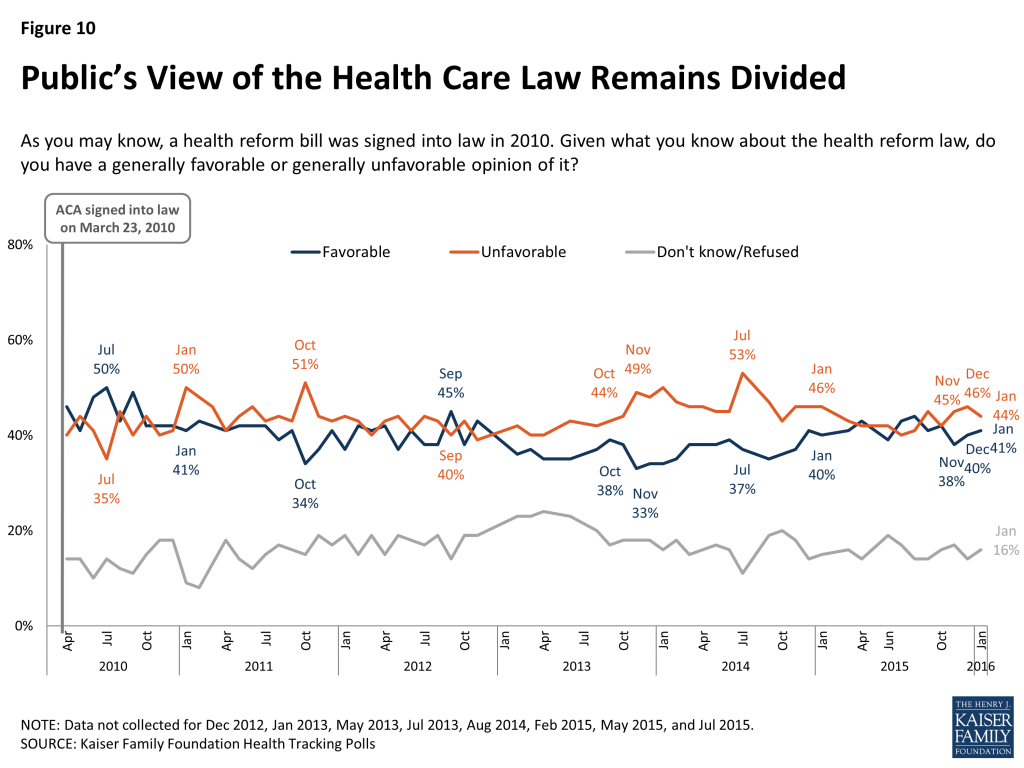
Public opinion of the health care law did not change significantly this month with 44 percent of the public reporting an unfavorable view of the law and 41 percent reporting a favorable view. As in previous tracking polls, there are significant partisan differences with 65 percent of Democrats reporting a favorable view while three-fourths of Republicans (75 percent) view the law unfavorably. Independents are somewhat more likely to hold unfavorable views of the law than favorable ones (48 percent vs. 37 percent).
Kaiser Health Policy News Index: January 2016
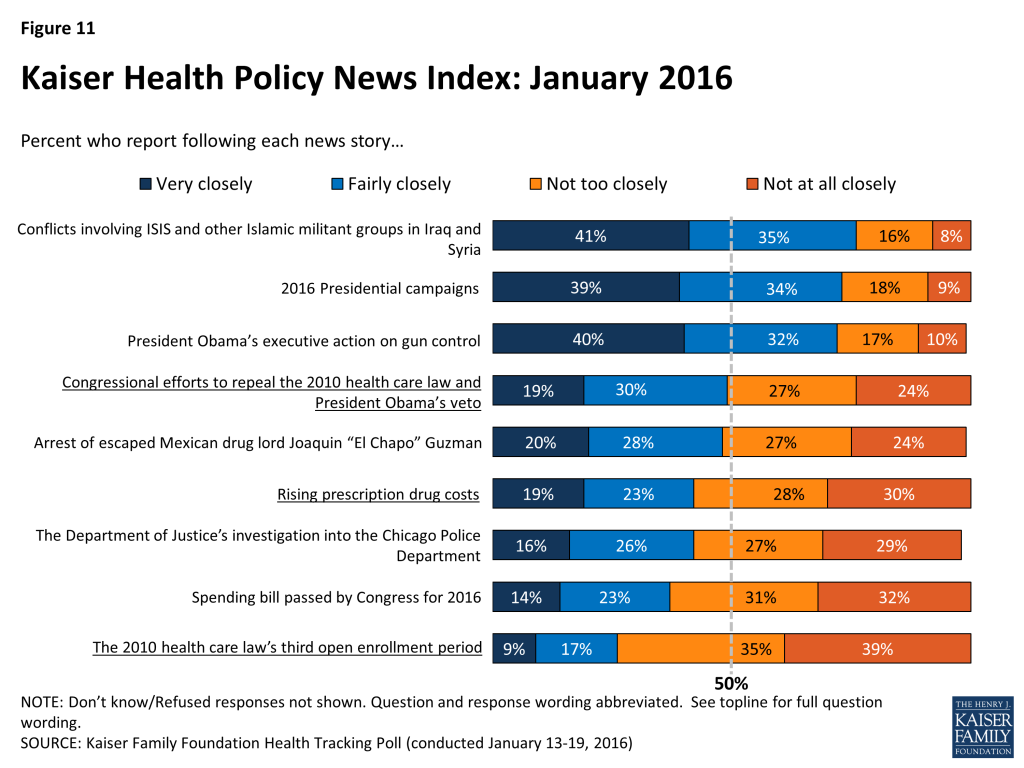
As is often the case, the percentage of Americans who report following the month’s top health policy stories is considerably less than those who report closely following other national and international news coverage. The most closely followed stories in this month’s Index were conflicts involving ISIS and other Islamic militant groups in Iraq and Syria (76 percent), the 2016 presidential campaign (73 percent), and President Obama’s executive action on gun control (72 percent). The most closely followed health policy news story, with nearly half of Americans (48 percent) reporting they followed the story either ‘very closely’ (19 percent) or ‘fairly closely’ (30 percent), was the Congressional legislation repealing the 2010 health care law and subsequent presidential veto. This is about the same as the share saying they closely followed coverage of the arrest of the Mexican drug lord Joaquin “El Chapo” Guzman (48 percent). In addition, about 4 in 10 Americans (42 percent) report closely following stories about rising prescription drug costs; roughly similar to the shares who report following the Department of Justice’s investigation into the Chicago Police Department (43 percent) and the 2016 spending bill passed by Congress (37 percent). A much smaller share of the public (26 percent) report closely following the 2010 health care law’s third open enrollment period.
Methodology
This Kaiser Health Tracking Poll was designed and analyzed by public opinion researchers at the Kaiser Family Foundation (KFF). The survey was conducted January 13-19, 2016, among a nationally representative random digit dial telephone sample of 1,204 adults ages 18 and older, living in the United States, including Alaska and Hawaii (note: persons without a telephone could not be included in the random selection process). Computer-assisted telephone interviews conducted by landline (481) and cell phone (723, including 416 who had no landline telephone) were carried out in English and Spanish by Princeton Data Source under the direction of Princeton Survey Research Associates International (PSRAI). Both the random digit dial landline and cell phone samples were provided by Survey Sampling International, LLC. For the landline sample, respondents were selected by asking for the youngest adult male or female currently at home based on a random rotation. If no one of that gender was available, interviewers asked to speak with the youngest adult of the opposite gender. For the cell phone sample, interviews were conducted with the adult who answered the phone. KFF paid for all costs associated with the survey.
The combined landline and cell phone sample was weighted to balance the sample demographics to match estimates for the national population using data from the Census Bureau’s 2014 American Community Survey (ACS) on sex, age, education, race, Hispanic origin, nativity (for Hispanics only), and region along with data from the 2010 Census on population density. The sample was also weighted to match current patterns of telephone use using data from the January-June 2015 National Health Interview Survey. The weight takes into account the fact that respondents with both a landline and cell phone have a higher probability of selection in the combined sample and also adjusts for the household size for the landline sample. All statistical tests of significance account for the effect of weighting.
The margin of sampling error including the design effect for the full sample is plus or minus 3 percentage points. Numbers of respondents and margins of sampling error for key subgroups are shown in the table below. For results based on other subgroups, the margin of sampling error may be higher. Sample sizes and margins of sampling error for other subgroups are available by request. Note that sampling error is only one of many potential sources of error in this or any other public opinion poll. Kaiser Family Foundation public opinion and survey research is a charter member of the Transparency Initiative of the American Association for Public Opinion Research.
| Group | N (unweighted) | M.O.S.E. |
| Total | 1204 | ±3 percentage points |
| Party Identification | ||
| Democrats | 382 | ±6 percentage points |
| Republicans | 320 | ±6 percentage points |
| Independents | 399 | ±6 percentage points |
| Registered Voters | ||
| Total RV | 1007 | ±4 percentage points |
| Democrat RV | 325 | ±6 percentage points |
| Republican RV | 283 | ±7 percentage points |
| Independent RV | 333 | ±6 percentage points |
| Insurance Status | ||
| Insured, ages 18-64 | 774 | ±4 percentage points |
| Uninsured, ages 18-64 | 103 | ±10 percentage points |
Endnotes
- The U.S. Senate passed the legislation on December 3, 2015 and the House passed the legislation on January 6, 2016. President Obama vetoed the legislation on January 8, 2016. ↩︎