Kaiser Health Tracking Poll: December 2015
Kaiser Health Tracking Poll: December 2015 Findings
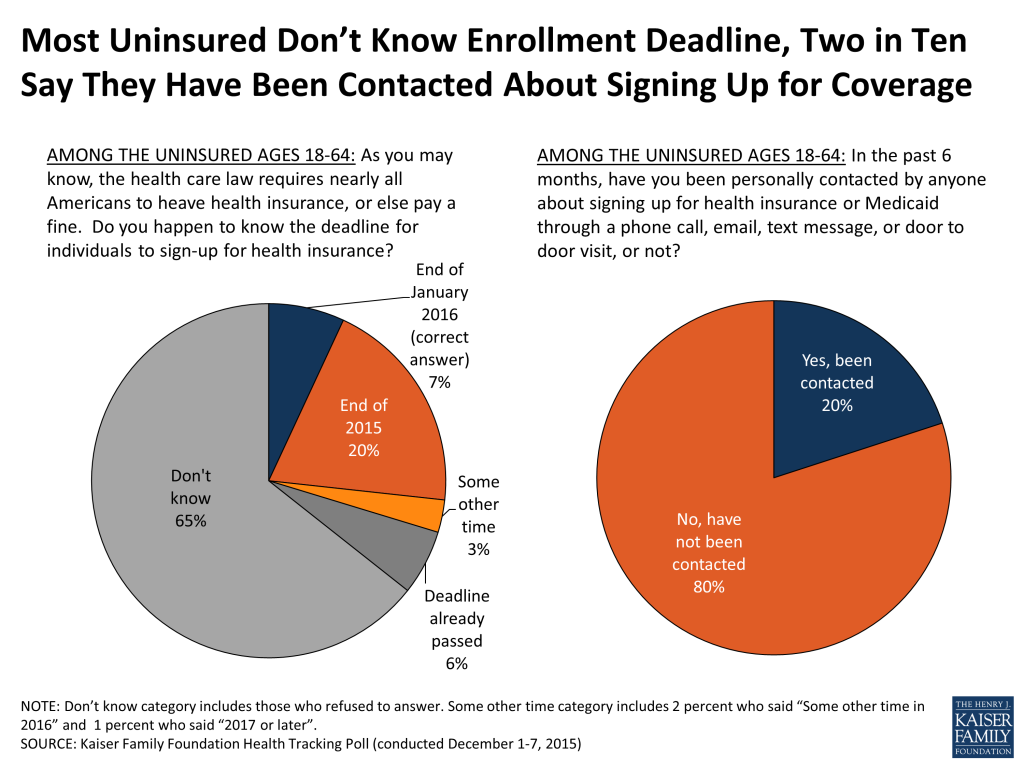
The ACA’s third open enrollment will come to a close at the end of January and the December Kaiser Health Tracking Poll finds that, at this point, only 7 percent of the uninsured correctly identify this as the deadline to enroll in coverage and 20 percent say they have been contacted by someone about signing up for coverage. When asked why they have not personally obtained health insurance this year, nearly half of the uninsured (46 percent) say they have tried to get coverage but that it was too expensive. However, slightly over half of the uninsured (55 percent) say they plan to get health insurance in the next few months.
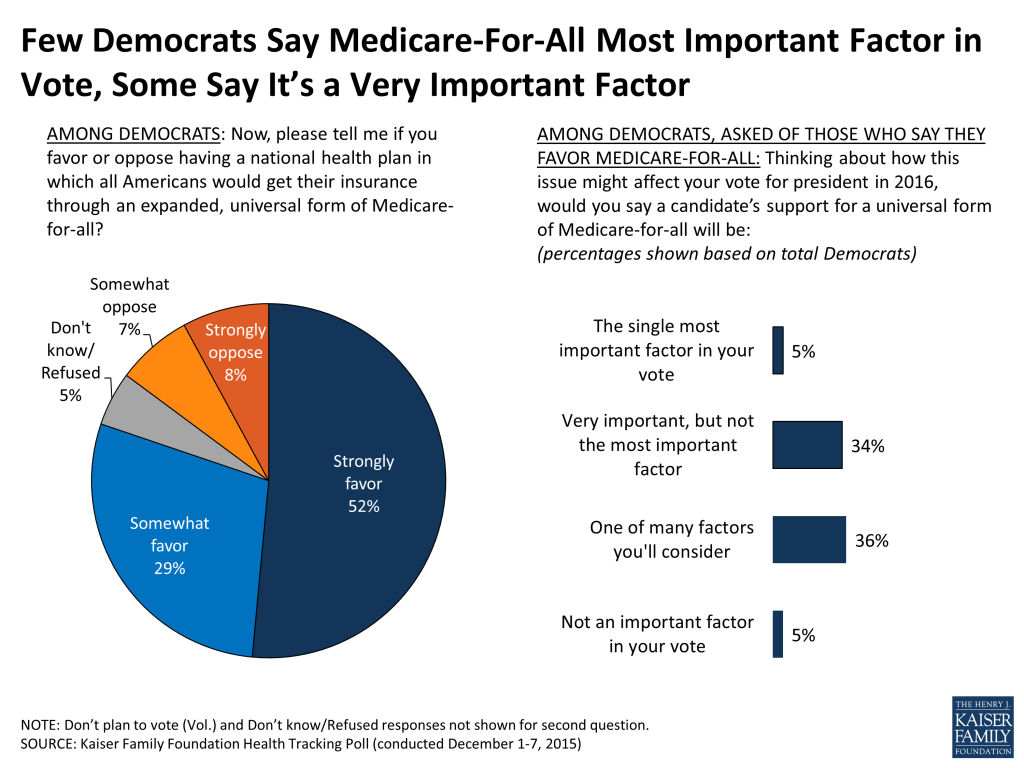
The race for the Democratic presidential nomination has recently included debate about creating a national health plan in which all Americans would get their insurance through an expanded form of Medicare generally called Medicare-for-all. Majorities of Democrats (81 percent) and independents (60 percent) favor the idea of Medicare-for-all compared to 63 percent of Republicans who oppose it. Few Democrats see the issue as a major factor in their vote at this point. Just 5 percent of Democrats say they favor the idea of Medicare-for-all and a candidate’s support for it will be the single most important factor in their vote. However, a third of Democrats (34 percent) say they favor it and it will be very important, but not the most important factor in their vote, 36 percent say it will be one of many factors they will consider and five percent say it will not matter at all. The poll did not present details or arguments for and against Medicare-for-all and future polls may examine support and opposition in greater depth.
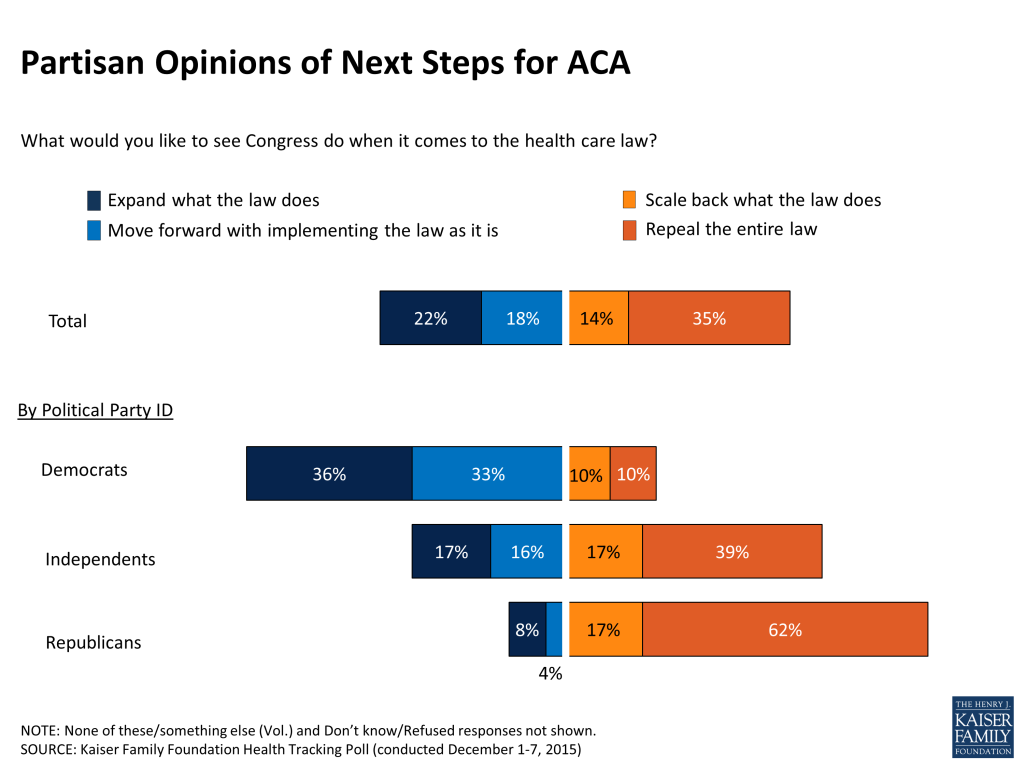
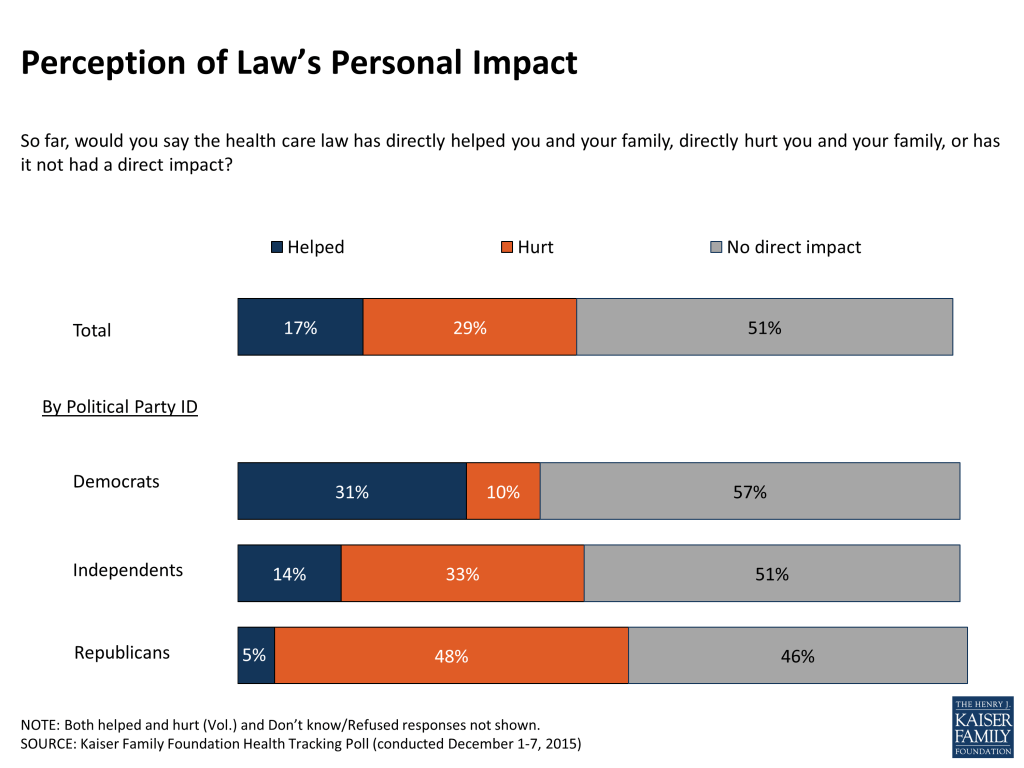
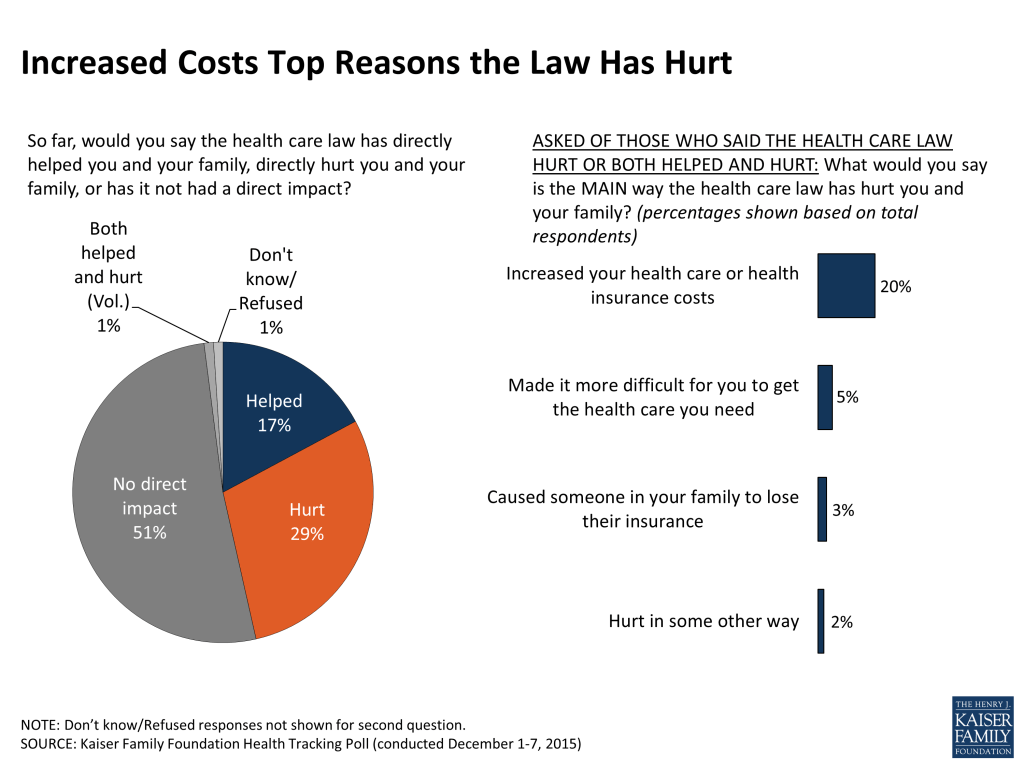
As the U.S. Senate voted to repeal the Affordable Care Act (ACA) earlier this month, more of the public views the health care law unfavorably than favorably (46 percent vs. 40 percent). In addition, the public remains divided over what Congress should do next with the law, with 35 percent supporting repeal, 14 percent supporting scaling back the law, 18 percent who say they would like to see it implemented as is, and 22 percent who say they want the law expanded. While half of the public (51 percent) says they have not been directly impacted by the law, more say they have been hurt by the law than say they have been helped (29 percent vs. 17 percent). These perceptions of the law and its personal impacts vary starkly by political party identification as they have since the law’s inception.
The Uninsured and Open Enrollment
There is about a month and half left of the Affordable Care Act’s third open enrollment period and at this point, 7 percent of the uninsured are aware the deadline to enroll is at the end of January. Another 20 percent say the deadline is at the end of the year, while nearly two-thirds (65 percent) say they don’t know, 6 percent say the deadline has already passed, and 3 percent give another date.
Some uninsured report being the recipient of outreach efforts, with 2 in 10 (20 percent) saying they have been contacted by someone about signing up for health insurance in the past 6 months.
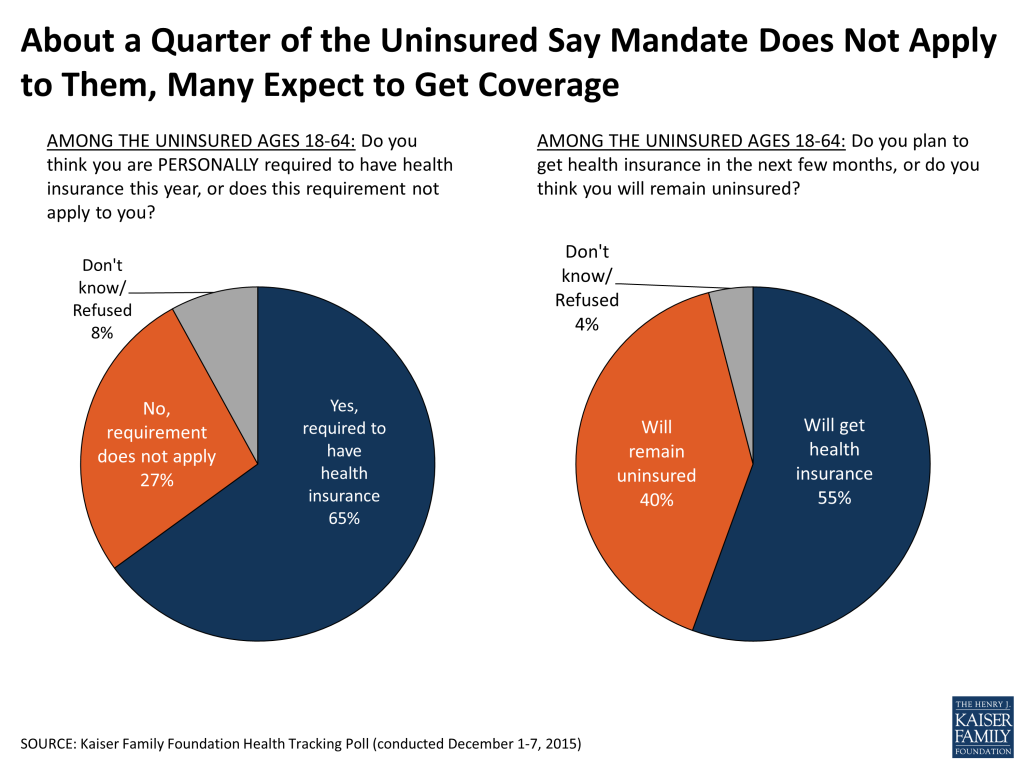
The majority (65 percent) of the uninsured think they are personally required to have health insurance, though about a quarter (27 percent) say they don’t think the requirement applies to them personally. Some of the uninsured may in fact be exempt from the fine because of hardship exemptions available under the law.
Over half of the uninsured (55 percent) say they plan to get health insurance in the next few months while 4 in 10 of the uninsured (40 percent) expect to remain uninsured. Some of the uninsured may in fact be in the midst of a brief period of uninsurance, however over half (55 percent) report that they have been uninsured for two years or more.
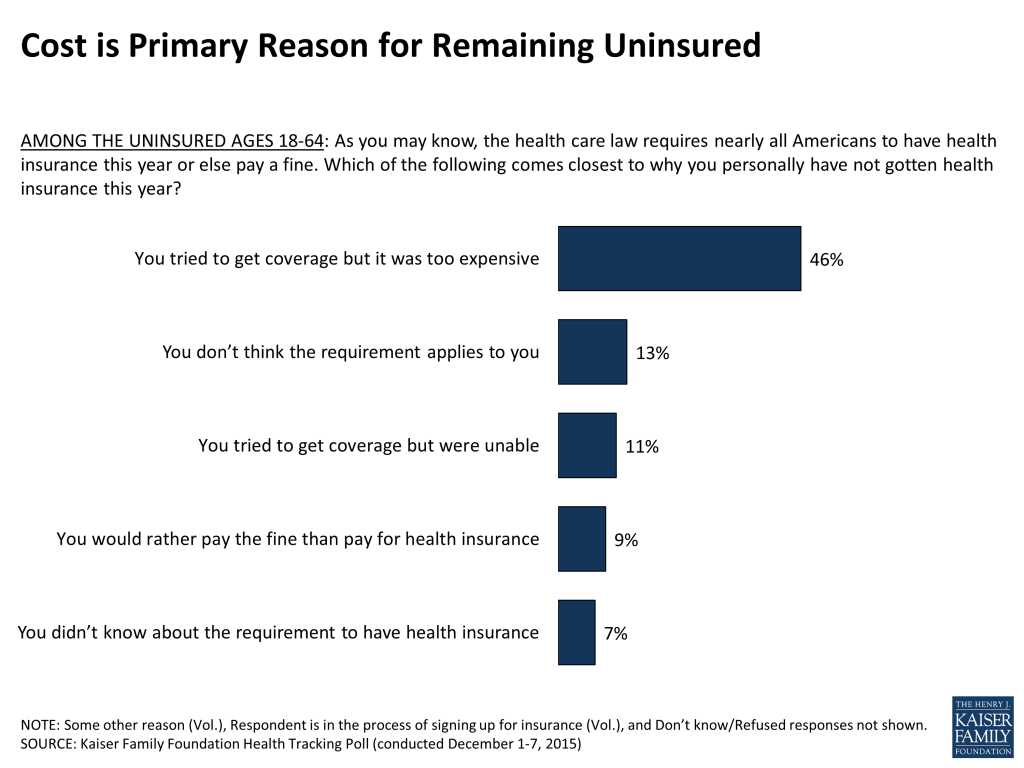
When asked why they have not purchased health insurance this year, nearly half of the uninsured (46 percent) say they have tried to get coverage but that it was too expensive. Others say they don’t think the requirement applies to them (13 percent), that they tried to get coverage but were unable (11 percent), that they’d rather pay the fine than pay for coverage (9 percent) and that they didn’t know about the requirement to have health insurance (7 percent).
Opinions of a Medicare-For-All Idea
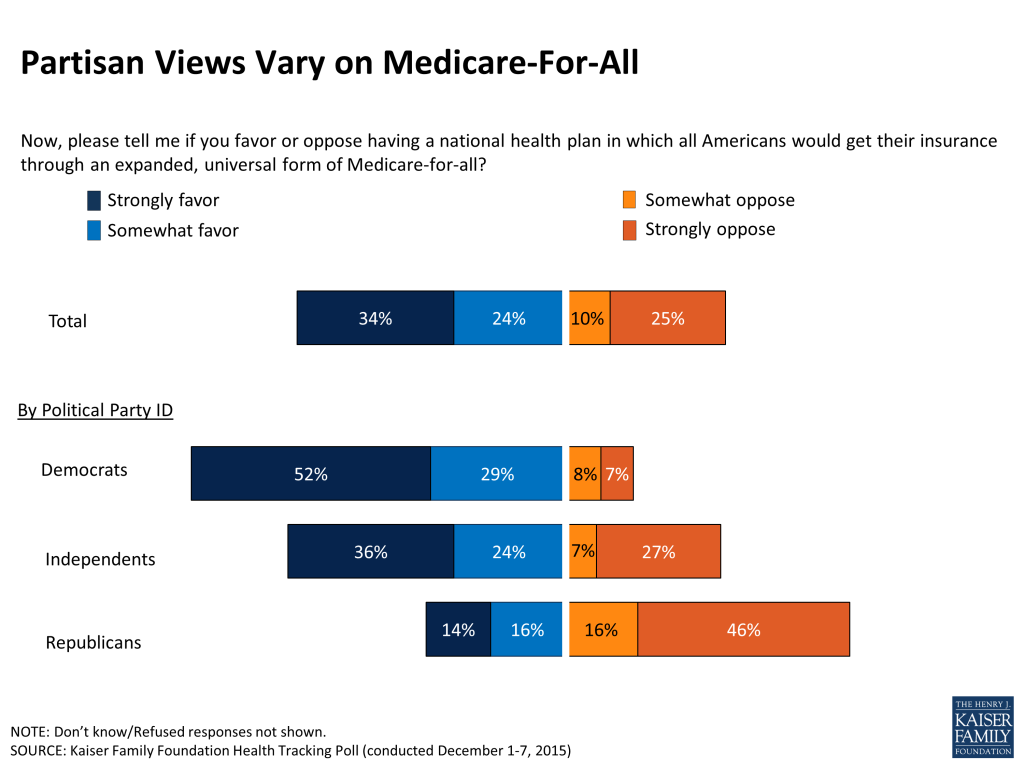
As the presidential primaries inch closer and candidates begin to debate the intricacies of their platforms, a long-discussed health policy option has reemerged in debate between democratic candidates; the idea of creating a national health plan in which all Americans would get their insurance through an expanded, universal form of health insurance called Medicare-for-all. When asked their opinion, nearly 6 in 10 Americans (58 percent) say they favor the idea of Medicare-for-all, including 34 percent who say they strongly favor it. This is compared to 34 percent who say they oppose it, including 25 percent who strongly oppose it. Opinions vary widely by political party identification, with 8 in 10 Democrats (81 percent) and 6 in 10 independents (60 percent) saying they favor the idea, while 63 percent of Republicans say they oppose it.
Medicare-For-All Idea Has Little Influence on Vote Among Democrats
As Democratic presidential primary candidates debate the issue, few Democrats say the issue will be a driving force behind their vote at this point. Looking specifically at Democrats, just 5 percent say they favor Medicare-for-all and that a candidate’s support for it will be the single most important factor in their vote. A third of Democrats (34 percent) say they favor the idea and that it will be very important, but not the most important factor in their vote, 36 percent say it will be one of many factors they will consider, and 5 percent say it will not matter at all.
Views of the ACA
The December Kaiser Health Tracking poll finds that public opinion of the health care law leans negative with 46 percent of the public reporting an unfavorable view of the law and 40 percent reporting a favorable view. The partisan split on the law remains stark. Eight in 10 Republicans (79 percent) say they feel unfavorably toward the law and tw0-thirds of Democrats (67 percent) say the opposite. Independents fall in the middle, but more independents report an unfavorable view of the law than a favorable one (53 percent vs. 32 percent, respectively).

While the Senate voted to repeal the health care law earlier this month,1 the public remains split on what they want Congress to do with the health care law moving forward. The largest share, 35 percent, supports repeal of the law, while 14 percent support scaling back the law, 18 percent would like to see it implemented as is, and 22 percent say they want the law expanded.
Over 6 in 10 Republicans (62 percent) would like to see Congress repeal the health care law, yet they are divided on whether Congress should repeal the law and replace it with a Republican-sponsored alternative (24 percent), or repeal and not replace it (28 percent).
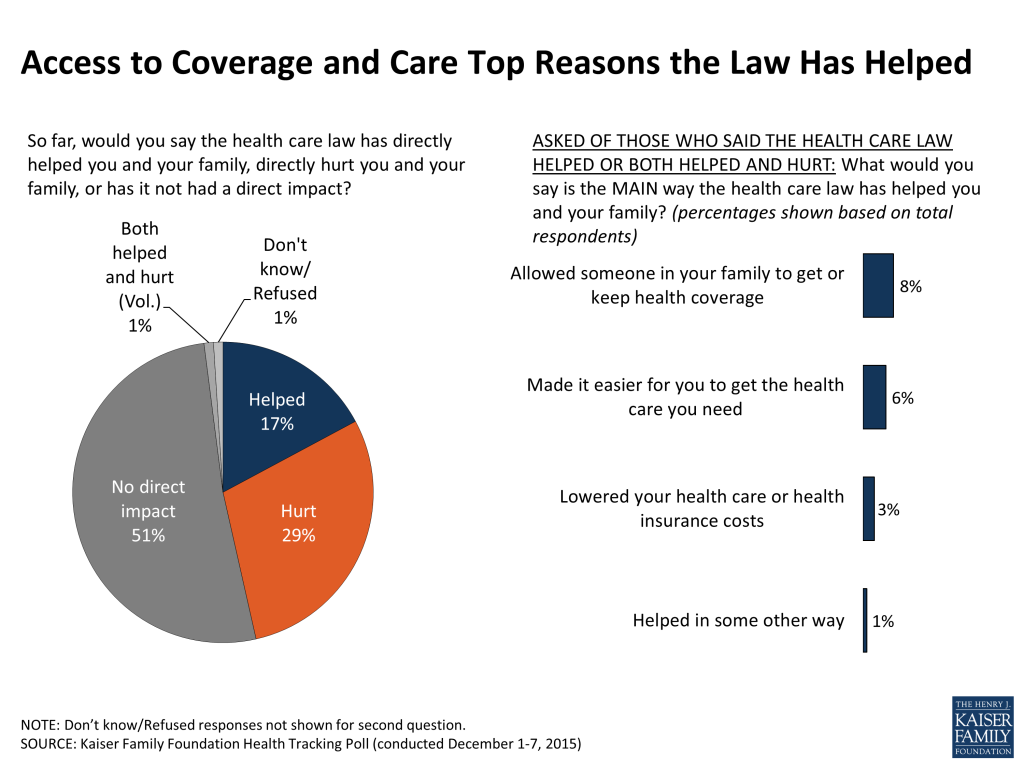
Overall, half of the public (51 percent) says they have not been directly impacted by the health care law, however more say they have been hurt by the law than say they have been helped (29 percent vs. 17 percent). There are partisan differences in how people view the law’s personal impacts. Nearly half of Republicans (48 percent) and a third of independents (33 percent) say they have been hurt by the health care law, while 3 in 10 Democrats (31 percent) say they have been helped.
For those who say the law has helped them, they say it has either allowed someone in their family to get or keep health insurance coverage (8 percent of the public overall), made it easier for them to get the care they need (6 percent), or lowered their health care or health insurance costs (3 percent).
For those who say the health care law has hurt them, most say it has increased their health care or health insurance costs (20 percent of the public overall). Smaller shares feel it has made it more difficult for them to get the health care they need (5 percent) or that it has caused someone in their family to lose health insurance (3 percent).
Kaiser Health Policy News Index: December 2015
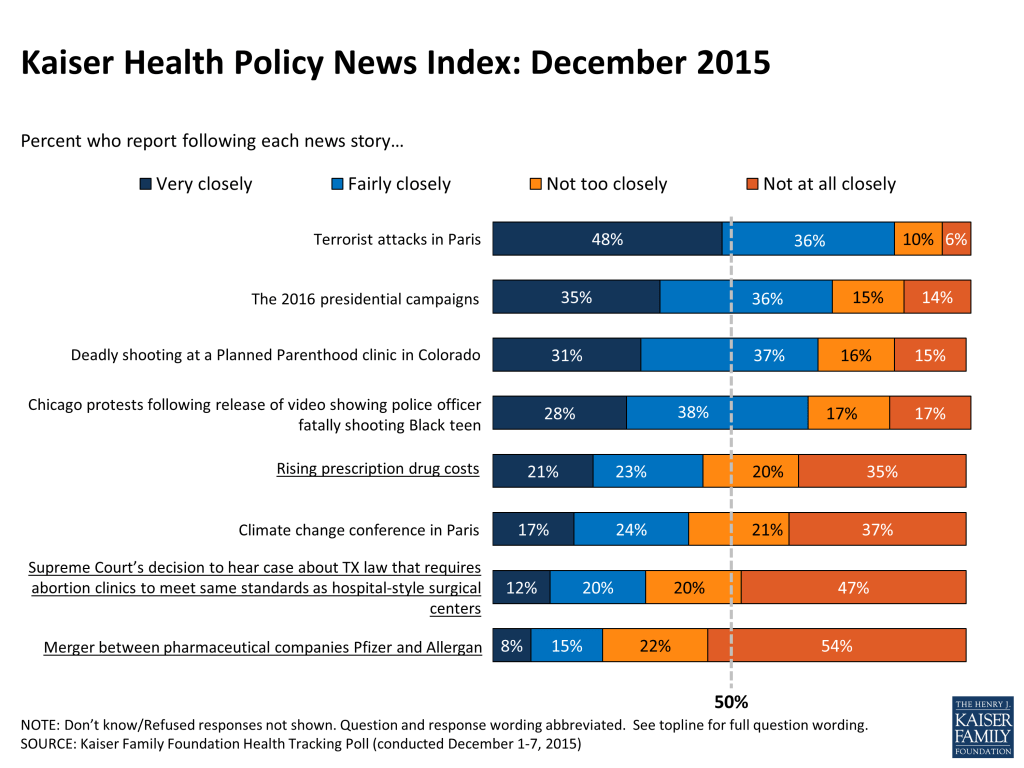
This month, over 4 in 10 of the public (44 percent) report following news about rising prescription drug costs either ‘very’ or ‘fairly’ closely. Other health policy stories were closely followed by smaller shares of the public, such as the Supreme Court’s decision to hear a case about a Texas law requiring abortion clinics to meet the same standards as hospital-style surgical centers (32 percent) and the merger between the pharmaceutical companies Pfizer and Allergan (23 percent). On the other hand, large majorities of the public report closely following news about the terrorist attacks in Paris (84 percent), the 2016 presidential campaigns (71 percent), the deadly shooting at a Planned Parenthood clinic in Colorado the day after Thanksgiving (68 percent) and protests in Chicago following the release of a video showing a police officer fatally shooting a Black teen (66 percent). In addition, 4 in 10 (41 percent) say they closely followed news about the climate change conference in Paris.
Kaiser Health Tracking Poll: December 2015 Methodology
This Kaiser Health Tracking Poll was designed and analyzed by public opinion researchers at the Kaiser Family Foundation (KFF). The survey was conducted December 1-7, 2015, among a nationally representative random digit dial telephone sample of 1,202 adults ages 18 and older, living in the United States, including Alaska and Hawaii (note: persons without a telephone could not be included in the random selection process). Computer-assisted telephone interviews conducted by landline (480) and cell phone (722, including 414 who had no landline telephone) were carried out in English and Spanish by Princeton Data Source under the direction of Princeton Survey Research Associates International (PSRAI). Both the random digit dial landline and cell phone samples were provided by Survey Sampling International, LLC. For the landline sample, respondents were selected by asking for the youngest adult male or female currently at home based on a random rotation. If no one of that gender was available, interviewers asked to speak with the youngest adult of the opposite gender. For the cell phone sample, interviews were conducted with the adult who answered the phone. KFF paid for all costs associated with the survey.
The combined landline and cell phone sample was weighted to balance the sample demographics to match estimates for the national population using data from the Census Bureau’s 2013 American Community Survey (ACS) on sex, age, education, race, Hispanic origin, nativity (for Hispanics only), and region along with data from the 2010 Census on population density. The sample was also weighted to match current patterns of telephone use using data from the July-December 2014 National Health Interview Survey. The weight takes into account the fact that respondents with both a landline and cell phone have a higher probability of selection in the combined sample and also adjusts for the household size for the landline sample. All statistical tests of significance account for the effect of weighting.
The margin of sampling error including the design effect for the full sample is plus or minus 3 percentage points. Numbers of respondents and margins of sampling error for key subgroups are shown in the table below. For results based on other subgroups, the margin of sampling error may be higher. Sample sizes and margins of sampling error for other subgroups are available by request. Note that sampling error is only one of many potential sources of error in this or any other public opinion poll. Kaiser Family Foundation public opinion and survey research is a charter member of the Transparency Initiative of the American Association for Public Opinion Research.
| Group | N (unweighted) | M.O.S.E. |
| Total | 1202 | ±3 percentage points |
| Party Identification | ||
| Democrats | 383 | ±6 percentage points |
| Republicans | 316 | ±6 percentage points |
| Independents | 339 | ±6 percentage points |
| Insurance Status | ||
| Insured, ages 18-64 | 745 | ±4 percentage points |
| Uninsured, ages 18-64 | 106 | ±10 percentage points |
Endnotes
- The December Kaiser Health Tracking Poll was in the field when the U.S. Senate voted to repeal the health care law on December 3, 2015. ↩︎