The Impact of the Coverage Gap for Adults in States not Expanding Medicaid by Race and Ethnicity
Introduction
People of color face longstanding and persistent disparities in accessing health coverage that contribute to greater barriers to care and poorer health outcomes. The Affordable Care Act (ACA) Medicaid expansion to adults with incomes at or below 138% of the federal poverty level (FPL) ($27,724 for a family of three in 2015) makes many uninsured adults of color newly eligible for the program, which could increase their access to care and promote greater health equity. However, in states that do not implement the Medicaid expansion, many poor adults fall into a coverage gap and will likely remain uninsured. This brief examines the impact of this coverage gap by race and ethnicity. It is based on analysis of Current Population Survey data and Medicaid eligibility rules for adults effective January 2015. (See Methods box for more information.) It finds that uninsured Black adults are more than twice as likely as White and Hispanic uninsured adults to fall into the coverage gap since a large share of this population resides in the South where many states have not adopted the Medicaid expansion. As such, the coverage gap may contribute to widening disparities in health and health care over time.
Background
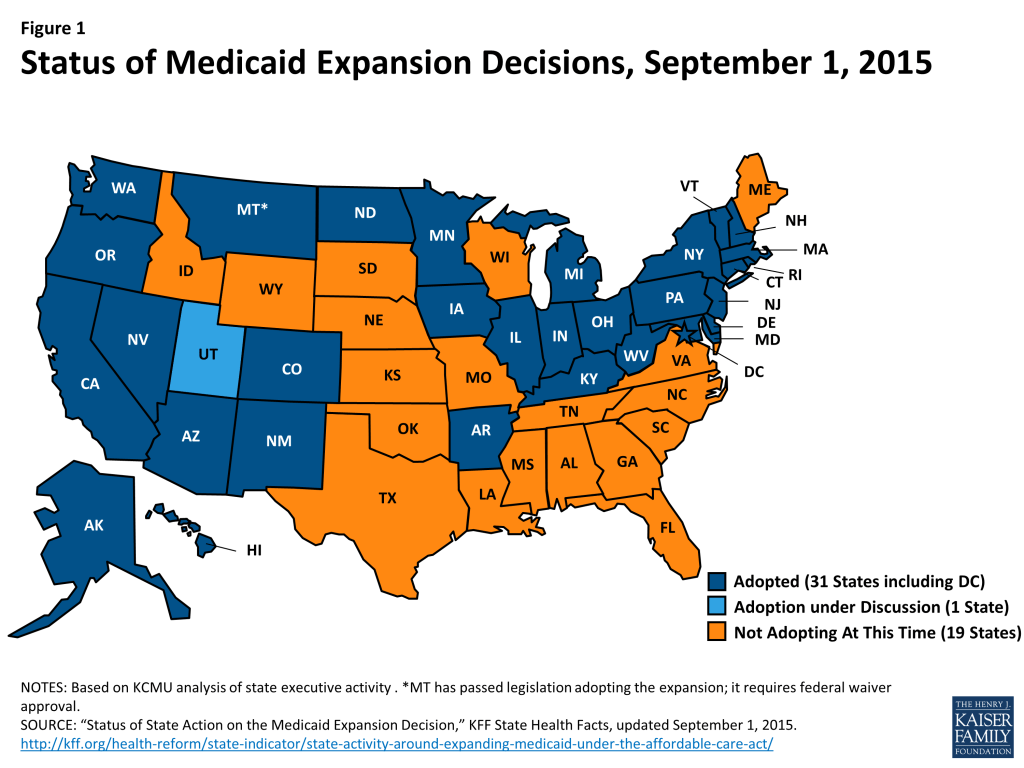
As enacted, the Medicaid expansion to low-income adults would occur nationwide, but it was effectively made a state option by the June 2012 Supreme Court ruling on the constitutionality of the ACA. As of September 2015, 30 states and DC, have adopted the expansion, while 20 states have not adopted the expansion (Figure 1).
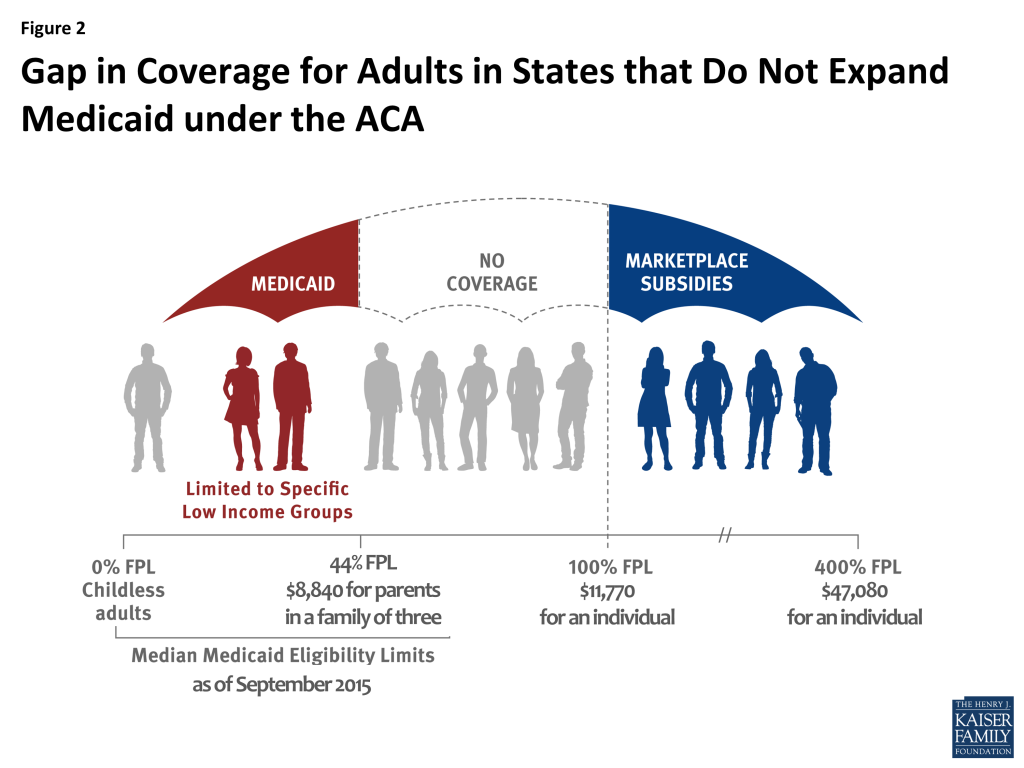
In states that have not expanded Medicaid, 3.1 million poor uninsured adults fall into a “coverage gap” and will likely remain uninsured. These individuals would have been eligible under the Medicaid expansion. However, in the absence of the expansion, they remain ineligible for Medicaid and do not earn enough to qualify for premium tax credits to purchase Marketplace coverage, which begin at 100% FPL (Figure 2). Most of these individuals are likely to remain uninsured as they have limited access to employer coverage and are likely to find the cost of unsubsidized Marketplace coverage prohibitively expensive.
Findings
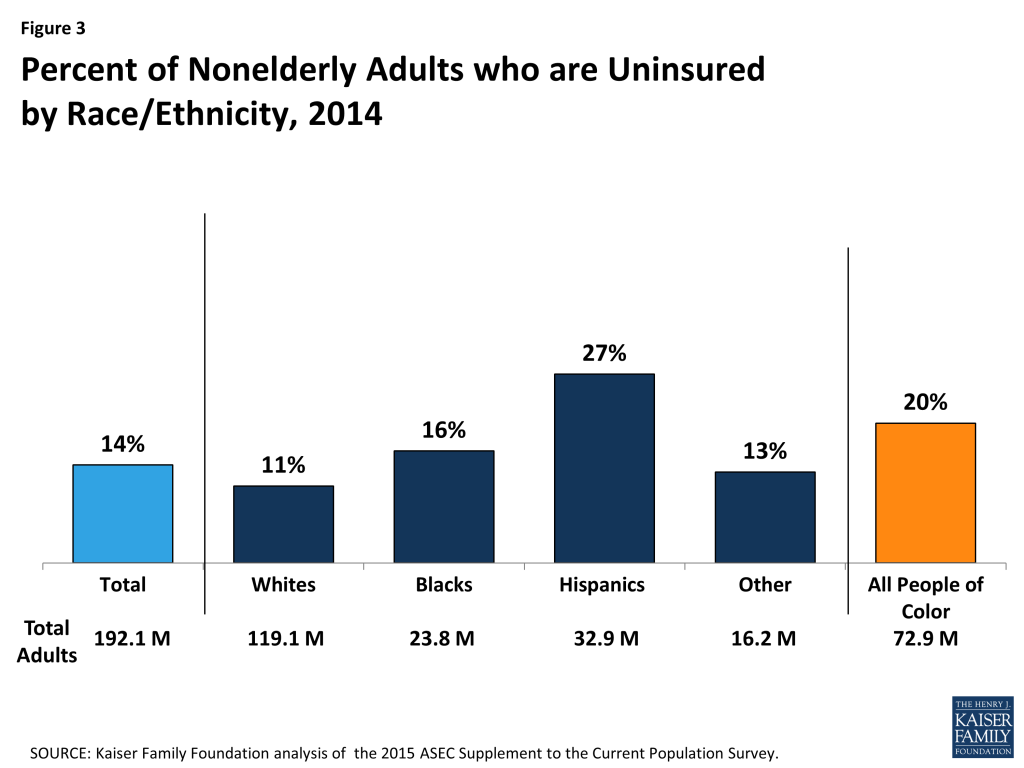
Though millions of people have gained coverage under the ACA, disparities in coverage by race and ethnicity remain. Among adults, people of color are nearly twice as likely to be uninsured than Whites (20% vs. 11%). Hispanic adults are at the highest risk of lacking coverage with more than one in four uninsured (27%), while 16% of Black adults are uninsured (Figure 3).
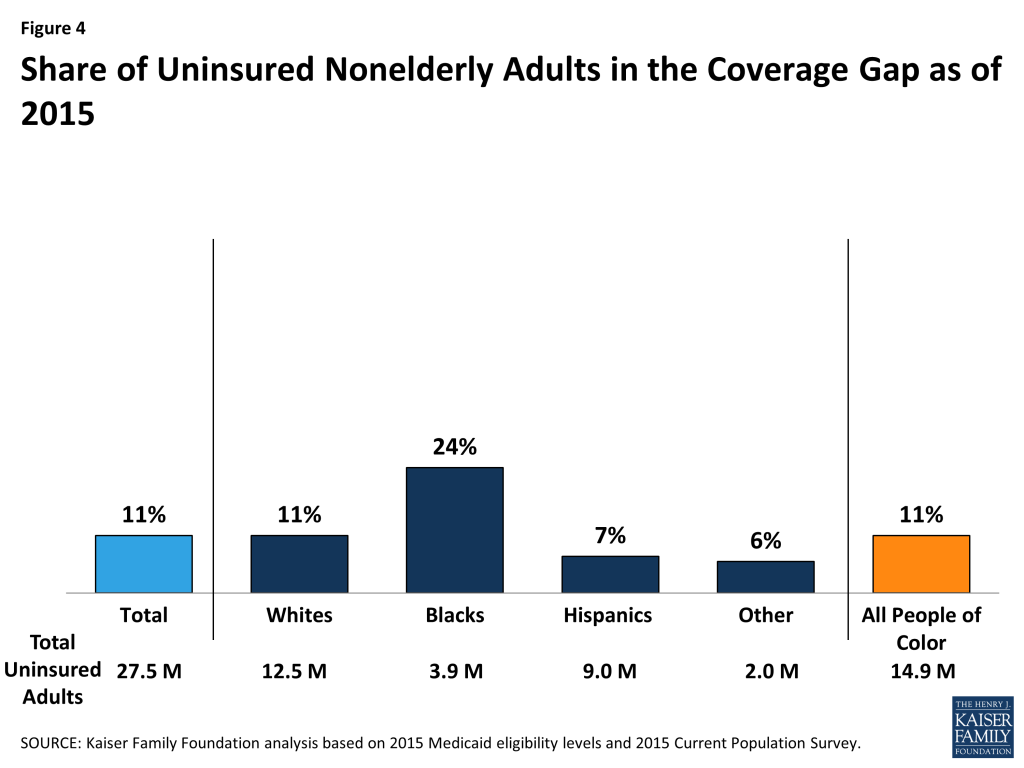
Over 1.7 million adults of color fall into the coverage gap, and uninsured Black adults are disproportionately likely to fall into the gap. Overall, about one in ten (11%) or 3.1 million of the total 27.5 million uninsured adults fall into the coverage gap in the 20 states that have not adopted the ACA Medicaid expansion. This group includes over 1.7 million adults of color. Uninsured Black adults are more than twice as likely as White and Hispanic uninsured adults to fall into the coverage gap. Nearly one-quarter (24%) of uninsured Black adults fall into the coverage gap, compared to 11% of White uninsured adults and 7% of Hispanic uninsured adults (Figure 4). This reflects the fact that a large share of uninsured Black adults resides in the southern region of the country where most states have not adopted the expansion. In contrast, Hispanics are less likely to fall into the gap since several key states that have large numbers of uninsured Hispanics have adopted the expansion, including California, New York, and Arizona.
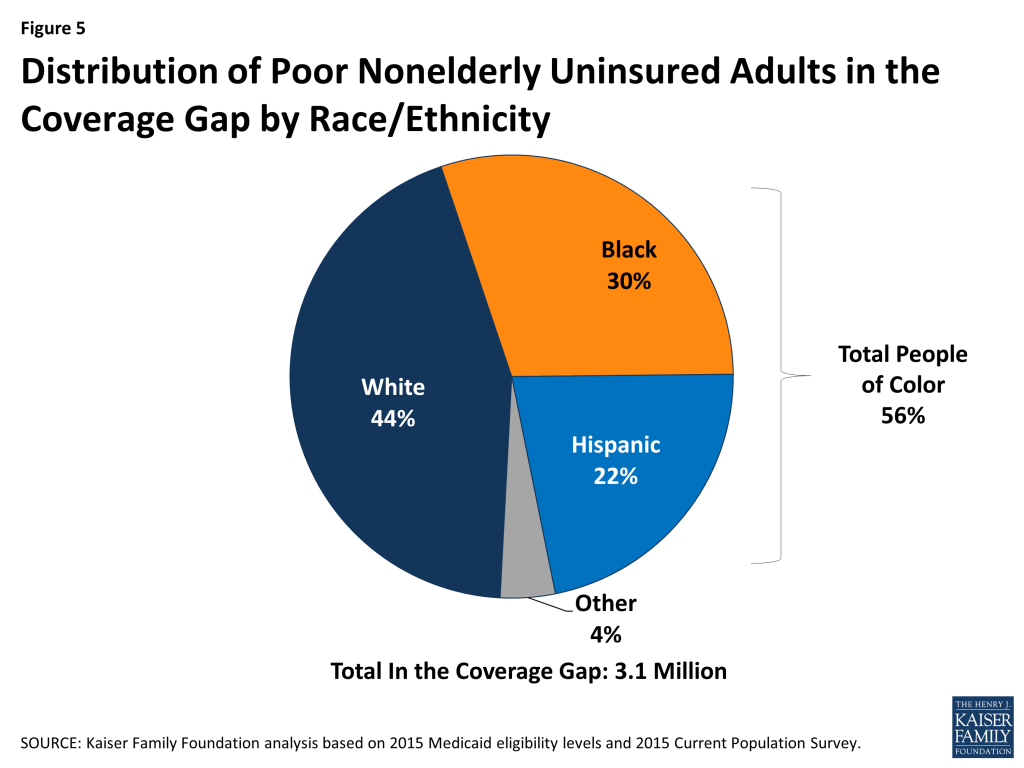
Adults of color make up over half (56%) of the total 3.1 million uninsured adults in the coverage gap. Hispanics (22%) and Blacks (30%) together account for more than half of uninsured adults in the coverage gap; other people of color make up another 4%, while the remaining 44% are White (Figure 5).
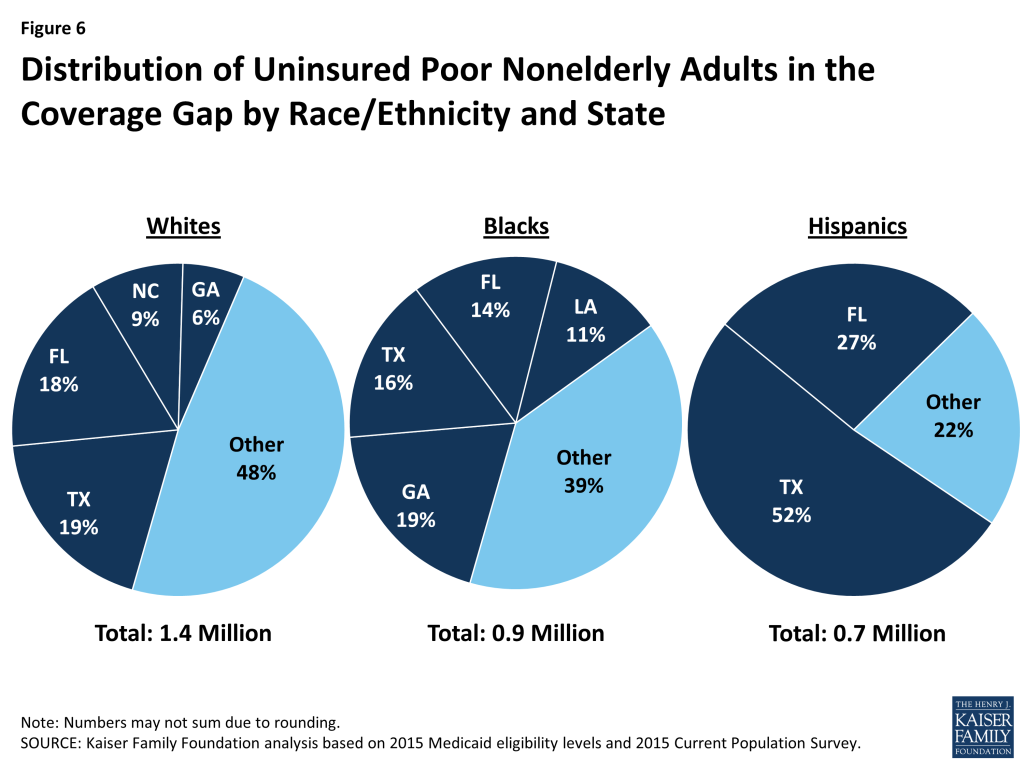
Large shares of adults who fall into the coverage gap reside in a small number of states, although the geographic distribution of people in the gap across states varies by racial and ethnic group. Overall, more than half (53%) of poor adults in the coverage gap reside in just three states, including Texas (25%), Florida (18%), and Georgia (10%). However, the distribution of people in the gap across states varies by racial and ethnic group. For example, over half of (52%) of the 1.4 million uninsured poor White adults in the coverage gap reside in Texas (19%), Florida (18%), North Carolina (9%) and Georgia (6%). Six in ten (61%) of the 0.9 million uninsured poor Black adults in the coverage gap reside in Georgia (19%), Texas (16%), Florida (14%) and Louisiana (11%). Among Hispanics, nearly eight in ten (78%) of the 0.7 million uninsured poor adults in the coverage gap reside in just two states, with over half (52%) in Texas and over one in four (27%) in Florida (Figure 6).
Conclusion
As enacted, the ACA was designed to create a new continuum of coverage options to significantly reduce the number of uninsured, including a Medicaid expansion to adults with incomes at or below 138% FPL. This expansion was intended to fill longstanding gaps in the program for adults and create a nationwide base of coverage for adults comparable to the national minimum Medicaid income eligibility levels for children. The Medicaid expansion particularly affects people of color given that they are disproportionately likely to both lack health insurance and have low incomes. Increasing health coverage rates can help promote increased access to care and address the persistent disparities many people of color face in securing health coverage.
In states that have not adopted the Medicaid expansion, many poor adults with incomes below the federal poverty level fall into a coverage gap because they remain ineligible for Medicaid but earn too little to qualify for premium tax credits for Marketplace coverage. As a result, they are likely to remain uninsured. The impact of the coverage gap varies by race and ethnicity, with poor uninsured Blacks most likely to fall into the gap, since they disproportionately reside in the southern region of the country where most states are not implementing the expansion. These continued gaps in access to health coverage will likely continue to contribute to racial and ethnic as well as geographic disparities in coverage and access to care.
Samantha Artiga and Rachel Garfield are with the Kaiser Family Foundation. Anthony Damico is an independent consultant to the Kaiser Family Foundation.
Methods
This analysis uses data from the 2015 Current Population Survey (CPS) Annual Social and Economic Supplement (ASEC). The CPS ASEC provides socioeconomic and demographic information for the United Sates population and specific subpopulations. Importantly, the CPS ASEC provides detailed data on families and households, which we use to determine income for ACA eligibility purposes.
The CPS asks respondents about coverage at the time of the interview (for the 2015 CPS, February, March, or April 2015) as well as throughout the preceding calendar year. People who report any type of coverage throughout the preceding calendar year are counted as “insured.” Thus, the calendar year measure of the uninsured population captures people who lacked coverage for the entirety of 2014 (and thus were uninsured at the start of 2015). We use this measure of insurance coverage, rather than the measure of coverage at the time of interview, because the latter lacks detail about coverage type that is used in our model. Based on other survey data, as well as administrative data on ACA enrollment, it is likely that a small number of people included in this analysis gained coverage in 2015.
Medicaid and Marketplaces have different rules about household composition and income for eligibility. For this analysis, we calculate household membership and income for both Medicaid and Marketplace premium tax credits for each person individually, using the rules for each program. For more detail on how we construct Medicaid and Marketplace households and count income, see the detailed technical Appendix A available here.
Undocumented immigrants are ineligible for Medicaid and Marketplace coverage. Since CPS data do not directly indicate whether an immigrant is lawfully present, we draw on the methods underlying the 2013 analysis by the State Health Access Data Assistance Center (SHADAC) and the recommendations made by Van Hook et. al.1 ,2 This approach uses the Survey of Income and Program Participation (SIPP) to develop a model that predicts immigration status; it then applies the model to CPS, controlling to state-level estimates of total undocumented population from Department of Homeland Security. For more detail on the immigration imputation used in this analysis, see the technical Appendix B available here.
Individuals in tax-filing units with access to an affordable offer of Employer-Sponsored Insurance are still potentially MAGI-eligible for Medicaid coverage, but they are ineligible for advance premium tax credits in the Health Insurance Exchanges. Since CPS data do not directly indicate whether workers have access to ESI, we draw on the methods comparable to our imputation of authorization status and use SIPP to develop a model that predicts offer of ESI, then apply the model to CPS. For more detail on the offer imputation used in this analysis, see the technical Appendix C available here.
As of January 2014, Medicaid financial eligibility for most nonelderly adults is based on modified adjusted gross income (MAGI). To determine whether each individual is eligible for Medicaid, we use each state’s reported eligibility levels as of January 1, 2015, updated to reflect state implementation of the Medicaid expansion as of September 2015 and 2015 Federal Poverty Levels.3 Some nonelderly adults with incomes above MAGI levels may be eligible for Medicaid through other pathways; however, we only assess eligibility through the MAGI pathway.4
An individual’s income is likely to fluctuate throughout the year, impacting his or her eligibility for Medicaid. Our estimates are based on annual income and thus represent a snapshot of the number of people in the coverage gap at a given point in time. Over the course of the year, a larger number of people are likely to move and out of the coverage gap as their income fluctuates.
- State Health Access Data Assistance Center. 2013. “State Estimates of the Low-income Uninsured Not Eligible for the ACA Medicaid Expansion.” Issue Brief #35. Minneapolis, MN: University of Minnesota. Available at: http://www.rwjf.org/content/dam/farm/reports/issue_briefs/2013/rwjf404825 ↩︎
- Van Hook, J., Bachmeier, J., Coffman, D., and Harel, O. 2015. “Can We Spin Straw into Gold? An Evaluation of Immigrant Legal Status Imputation Approaches” Demography. 52(1):329-54. ↩︎
- Based on state-reported eligibility levels as of January 1, 2015. Eligibility levels are updated to reflect state implementation of the Medicaid expansion as of September 2015 and 2015 Federal Poverty Levels, but may not reflect other eligibility policy changes since January 2015. The Kaiser Family Foundation State Health Facts. Data Source: Kaiser Commission on Medicaid and the Uninsured with the Georgetown University Center for Children and Families: Modern Era Medicaid: Findings from a 50-State Survey of Eligibility, Enrollment, Renewal, and Cost-Sharing Policies in Medicaid and CHIP as of January 2015, Kaiser Family Foundation, January 20, 2015. ↩︎
- Non-MAGI pathways for nonelderly adults include disability-related pathways, such as SSI beneficiary; Qualified Severely Impaired Individuals; Working Disabled; and Medically Needy. We are unable to assess disability status in the CPS sufficiently to model eligibility under these pathways. However, previous research indicates high current participation rates among individuals with disabilities (largely due to the automatic link between SSI and Medicaid in most states, see Kenney GM, V Lynch, J Haley, and M Huntress. “Variation in Medicaid Eligibility and Participation among Adults: Implications for the Affordable Care Act.” Inquiry. 49:231-53 (Fall 2012)), indicating that there may be a small number of eligible uninsured individuals in this group. Further, many of these pathways (with the exception of SSI, which automatically links an individual to Medicaid in most states) are optional for states, and eligibility in states not implementing the ACA expansion is limited. For example, the median income eligibility level for coverage through the Medically Needy pathway is 15% of poverty in states that are not expanding Medicaid, and most states not expanding Medicaid do not provide coverage above SSI levels for individuals with disabilities. (See: O’Mally-Watts, M and K Young. The Medicaid Medically Needy Program: Spending and Enrollment Update. (Washington, DC: Kaiser Family Foundation), December 2012. Available at: http://modern.kff.org/medicaid/issue-brief/the-medicaid-medically-needy-program-spending-and/. And Kaiser Commission on Medicaid and the Uninsured, “Medicaid Financial Eligibility: Primary Pathways for the Elderly and People with Disabilities,” February 2010. Available at: http://modern.kff.org/medicaid/issue-brief/medicaid-financial-eligibility-primary-pathways-for-the-elderly-and-people-with-disabilities/. ↩︎