Health Coverage for the Black Population Today and Under the Affordable Care Act
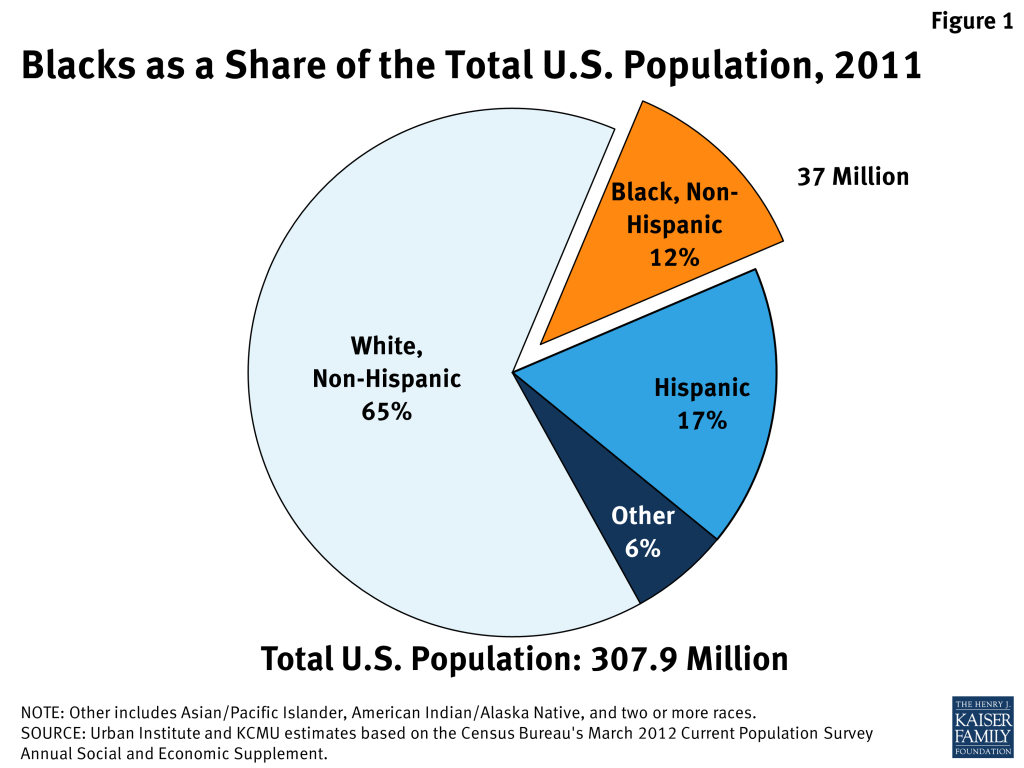
As of 2011, 37 million individuals living in the United States identified as Black or African American. Blacks currently comprise the third largest racial or ethnic group in the United States after non-Hispanic Whites and Hispanics (Figure 1). While it is projected that the nation will become increasingly diverse and the Black population will grow over the next few decades, Blacks are anticipated to maintain a consistent share of the population. The Affordable Care Act (ACA) has important implications for Blacks as they face longstanding and persistent disparities in health and health care.
One of the key goals of the ACA is to reduce the number of uninsured through an expansion of Medicaid and the creation of new health insurance exchange marketplaces with tax credits to help moderate-income individuals purchase coverage. Many uninsured Blacks could benefit from these new pathways to coverage, which would help increase their access to care and promote greater equity in health care. This brief provides an overview of the Black population in the U.S., their health coverage today, and how their coverage may be affected by the ACA coverage expansions.
Overview of the Black Population
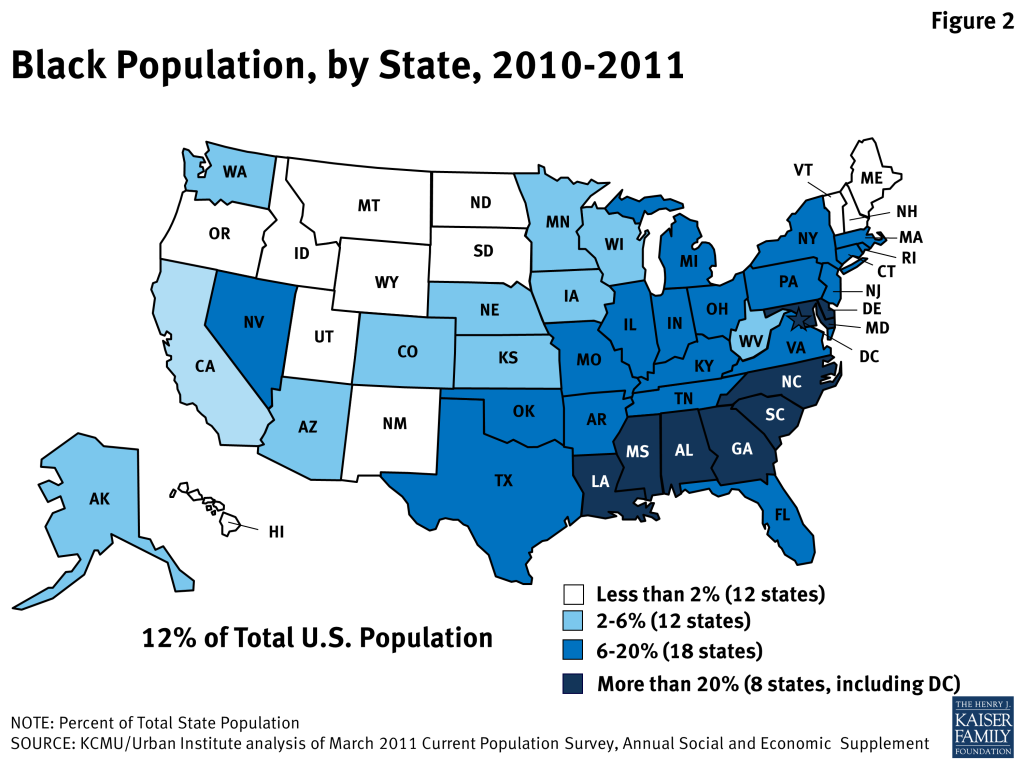
The 37 million Blacks residing in the United States make up more than a tenth of the total population. In eight states, largely concentrated in the South, and the District of Columbia, Blacks comprise at least 20% of the total population, whereas they comprise a very small share of the population in many states in the Northwest and Midwest (Figure 2). Over half of all Blacks live in just eight states, including Texas, Florida, Georgia, New York, California, North Carolina, Illinois, and Maryland.
There is diversity within the Black population. The population includes individuals of varying ethnicities and immigration statuses. For example, while some African American families have been in the United States for many generations, others are more recent immigrants from places such as Africa, the Caribbean, or the West Indies. However, the vast majority of Blacks are U.S.-born citizens (92%). In addition, there is diversity in educational attainment, socioeconomic status, and other characteristics. Aggregate data can obscure many of these socio-demographic differences within the Black population.
Compared to non-Hispanic Whites, the Black population is notably younger. Overall, 40 percent of all Blacks are under the age 26, compared to 30 percent of non-Hispanic Whites and 35 percent of all U.S. residents. Blacks are also nearly half as likely as Whites to be over the age of 65. In 2011, 10 percent of Blacks were elderly adults, compared to 17 percent of Whites.
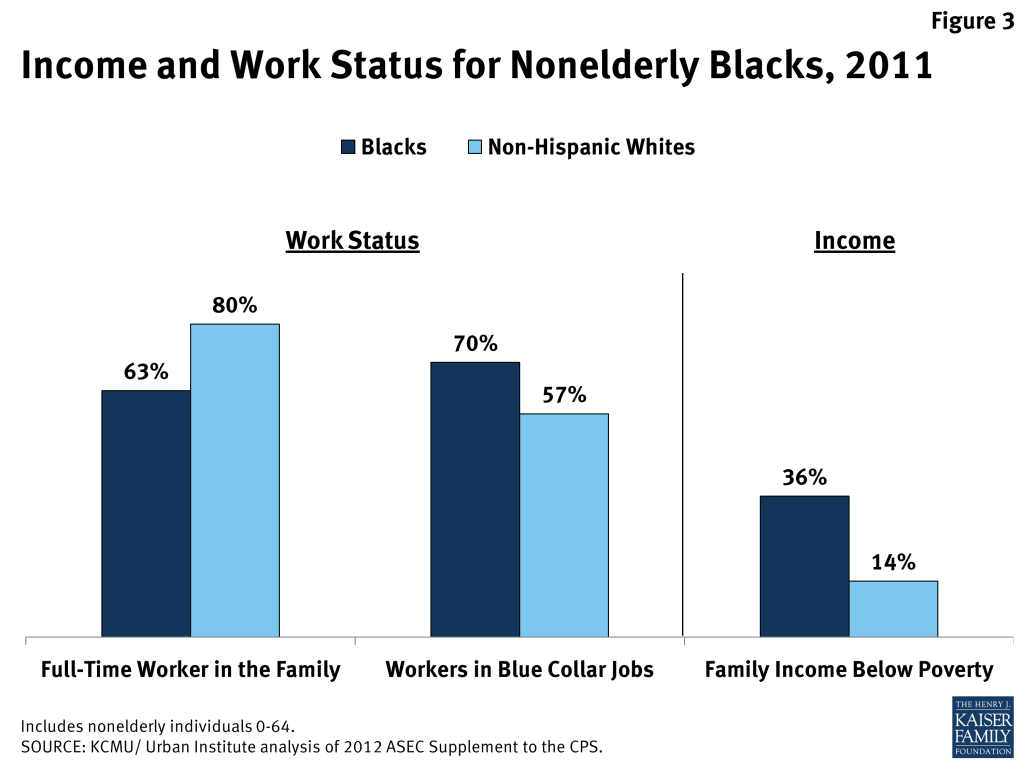
While the majority of nonelderly Blacks are in working families, they are significantly more likely than Whites to be poor. Overall, nearly two-thirds of nonelderly Blacks have a full-time worker in the family. However, the large majority of Black workers (70%) are employed in blue-collar jobs that typically provide low wages and are less likely than white collar jobs to offer health insurance coverage. Reflecting both lower full-time employment rates and higher concentrations of Black workers in blue-collar jobs, African Americans are two and half times more likely than Whites to have family income below the poverty level (Figure 3).
Health Coverage of Nonelderly Blacks Today
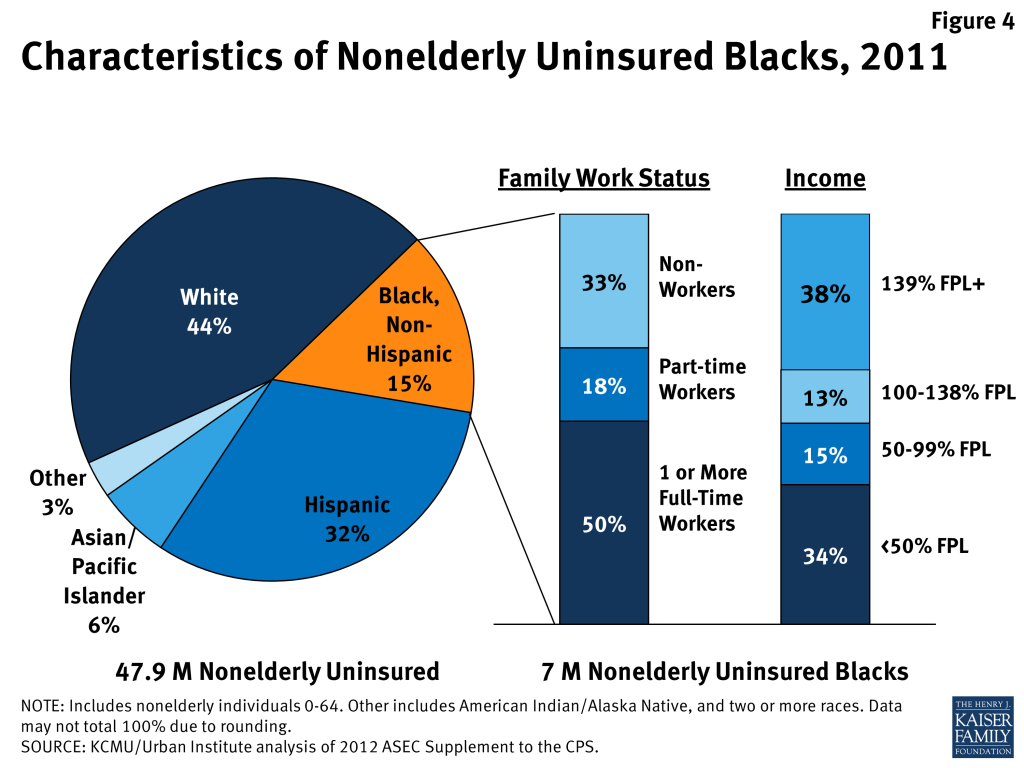
As of 2011, there are over 7 million uninsured nonelderly Blacks, who make up about 15% of the total nonelderly uninsured population (Figure 4). Over five in six (84%) uninsured Blacks are adults, while the remaining one million are children age 18 or younger. More than two-thirds are in a working family, including half who have at least one full-time worker in the family. However, the majority have low incomes (below 138% of poverty), including over a third who have very low-incomes below half the poverty level.
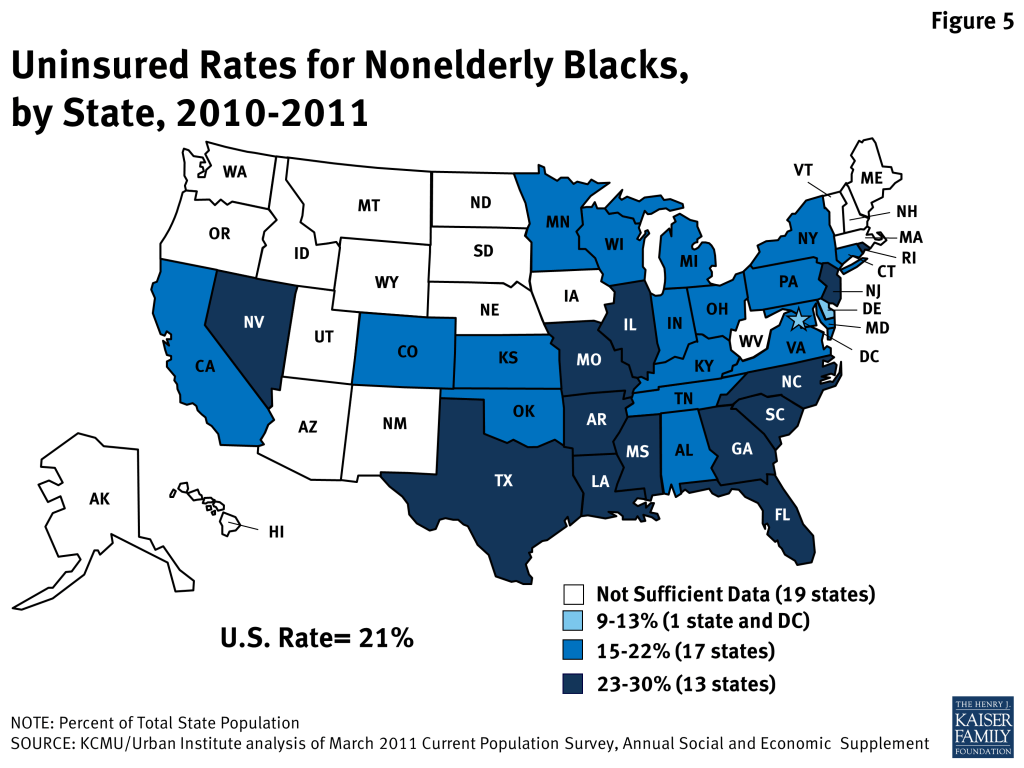
Nationwide, just over one in five (21%) of Blacks do not have health insurance. However, the likelihood of being uninsured varies widely across states, ranging from 9 percent of Blacks in Delaware to 30 percent in Louisiana. Uninsured rates for nonelderly Blacks are particularly high in the South (Figure 5). The largest uninsured nonelderly Black populations reside in Florida (718,800), Texas (613,100), and Georgia (594,600). In addition, Blacks comprise a large share of the uninsured population in the District of Columbia (52%), Mississippi (48%), and Louisiana (42%).
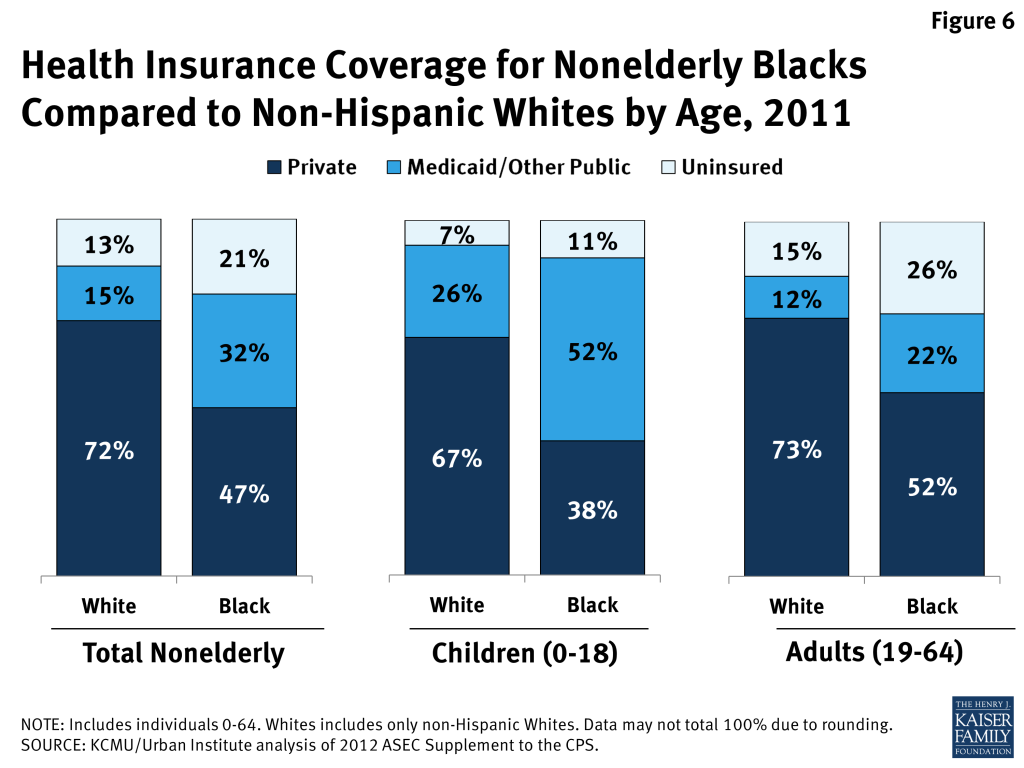
Blacks are significantly more likely than Whites to be uninsured. Reflecting their limited access to employer-sponsored insurance, less than half of nonelderly Blacks have private coverage compared to over seven in ten non-Hispanic Whites (Figure 6). Medicaid coverage helps fill some of the gap in private health insurance, covering nearly one in three of all nonelderly Blacks (32%). However, Medicaid does not fully offset the difference leaving more than one in five (21%) nonelderly Blacks uninsured, compared to 13% their White counterparts.
Medicaid covers over half of Black children (51%), helping to substantially fill their gap in private coverage. Medicaid plays a much more limited role for Black adults, leaving more than a quarter uninsured (26%). These coverage patterns reflect the fact that states have significantly expanded children’s eligibility for Medicaid and CHIP, while Medicaid eligibility for adults remains very limited in most states.
Coverage for Blacks Under the ACA Coverage Expansions
As noted, one of the key goals of the ACA is to reduce the number of uninsured. Beginning in 2014, Medicaid eligibility will expand to adults with incomes up to 138% of poverty ($26,951 for family of three in 2013), in states that implement the ACA’s Medicaid expansion. In addition, beginning in 2014, new health insurance marketplaces will become available through which individuals will be able to purchase coverage, and premium tax credit subsidies will be available to help moderate income individuals without access to affordable employer coverage pay for coverage offered through these marketplaces.
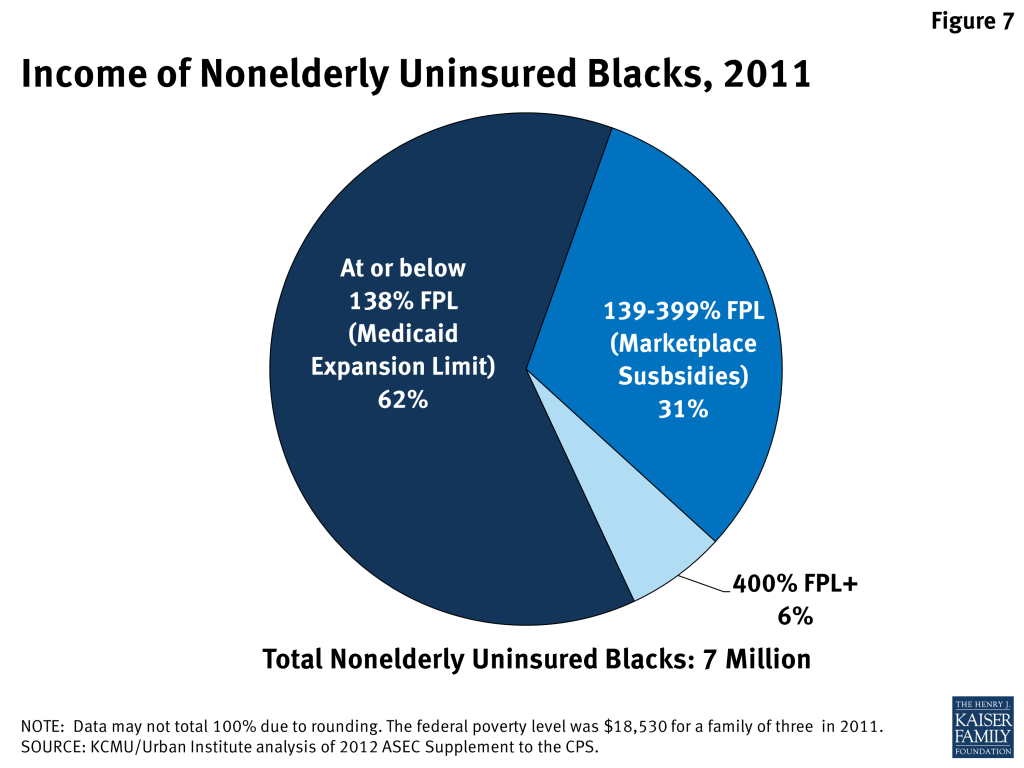
Given the low incomes of uninsured Blacks, nearly all (94%) would be in the income range to qualify for the Medicaid expansion or premium tax credits. Nearly two thirds (62%) of uninsured Blacks have incomes at or below the Medicaid expansion limit of 138% FPL, while an additional 31% would be income-eligible for tax subsidies to help cover the cost of buying health insurance through the exchange marketplaces (Figure 7). Uninsured Blacks have high stakes in state decisions to expand Medicaid. While the ACA intended for the Medicaid expansion to occur nationwide, the June 2012 Supreme Court decision on the ACA effectively made this expansion a state option. Given that the majority of uninsured Blacks have incomes below the Medicaid expansion limit, they will be significantly impacted by state decisions to expand Medicaid. In the absence of the expansion, poor uninsured adults will not gain a new coverage option and likely remain uninsured. Other analysis finds that Blacks are at highest risk of continuing to face coverage gaps due to state decisions not to expand at this time, with nearly six in ten (59%) uninsured Blacks with incomes below the Medicaid expansion limit residing in states that were not planning to expand Medicaid as of late June 2013.1
Implications
Today, Blacks remain significantly more likely to be uninsured compared to Whites. This disparity, in large part, reflects that many Blacks do not have access to employer-sponsored insurance and cannot afford to purchase private coverage on the individual market due to their low incomes. Given limited access to private coverage and low incomes, Medicaid is an important source of coverage for 9.4 million Blacks, many of whom would otherwise go uninsured. However, Medicaid eligibility levels for adults remain limited in most states today, particularly in the South, where Blacks are more likely to live. As such, over 7 million Blacks remain uninsured, the majority of whom are adults.
The ACA coverage expansions provide an important opportunity to increase health coverage and access to care for uninsured Blacks. Given that most uninsured Blacks are in low-income families, the majority would be in the income range to qualify for the ACA coverage expansions, particularly the Medicaid expansion. As such, state decisions to implement the ACA Medicaid expansion have particularly important implications for Blacks. If a state does not implement the expansion, poor uninsured adults will not gain a new coverage option and will likely remain uninsured. Currently, Blacks are at the highest risk of continuing to face coverage gaps due to state expansion decisions. Even with the coverage expansions, targeted outreach and enrollment assistance will be important for ensuring eligible individuals enroll in coverage. The ACA will help address many historical procedural barriers to enrollment through new streamlined, data-driven enrollment processes that will go in place in 2014. However, targeted outreach and one-on-one application assistance from trusted individuals within the community will remain key for facilitating enrollment of eligible individuals.
Increasing health insurance coverage may significantly reduce disparities in access to care and health outcomes for Blacks. Widespread research shows that uninsured individuals experience worse access to care and poorer health outcomes.2 Moreover, evidence suggests that Blacks face wide and persistent disparities in health3 and health care.4 For example, infant mortality rates are significantly higher for Black infants and Black males of all ages have the shortest life expectancy compared to all other groups.5 Several chronic conditions affect a greater percentage of Blacks compared to non-Hispanic Whites, including diabetes and obesity.6 In addition, Blacks are less likely to have a usual source of care, compared to Whites.7 Increasing health coverage rates among Blacks could significantly increase access to care and eventually contribute to improved health outcomes as well as greater equity in health and health care. Conversely, coverage gaps, especially in states that do not move forward with the Medicaid expansion, may lead to widening disparities in coverage and care over time.
- Kaiser Family Foundation. “The Impact of Current State Medicaid Expansion Decisions on Coverage by Race and Ethnicity.” June 2013. Available at http://modern.kff.org/disparities-policy/issue-brief/the-impact-of-current-state-medicaid-expansion-decisions-on-coverage-by-race-and-ethnicity/. ↩︎
- KCMU. “The Uninsured: A Primer. Key Facts About Americans Without Health Insurance.” October 2012. Available at http://modern.kff.org/uninsured/issue-brief/the-uninsured-a-primer/. ↩︎
- Institute of Medicine. Unequal Treatment: Confronting Racial and Ethnic Disparities in Health Care. 2003. Available at http://www.iom.edu/Reports/2002/Unequal-Treatment-Confronting-Racial-and-Ethnic-Disparities-in-Health-Care.aspx. ↩︎
- Agency for Healthcare Research and Quality. National Healthcare Disparities Report 2011. Available at http://www.ahrq.gov/research/findings/nhqrdr/nhdr11/index.html. ↩︎
- Arias, E., B. L. Rostron, and B. Tejada-Vera. “United States Life Tables, 2005.” National Vital Statistics Reports. 2010; 58(10). Available at http://www.cdc.gov/nchs/data/nvsr/nvsr58/nvsr58_10.pdf. ↩︎
- Centers for Disease Control and Prevention. Health Disparities and Inequalities Report—United States, 2011. January 2011. Available at http://www.cdc.gov/mmwr/pdf/other/su6001.pdf. ↩︎
- Agency for Healthcare Research and Quality. National Healthcare Disparities Report 2011. Available at http://www.ahrq.gov/research/findings/nhqrdr/nhdr11/index.html. ↩︎