Global Financing for Malaria: Trends & Future Status
Executive Summary
Since the establishment of global malaria incidence and mortality reduction targets in the Millennium Development Goals (MDGs) in 2000, significant progress has been made in addressing the global malaria epidemic. Between 2000 and 2012, global malaria incidence rates are estimated to have decreased by 25% and mortality rates by 42%, and more than 30 countries are actively pursuing malaria elimination. Despite this progress, however, there were approximately 207 million malaria cases and 627,000 deaths in 2012, and close to 100 countries have ongoing malaria transmission. In addition, approximately half the world’s population remains at risk for malaria.1 As such, it is unclear whether global malaria control targets set out by the World Health Organization (WHO) and the Roll Back Malaria (RBM) Partnership, including reducing malaria cases by 75% and malaria deaths to near zero by the end of 2015, will be reached.2 ,3 ,4
Critical to reaching global malaria targets is adequate funding. The Global Malaria Action Plan (GMAP), released by Roll Back Malaria in 2008 as a framework to guide malaria control efforts through 2015, estimated that funding would need to reach an average of US$5.1 billion annually between 2011 and 2020 in order to reach malaria control and elimination targets. Additionally, GMAP estimates that funding for malaria research and development (R&D) would need to reach at US$750-900 million annually between 2008-2018.5
This report provides an analysis of malaria funding trends for control and elimination and R&D activities over time compared to the estimated need presented in the GMAP. It also looks ahead to assess projected funding availability. The report is based on analysis of data obtained from the United States (U.S.) government; the Global Fund to Fight AIDS, Tuberculosis and Malaria (Global Fund); the Organisation for Economic Co-operation and Development (OECD) Development Assistance Committee (DAC); WHO; Policy Cures; and the Bill & Melinda Gates Foundation (Gates Foundation) (see Methodology for more information). The analysis is timely as the global community is in the process of evaluating progress on the MDGs, and looks beyond 2015 to set new and updated malaria targets.6 ,7 As it finds, while funding for malaria has risen significantly over time, it is far below estimated need and the gap is significant.
Key Findings Include:
Global Funding for Malaria Control and Elimination:
- In 2013, funding for malaria control reached US$2.6 billion, its highest level to date.
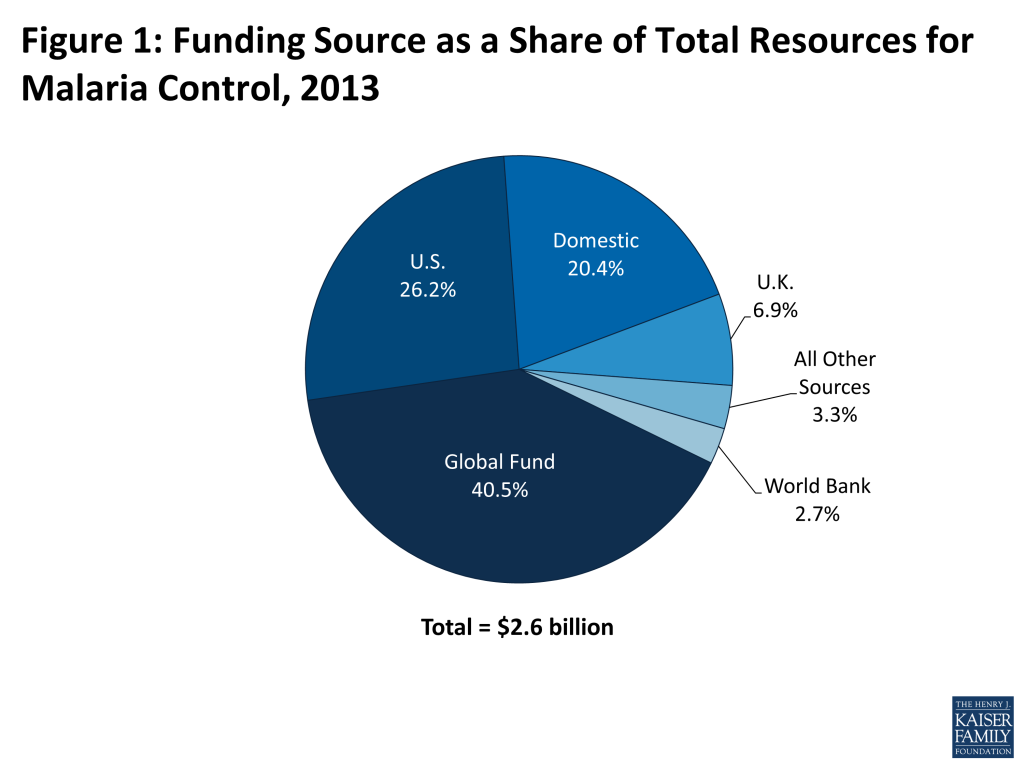
- Approximately two-thirds of all funding for malaria control is concentrated among just two donors: the Global Fund, which is the single largest source of malaria funding, accounting for 40% (US$1.0 billion) of funding in 2013, and U.S. bilateral funding (US$675 million, 26%). The next largest source, domestic resources provided by malaria-affected countries, accounts for one-fifth of funding (US$527 million, 20%), followed by the United Kingdom (U.K.) (US$179 million, 7%), and the World Bank (US$71 million, 3%).
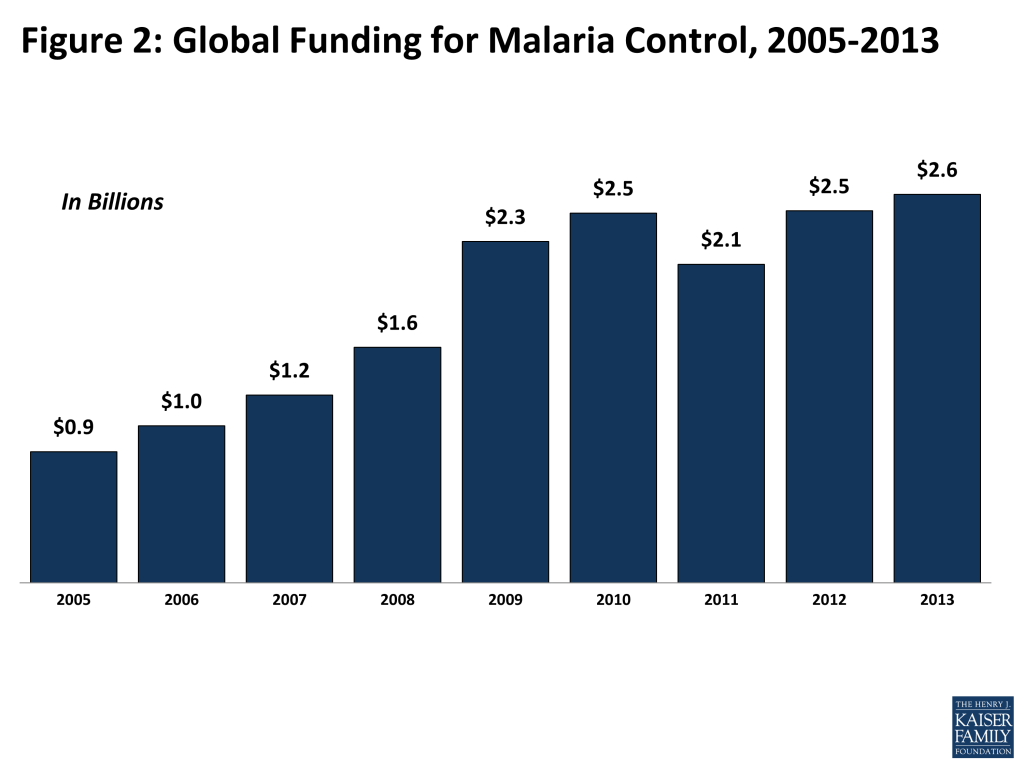
- Funding for malaria control has increased significantly over the past decade, rising three fold between 2005 and 2013, (from US$871 million in 2005 to US$2.6 billion in 2013), largely due to the creation of the Global Fund. Recent increases, however, have slowed.
Global Funding for Malaria R&D:
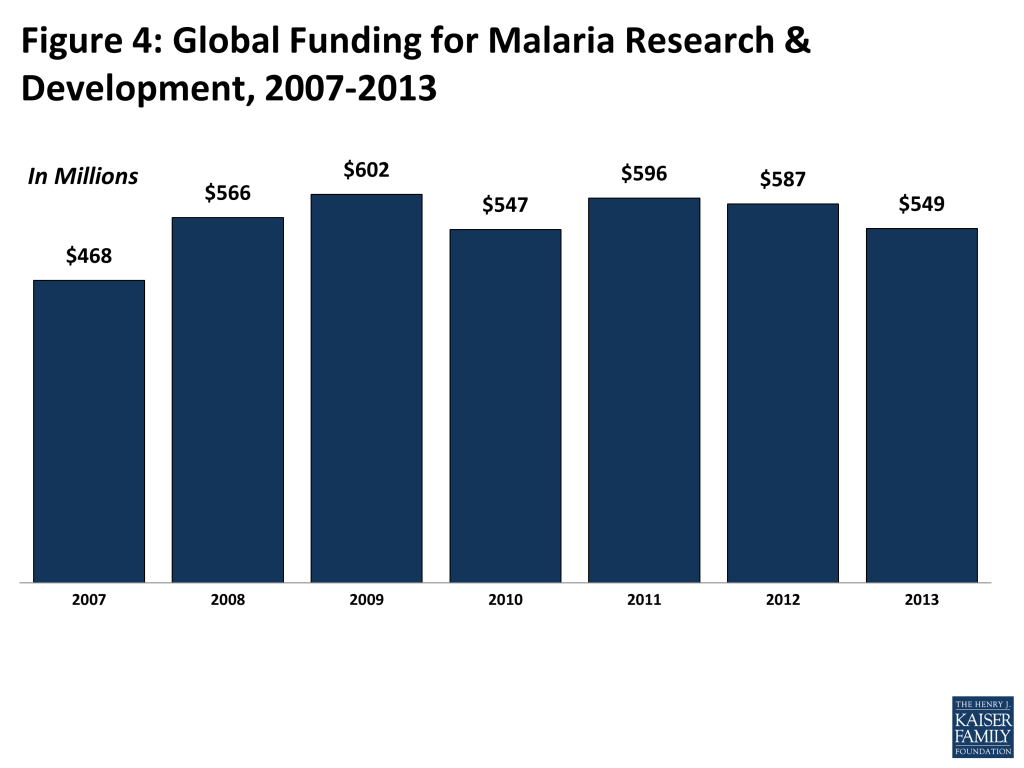
- In 2013, funding for malaria R&D activities totaled US$549 million. This represents a decrease of US$38 million (7%) from 2012 levels and the second consecutive year of declines in R&D funding for malaria.
- The U.S. National Institutes of Health (NIH) accounted for the largest share (25%) of funding for malaria R&D activities followed by the Gates Foundation (22%), the pharmaceutical and biotechnology industry (15%), the U.K. Department for International Development (DFID) (5%), and the Wellcome Trust (5%).
Global Funding Gap & Looking Ahead:
- Despite significant increases over the past decade, total funding for malaria control activities is significantly below the GMAP’s estimated annual need of US$5.1 billion. Similarly, support for malaria R&D programs was also below the estimated annual need (US$750-900 million).
- While funding levels for malaria control activities beyond 2013 are not yet known for all funding sources, projected data are available from the U.S. and the Global Fund, the two largest funders for malaria efforts, and both are projected to increase their funding in the next several years. However, even with these increases, projected funding would only reach US$3.0 billion in each year between 2014 and 2016, still leaving a gap of more than US$2 billion. In addition, the concentration of malaria funding from these two donors makes funding highly dependent on their future funding trajectories.
- While projections of future funding levels are not available for malaria R&D activities, if the funding declines of the past two years continue, the gap between estimated need and available resources will increase.
- Taken together, these estimates indicate that unless significant additional resources are provided, this gap cannot be filled. As the global community meets to decide on updated malaria control targets and funding needs, it will be critical to assess where resources are likely to come from, particularly given the large gap identified here.
Report: Introduction
Since the establishment of global malaria incidence and mortality reduction targets (see Box 1), significant progress has been made in addressing the global malaria epidemic. Between 2000 and 2012, the WHO estimates that global malaria incidence rates decreased by 25% and mortality rates decreased by 42%, saving an estimated 3.3 million lives, with more than 30 countries actively pursuing malaria elimination. Despite this progress, approximately 207 million malaria cases and 627,000 deaths occurred in 2012, and close to 100 countries report ongoing malaria transmission. Approximately half the world’s population remains at risk for malaria making it unclear whether global malaria targets set out by the WHO and RBM, including reducing malaria cases by 75% and malaria deaths to near zero by the end of 2015, will be reached. 8 ,9 ,10 ,11
Box 1: Global Malaria Reduction Targets
The global community has established multiple targets and objectives over time to guide efforts to address malaria. These targets and objectives, which form the basis of estimated funding needs, include:–Millennium Development Goal (MDG) 6, 2000: Combat HIV/AIDS, Malaria and Other Diseases
- Target 6.C: Have halted by 2015 and begun to reverse the incidence of malaria and other major diseases.
World Health Assembly Target, 2005
- Reduce malaria cases by 75% between 2000 and 2015.
Roll Back Malaria (RBM) GMAP, 2008/2011:
- Endorsed WHA target of reducing malaria by 75% between 2000 and 2015;
- Reduce global malaria deaths to near zero by end 2015; and
- Eliminate malaria by end 2015 in 8-10 new countries (since 2008).
Sources: United Nations, Millennium Development Goals, 2000; WHO, Fifty-Eighth World Health Assembly: Resolutions and Decisions Annex, May 2005; Roll Back Malaria, The Global Malaria Action Plan: For a malaria-free world, September 2008; Roll Back Malaria, Refined/Updated GMAP Objectives, Targets, Milestones and Priorities Beyond 2011, June 2011.
Critical to reaching global malaria targets is adequate funding. The GMAP, released by RBM in 2008 to provide a global framework for guiding malaria control efforts through the end of 2015, estimated that funding would need to reach an average of US$5.1 billion annually between 2011 and 2020 in order to reach global targets.12 Funding for malaria control and elimination supports efforts to prevent infection, including the provision of insecticide-treated bed nets (ITNs), indoor residual spraying (IRS), and intermittent preventive treatment in pregnancy (IPTp), as well as the treatment of infection, including antimalarial drugs such as artemisinin-based combination therapy (ACT).
Funding needs for malaria R&D, which supports the development of new diagnostics, vector control products, vaccines, and treatment, were estimated at US$750-900 million annually between 2008-2018.13 As the global community evaluates progress on the MDGs, and looks beyond 2015 with concurrent efforts to update the GMAP and develop a global technical strategy for malaria, this report provides an analysis of malaria funding trends over the past decade by funding source (see Box 2), and looks ahead, to assess projected funding availability relative to need.14 ,15
Box 2: Sources of Funding for Malaria
This report highlights four major funding streams for malaria: donor governments, multilateral organizations, domestic resources, and the private sector.
Donor Governments: Provide direct funding to support malaria programs in affected countries, make contributions to multilateral organizations that in turn support malaria activities, and provide funding for research and development activities.
Multilateral Organizations: Provide assistance for malaria using pooled funds from member contributions and other means. Contributions to multilateral organizations are usually made by governments, but can be provided by private organizations and individuals, as in the case of the Global Fund. Some multilateral organizations are designed to address specific issues (such as the Global Fund, which also finances HIV and TB efforts as well as related health systems improvements), while other multilateral organizations that are not specifically designed to address malaria, may include malaria activities within their broader portfolio (such as the World Bank).
Domestic Resources: Including both spending by country governments that also receive international assistance for malaria and by households/individuals within these countries, represent a significant and critical part of the response.
Private Sector & Public-Private Partnerships: Foundations (charitable and corporate philanthropic organizations), corporations, faith-based organizations, and international non-governmental organizations (NGOs) provide support for malaria activities in recipient countries not only in terms of funding, but through in-kind support; commodity donations; and co-investment strategies with government and other sectors. Public Private Partnerships (PPPs) include initiatives such as the Affordable Medicines Facility-malaria (AMFm), an innovative financing mechanism developed to increase access to ACTs through the provision of highly subsidized prices. First created in 2009 and housed at the Global Fund, it received funding from donors and worked primarily through the private sector. In 2012, the AMFm was transitioned into the core grant management and financial processes of the Global Fund and renamed the Private Sector Co-payment Mechanism.
This report includes analysis of funding for malaria control and R&D activities based on data obtained from the U.S. government; the Global Fund; the OECD DAC; WHO; Policy Cures, an independent research organization that tracks funding for global health research and development activities; and the Gates Foundation (see Methodology for more information). All data are provided in current US dollars. Detailed data by source and year are provided in an Appendix.
Report: Findings
Global Funding for Malaria Control & Elimination
Total funding for malaria control and elimination provided by donor governments, multilateral organizations, and domestic sources was estimated to be US$2.6 billion in 2013. Approximately two thirds of all funding for malaria control is concentrated among just two donors: the Global Fund, which is the single largest source of malaria funding, accounting for 40% (US$1.0 billion) of funding in 2013 and the U.S. (US$675 million, 26%), primarily through its bilateral President’s Malaria Initiative (PMI).16 The next largest source, domestic resources provided by malaria-affected countries, accounts for one-fifth of funding (US$527 million, 20%), followed by the U.K. (US$179 million, 7%), and the World Bank (US$71 million, 3%) (see Figure 1). Together, these five sources accounted for 97% of all funding for malaria control activities (see Box 2 for a description of funding sources).
Funding in 2013 represents an increase of more than US$100 million, or 4%, over 2012 levels. In general, funding has grown significantly over the past decade, increasing from US$871 million in 2005 to US$2,581 million in 2013, a three-fold increase. In recent years, however, increases have been much smaller: between 2005 and 2009, funding increased by US$1.39 billion, compared to an increase of US$0.31 billion between 2009 and 2013 (see Figure 2).[endnote 137075-5]
Most of the growth since 2005 can be attributed to the Global Fund, first created in 2002 and which quickly has grown to become the single largest source of malaria funding in the world, and to funding from the U.S. government; the Global Fund accounted for 43% of the growth over the period and the U.S. accounted for 33%. Combined funding increases from all other sources accounted for 24% of the growth over the period. As a result, the combined share of total resources provided by the Global Fund and the U.S. has increased, rising from 48% in 2005 (35% from the Global Fund and 13% from U.S.) to 67% in 2013 (40% from the Global Fund and 26% from the U.S.) (see Figure 3).
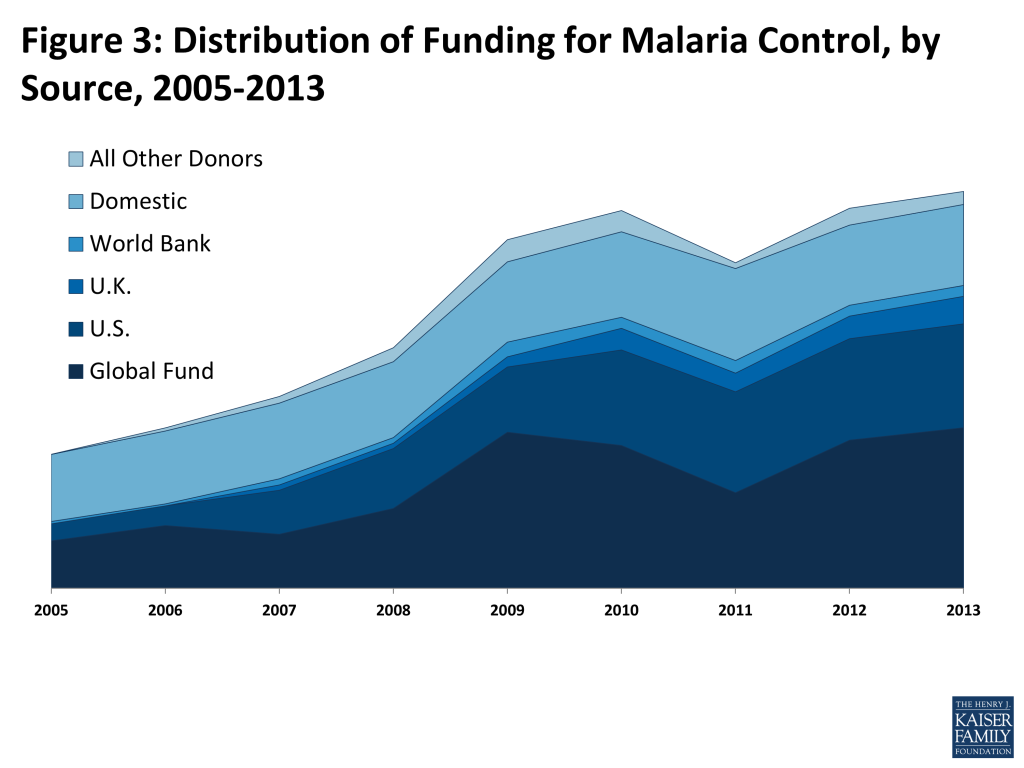
While domestic funding demonstrated an overall increase between 2005 and 2013 (rising from US$436 million in 2005 to US$527 million in 2013), it has declined in recent years from its peak of US$598 million in 2011. Additionally, it has declined as a share of total resources from 50% in 2005 to 20% in 2013 as funding provided by the U.S. and the Global Fund has risen faster. Funding from the U.K. rose from US$35 million in 200717 to an estimated US$179 million in 2013, while funding from the World Bank grew from US$15 million in 2005 to a peak level of US$95 million in 2009 and has since declined to an estimated US$71 million in 2013.
Global Funding for Malaria R&D
According to data from Policy Cures, total funding for malaria research and development activities in 2013 was estimated to be US$549 million, a decrease of US$38 million compared to 2012 levels (US$587 million) and was at its lowest level of funding since 2010 (see Figure 4).[endnote 137075-7]
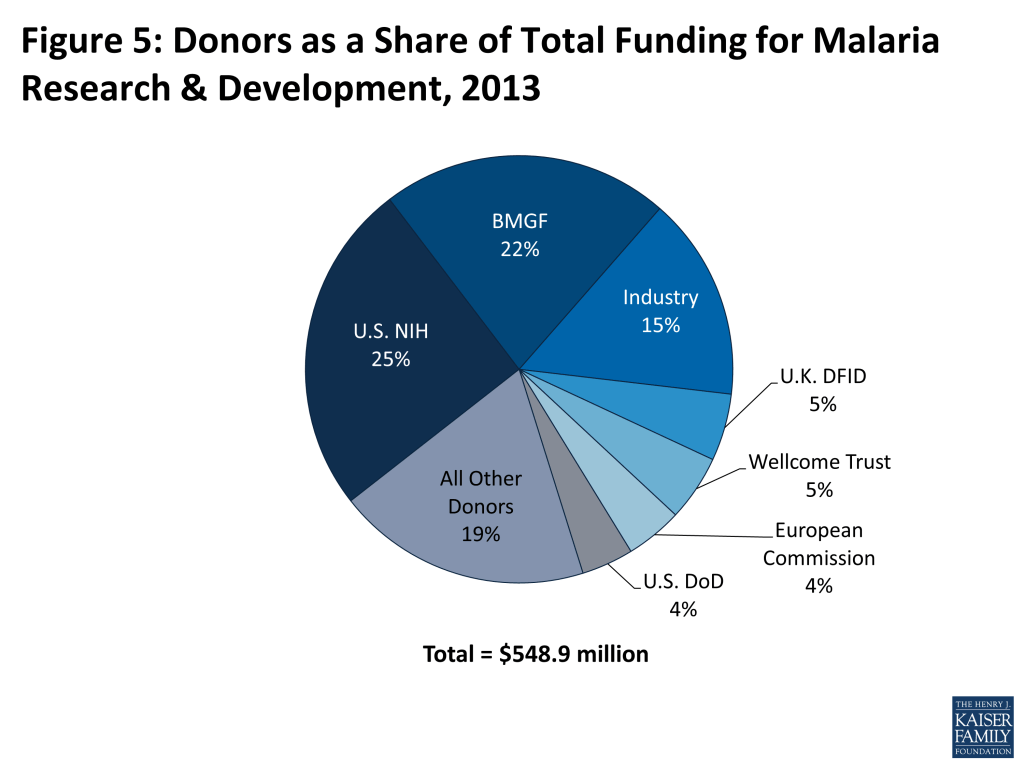
The NIH accounted for the largest share (25%) of malaria research and development funding in 2013, followed by the Gates Foundation (22%) [the Gates Foundation also provides other funding for malaria (see Box 3)]. The third largest source of funding for malaria R&D is the pharmaceutical and biotechnology industry (15%), followed by DFID (5%), and the Wellcome Trust (5%), a charitable organization in the U.K. that supports biomedical research and the medical humanities (see Figure 5).
Box 3: The Bill & Melinda Gates Foundation
The Gates Foundation, founded in 2000, has grown to become a major funder of global health efforts and provides significant resources to support malaria control and eradication as well as R&D. We obtained data directly from the Foundation to estimate its total funding for malaria over time.
- Cumulatively, the Gates Foundation has provided close to $2 billion between 2001 and 2013 for malaria efforts, not including contributions to the Global Fund (which supports HIV, TB, and malaria).
- Funding in 2013 from the Gates Foundation reached US$192 million for combined malaria control and R&D efforts, which makes it one of the largest donors to malaria. The Foundation recently announced that it would be increasing its malaria spending by 30%.
Note: Gates Foundation data include funding for both malaria control and elimination and R&D activities (due to differences in reporting methodologies, the data presented here should not be used in conjunction with G-FINDER data to estimate Gates Foundation contributions to malaria control activities). Data do not include the Foundation’s contributions to the Global Fund which may in turn be used for malaria activities. See Methodology for additional information.–Sources: Analysis of data provided by the Gates Foundation; Bill & Melinda Gates Foundation, Gates Foundation Commits More than $500 Million to Tackle The Burden of Infectious Disease in Developing Countries, November 2014.
Global Funding Gap & Looking Ahead
Despite significant increases over the past decade, total funding for malaria control activities in 2013 was significantly below the GMAP’s estimated annual need of US$5.1 billion. Similarly, support for malaria R&D programs was also below the estimated annual need (US$750-900 million).18
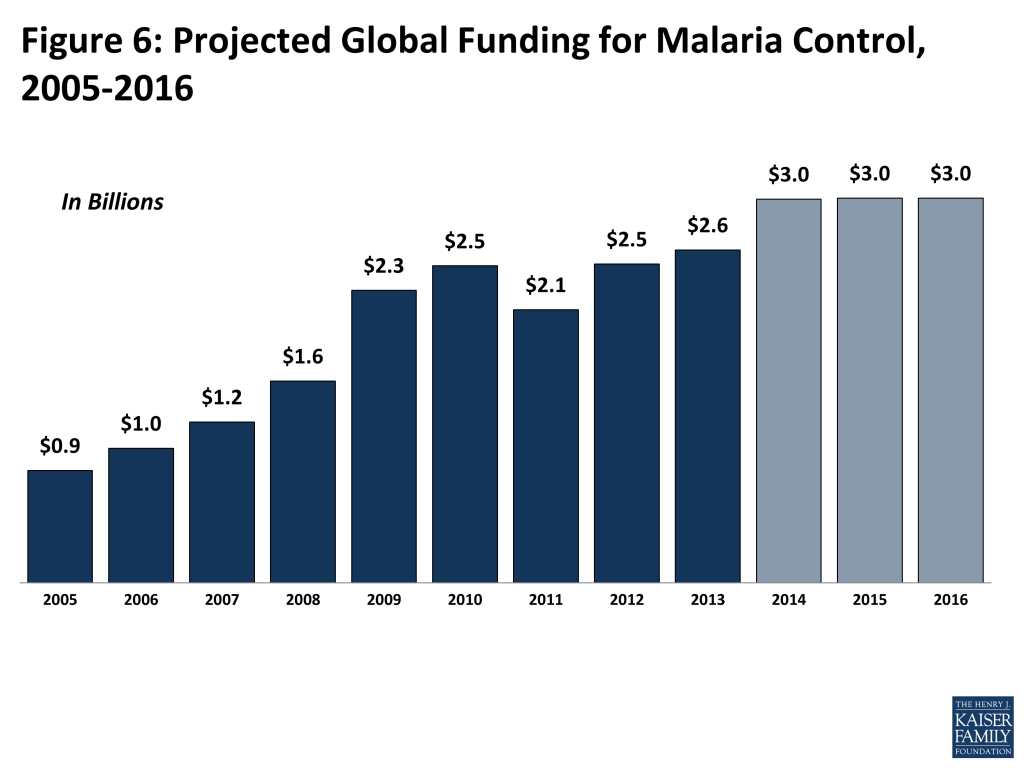
While future funding levels for malaria control activities beyond 2013 are not yet known for all funding sources, projected data are available from the U.S. and the Global Fund, the two largest funders of malaria efforts. Both are projected to increase their funding in the next several years. The Global Fund has already allocated approximately US$4.3 billion for malaria in the period between 2014 and 2016 (US$1.4 billion annually), which would be a nearly US$400 million increase above 2013 levels.19 U.S. bilateral funding is projected to increase to US$693 million in 2014 (an $18 million increase), and US$701 in 2015 (an $8 million increase above 2014 levels).20 Based on these increases, and assuming funding from all other sources remains flat, total funding for malaria control would rise to US$3.0 billion in each year between 2014 and 2016 (see Figure 6). This would still leave a gap of US$2.1 billion. In fact, even if all other donors doubled their funding for malaria, there would still be a gap.
While projected funding levels are not available for malaria R&D activities, if the funding declines of the past two years continue, the gap between estimated need and available resources will increase.
Separately, in its 2014 World Malaria Report, WHO has made future projections of malaria funding under two longer-term funding scenarios for 2020.21 The first scenario projects what would happen if malaria funding increased at the same rate as overall government expenditures are projected to increase. The second scenario adds to the first by projecting additional gains that would occur if donor governments met the official development assistance (ODA) target of 0.7% of Gross National Income, a global target first pledged by the United Nations General Assembly in 1970 and reaffirmed at subsequent international meetings.22 Despite these scenarios leading to increased funding for malaria, neither reaches the $5.1 billion estimated need. Scenario 1 results in a total funding estimate of US$3.8 billion in 2020 and Scenario 2 results in US$4.3 billion.
Report: Conclusion
Despite significant increases over the past decade, total funding for malaria control activities is significantly below the GMAP’s estimated annual need of US$5.1 billion. Similarly, support for malaria R&D programs was also below the estimated annual need (US$750-900 million).23 Projected funding levels, while increasing under different scenarios, also fall short of estimated need. Taken together, these findings raise significant questions and uncertainties about global malaria control and elimination efforts. As the global community meets to decide on updated malaria control targets and funding needs, it will be critical to assess where resources are likely to come from. First, unless significant additional resources are provided, this gap cannot be filled. Further, it is unclear where such resources could come from – beyond the U.S. and the Global Fund, other funding sources combined only account for about a third of total funding; they would have to more than double their share to fill the gap. Lastly, the concentration of funding from the U.S. and the Global Fund makes future funding highly dependent on, and therefore vulnerable to, their future funding trajectories. Unless significant additional resources are provided, this gap cannot be filled and it is unclear what this will mean for reaching global malaria targets and truly having a long lasting and deep impact on this disease.
Methodology
This report analyzes funding data for malaria control and elimination activities as well as R&D. All data are expressed in current (nominal) US dollars.
Malaria Control and Elimination. Funding data for malaria control and elimination activities were obtained from multiple sources including: the U.S. government; the Global Fund’s grant portfolio database; the WHO’s World Malaria Report 2014; and the OECD DAC Creditor Reporting System (CRS) database.
All funding data for malaria control and elimination activities represent disbursements, with the exception of U.S., which represents enacted funding amounts. A disbursement is the actual release of funds to, or the purchase of goods or services for, a recipient. Enacted amounts represent budgetary decisions that funding will be provided, regardless of the time at which actual outlays, or disbursements, occur. Data attributed to a donor include any earmarked (malaria-designated) amount, including earmarked contributions to multilateral initiatives such as the AMfm. Data do not include un-earmarked, general contributions to multilateral organizations, such as the United Nations or World Bank, which may in turn be used for malaria activities and are therefore attributed to the multilateral organization itself.
U.S. data include funding from the U.S. Agency for International Development (USAID), the Centers for Disease Control and Prevention (CDC), and the Department of Defense (DoD) and were obtained from the President’s FY 2015 budget request, Congressional appropriations bills and conference reports, federal agency budget and Congressional Justification (CJ) documents and operational plans, ForeignAssistance.gov (http://www.foreignassistance.gov/web/default.aspx), and through direct communication with the agencies and confirmed by the White House Office of Management and Budget (OMB). All U.S. totals represent funding for the specified fiscal year (the U.S. fiscal year runs from October 1-September 30). U.S. data for 2005 through 2014 are final funding levels. U.S. funding for 2015 was not yet finalized at the time of publication; U.S. data for 2015 are based on the President’s Budget Request.
Global Fund data for 2005 through 2013 were obtained from the Global Fund’s disbursement database (http://web-api.theglobalfund.org/) and represent funding provided during the calendar year (January 1-December 31). Projected funding levels for 2014 through 2016 are based on Global Fund reported planned allocations levels (http://www.theglobalfund.org/en/fundingmodel/allocationprocess/). It is important to note that actual allocations may differ due to final recipient country allocations across the three diseases.
Data for domestic resources were obtained from the WHO World Malaria Report 2014 (WMR). Domestic resources are based on financing data from national malaria control programmes (NMCPs).
Data were obtained from the OECD CRS database (http://stats.oecd.org/Index.aspx?datasetcode=CRS1) for the following donors: Australia, Austria, Belgium, Canada, Finland, France, Germany, Greece, Ireland, Italy, Japan, Korea, Luxembourg, Netherlands, New Zealand, Norway, Portugal, Spain, Switzerland, the United Kingdom, the European Commission (EC), the United Nations Children’s Fund (UNICEF), the World Bank, Kuwait, and the United Arab Emirates (UAE). The CRS database is based on the calendar year (January 1-December 31) and includes data through the 2012, the most recent year of available data. With the exception of the U.K., data for 2013-2016 for these donors assumes flat funding (excluding the U.K., these donors together accounted for approximately 7% of total malaria funding in 2012). In the case of the U.K., 2013 totals represent projected increases based on prior trends and official government documents; 2014 and 2015 totals assume flat funding.24 ,25
Research and Development: Data for R&D were obtained via special data request from Policy Cures, an independent research organization that has been tracking funding for global health research and development activities since 2007. This source was used because it is more comprehensive than the OECD CRS database, which does not include all donor funding for research and development activities, nor does it include funding from the private sector. R&D funding amounts included in this report are presented in nominal dollars and therefore, will not match data presented in Policy Cures’ annual G-FINDER Report and online database, which are presented in real (inflation adjusted) dollars.26
Gates Foundation: Data from the Gates Foundation were obtained through direct communication with the organization and include funding for both malaria control and research and development activities. Data for 2001 through 2008 are based on Gates Foundation internal reporting methodologies, while data for 2009 through 2013 are based on funding amounts reported by the Gates Foundation to the International Aid Transparency Initiative (IATI). Data do not include Gates Foundation’s contributions to the Global Fund which may in turn be used for malaria activities. In addition, data totals cannot be disaggregated into separate malaria control and elimination and R&D amounts, and due to differences in reporting methodologies, are not directly comparable to the data provided by Policy Cures on R&D activities.
Appendix
| Global Funding for Malaria Control, 2005-2013 | |||||||||
| Source | 2005 | 2006 | 2007 | 2008 | 2009 | 2010 | 2011 | 2012 | 2013 |
| Global Fund | $308.2 | $407.8 | $350.9 | $518.7 | $1,014.0 | $928.0 | $620.9 | $962.6 | $1,043.4 |
| United States | $110.4 | $127.6 | $285.9 | $389.3 | $424.0 | $620.8 | $655.5 | $659.3 | $675.0 |
| Domestic Resources | $435.7 | $473.6 | $491.6 | $493.1 | $521.8 | $555.6 | $597.9 | $520.9 | $526.5 |
| United Kingdom | – | – | $34.5 | $34.0 | $66.0 | $140.6 | $121.3 | $146.7 | $178.8 |
| World Bank | $15.4 | $12.8 | $40.0 | $37.0 | $95.5 | $71.7 | $82.1 | $70.6 | $70.6 |
| All Other Sources | $1.0 | $20.5 | $43.4 | $90.7 | $143.9 | $138.1 | $37.4 | $109.5 | $84.5 |
| Total | $870.6 | $1,042.3 | $1,246.3 | $1,562.9 | $2,265.2 | $2,454.6 | $2,115.1 | $2,469.5 | $2,578.8 |
| NOTES: “Domestic Resources” represents funding provided by malaria-affected countries. “All Other Sources” includes funding from all other donor governments and multilateral organizations not listed separately, and is based on analysis of their data reported to the OECD-DAC and of Global Fund reported contributions to the Affordable Medicines Facility-malaria (AMFm). The U.K. reported malaria funding to the OECD DAC for the first time in 2007. Decreased funding in 2011 was primarily due to a decline in disbursements from the Global Fund.SOURCES: Kaiser Family Foundation analysis of data from: the U.S. government; Global Fund to Fight AIDS, Tuberculosis and Malaria online data queries; OECD CRS online data queries; and WHO World Malaria Report 2014. See methodology for additional information. | |||||||||
Endnotes
- WHO. World Malaria Report 2013, December 2013. ↩︎
- WHO, Fifty-Eighth World Health Assembly: Resolutions and Decisions Annex, May 2005. ↩︎
- Roll Back Malaria, The Global Malaria Action Plan: For a malaria-free world, September 2008. ↩︎
- Roll Back Malaria, Refined/Updated GMAP Objectives, Targets, Milestones and Priorities Beyond 2011, June 2011. ↩︎
- Roll Back Malaria, The Global Malaria Action Plan: For a malaria-free world, September 2008. ↩︎
- Roll Back Malaria, The Second Global Malaria Action Plan (GMAP2), (see: http://www.gmap2.org/english/home). ↩︎
- WHO, Global technical strategy for malaria (2016-2030), (see: http://www.who.int/malaria/areas/global_technical_strategy/en/). ↩︎
- WHO. World Malaria Report 2013, December 2013. ↩︎
- WHO, Fifty-Eighth World Health Assembly: Resolutions and Decisions Annex, May 2005. ↩︎
- Roll Back Malaria, The Global Malaria Action Plan: For a malaria-free world, September 2008. ↩︎
- Roll Back Malaria, Refined/Updated GMAP Objectives, Targets, Milestones and Priorities Beyond 2011, June 2011. ↩︎
- Roll Back Malaria, The Global Malaria Action Plan: For a malaria-free world, September 2008. ↩︎
- Roll Back Malaria, The Global Malaria Action Plan: For a malaria-free world, September 2008. ↩︎
- Roll Back Malaria, The Second Global Malaria Action Plan (GMAP2), (see: http://www.gmap2.org/english/home). ↩︎
- WHO, Global technical strategy for malaria (2016-2030), (see: http://www.who.int/malaria/areas/global_technical_strategy/en/). ↩︎
- The U.S. is also the single largest donor to the Global Fund, but contributions to the Global Fund are in turn used by the Global Fund to support HIV, TB, and malaria efforts. U.S. funding totals for malaria, therefore, do not include contributions to the Global Fund. See Methodology for additional information. ↩︎
- The U.K. reported malaria funding to the OECD DAC for the first time in 2007. ↩︎
- Roll Back Malaria, The Global Malaria Action Plan: For a malaria-free world, September 2008. ↩︎
- These figures are based on Global Fund planned allocations but actual disbursement rates may vary and are also dependent on recipient country allocation decisions. For example, as of December 4, the Global Fund had disbursed US$714 million for malaria efforts for the year, below the planning annual average of $1.4 billion. ↩︎
- For the U.S., 2014 amounts are final funding levels, 2015 is based on the President’s Budget Request, and 2016 assumes the same level of funding as 2015. ↩︎
- WHO, World Malaria Report 2014, December 2014. ↩︎
- United Nations, Resolution adopted by the General Assembly: 2626 (XXV). International Development Strategy for the Second United Nations Development Decade, October 1970. ↩︎
- Roll Back Malaria, The Global Malaria Action Plan: For a malaria-free world, September 2008. ↩︎
- WHO, World Malaria Report 2014, December 2014. ↩︎
- U.K. National Audit Office, Department of International Development, July 2013. ↩︎
- Policy Cures, Neglected disease research and development: Emerging trends, December 2014. ↩︎