Payment and Delivery System Reform in Medicare: A Primer on Medical Homes, Accountable Care Organizations, and Bundled Payments
Introduction
Policymakers, health care providers, and policy analysts continue to call for “delivery system reform”—changes to the way health care is provided and paid for in the United States—to address concerns about rising costs, quality of care, and inefficient spending. The Affordable Care Act (ACA) established several initiatives to identify and test new health care payment models that focus on these issues. Many of these ACA programs apply specifically to Medicare, the social insurance program that provides coverage to 57 million Americans age 65 and older and younger adults with permanent disabilities.
This Primer describes the framework and concepts of three payment models that CMS is currently testing and implementing within traditional Medicare—medical homes, ACOs, and bundled payments. Combined, these three models account for care provided to over 10 million Medicare beneficiaries and are frequently cited by media, researchers, and policymakers as current examples of ongoing delivery system reforms. Within each of these three broad models, the Centers for Medicare and Medicaid Services (CMS) is testing a variety of individual payment approaches and program structures. This Primer reviews each of the models, including their goals, financial incentives, size (number of participating providers and beneficiaries affected), and potential beneficiary implications. It also summarizes early results with respect to Medicare savings and quality.
Preliminary results from these models are somewhat mixed at this point, with some models showing more promise than others. This might be expected given their early stages, the diverse number of approaches being implemented, and methodological challenges associated with calculating savings. Many of the models are meeting quality targets and showing improvements in quality of care, but to date, overall net savings to Medicare are relatively modest, with large variation between models as well as among the individual programs running within them. More results are expected to be released in the future, and new models launched in 2016—several of which are designed to address issues raised by stakeholders with respect to the initial model designs.
Looking ahead, as more results become available, a key question is how Medicare patients fare in these delivery system reform models, especially those with the greatest health care needs. The answer, along with performance on overall spending and quality, will help policymakers identify which models to pursue or discard, which to alter, and what might be needed to disseminate successful models more broadly.
Executive Summary
The Affordable Care Act (ACA) established several initiatives to identify new payment approaches for health care that could lead to slower spending growth and improvements in the quality of care. Many of these new delivery system reforms are currently being implemented and tested in traditional Medicare. This Primer describes the framework and concepts of three broad alternative payment models—medical homes, ACOs, and bundled payments—and reviews their goals, financial incentives, size (number of participating providers and beneficiaries affected), and potential beneficiary implications. It also summarizes early results with respect to Medicare savings and quality.
Context for Delivery System Reform in Medicare
Delivery system reform in Medicare focuses on shifting a portion of traditional Medicare payments from fee-for-service (FFS) (which reimburses based on the number of services provided) to payment systems that incorporate some link to the “value” of care as determined by selected metrics, such as patient outcomes and Medicare spending. The Department of Health and Human Services has announced a goal to have 90 percent of traditional Medicare payments linked to quality or value by 2018.1 The agency also reports that it has met its goal of having 30 percent of Medicare payments tied specifically to alternative payment models (such as Accountable Care Organizations (ACOs), bundled payments, and medical homes) by the end of 2016, and expects to reach 50 percent by the end of 2018.2 Additionally, recent legislation to reform Medicare payments for physician services, the Medicare Access and CHIP Reauthorization Act (MACRA), includes bonus payments for physicians and other health professionals who participate in qualifying alternative payment models.3
To establish a central place for designing, launching, and testing new payment models, the ACA created the Center for Medicare and Medicaid Innovation (CMMI), also referred to as the “Innovation Center,” housed within CMS. The ACA granted CMMI wide authority to design and test new models that aim to either lower spending without reducing the quality of care, or improve the quality of care without increasing spending.4 The intent of designing and launching multiple new models is that the cream of all of these approaches will rise to the top, providing direction as to what works and what does not—so best practices can be quickly disseminated across the country. In fact, the ACA gives CMMI unprecedented authority to expand models across the U.S. when they are found to be successful.
Medical Homes, ACOs, and Bundled Payments
Medical homes, ACOs, and bundled payment models, combined, account for care provided to over 10 million Medicare beneficiaries5 and are frequently cited by media, researchers, and policymakers as major examples of delivery system reforms implemented widely across the U.S.6 These models are described briefly below:
- Medical homes are team-based models of patient care that rely heavily on the primary care practice (provider and care team) as the main and central source for delivery and coordination of the majority of health, illness, and wellness care for Medicare beneficiaries. Health insurers that support the medical home model typically provide monthly care management fees or other payments in addition to fee-for-service reimbursement for activities related to patient care and coordination.
- ACOs are groups of doctors, hospitals, and other health care providers who agree to share collective accountability for the quality and cost of care delivered to the patients attributed to their ACO. Payments to ACOs incorporate varying levels of financial incentives in the form of shared savings or losses (sometimes referred to as bonuses or penalties) for performance on identified spending and quality metrics.
- Bundled payments focus on discrete episodes of care by establishing an overall budget for services provided to a patient receiving a course of treatment for a given clinical condition over a defined period of time. In contrast to paying for each service individually, bundled payments provide incentives for providers to come in “under budget” for episodes of care.
Within each of these three delivery system reforms, CMS is managing the implementation and assessment of multiple payment models (Table 1).
| Table 1: Medical Homes, Accountable Care Organizations (ACOs), and Bundled Payment Models | |
| Delivery System Reform | CMS/CMMI Models |
| Medical Homes (Advanced Primary Care) |
|
| Accountable Care Organizations (ACOs) |
|
| Bundled Payment |
|
| NOTE: Centers for Medicare and Medicaid Services (CMS); Center for Medicare and Medicaid Innovation (CMMI). All programs listed above are managed by CMMI, with the exception of the MSSP. *The FQHC/APCP model ended in October 2014. | |
Ongoing Evaluation of these Models and Programs
The ACA requires that each model managed by CMMI be evaluated for changes in both spending and quality of care provided.7 In fact, the ACA incorporates assessments of both quality and cost in the criteria for granting the Secretary of Health and Human Services the authority to expand models nationally if they either reduce spending without reducing the quality of care or improve the quality of care without increasing spending.8
By working with many types of providers who are treating a variety of patients in various kinds of facilities, CMMI is evaluating cost and quality not just for the models overall, but also how these results may differ based on other variables, such as patient and provider characteristics. CMS is also examining the attractiveness of the models to providers based on model participation rates, feedback from participants regarding the process (challenges, barriers, success strategies, etc.), and other operational, quantitative, and qualitative measures.
Preliminary results from these models are modest and mixed at this point, with some models showing more promise than others (Table 2). This might be expected given their early stages, the diverse number of approaches being implemented, and methodological challenges associated with calculating savings. Many of the models are meeting quality targets and showing improvements in quality of care, but to date, overall net savings to Medicare are relatively modest, with large variation between models as well as among the individual programs running within them. Given the difference in beneficiary counts, care models, and evaluation time periods for each model, it is difficult to compare the relative magnitude of savings among them.
| Table 2: Summary of Early Results for Medical Home, ACO, and Bundled Payment Models | |
| Delivery System Reform | CMS/CMMI Model Results |
| Medical Homes (Advanced Primary Care) |
|
| Accountable Care Organizations (ACOs) |
|
| Bundled Payments |
|
| SOURCES: Individual evaluation reports and CMS documentation are cited for each result in the next section of this Primer. | |
Implications for Medicare Beneficiaries
Questions about how beneficiaries are involved in these new payment approaches and the implications these models have on beneficiary care—particularly for those with multiple chronic conditions—are key issues, yet at this stage, the answers are not well understood. For the most part, Medicare beneficiaries in these models do not experience any changes in their Medicare benefits, as they are not required to see certain providers and do not experience differences in their levels of cost-sharing. Accordingly, even though beneficiaries are notified of their providers’ participation in these models, it is not clear that beneficiaries are aware of their “attribution” to them, nor the inherent implications of the model’s payment incentives for less costly care. Beneficiaries whose primary care provider is transforming their practice into a medical home may notice differences in the delivery of their care—for example, greater reliance on clinical teams and electronic health records—but for the ACO and bundled payment models, beneficiaries would not necessarily notice changes in care practices.
On the one hand, having Medicare attribute beneficiaries to these new delivery models is least disruptive to beneficiaries and places greater responsibility on the providers to engage with their patients and deliver better quality care. It is also less susceptible to selection issues, whereby beneficiaries with higher health costs may be somehow discouraged from enrolling in an ACO or medical home. On the other hand, some analysts propose that beneficiaries could play a greater role in lowering health care costs and improving quality if they took a more active role in selecting a medical home or ACO and encountered incentives to see providers affiliated with or recommended by their ACO or medical home, or if the providers did more to actively engage them. (CMS is exploring several of these approaches via new ACO models that started in 2016.)
Issues about directing patients to certain providers also play a role in bundled payment approaches. For example, when beneficiary and provider incentives are aligned, patients leaving the hospital may seek or receive recommendations for post-acute providers and settings that deliver high-quality care at relatively lower overall costs. However, other considerations, such as patient convenience and the absence of family caregiver support are factors that may play a far greater role in beneficiary preferences than provider interests. These issues highlight the need to monitor care provided to the vulnerable patients in these models of care and to institute patient protections if quality and access problems are found.
Looking Ahead
In traditional Medicare, delivery system reforms and alternative payment models are being implemented and tested to determine how they might encourage better care coordination for patients across settings—particularly for those patients with chronic conditions and high health care needs—while simultaneously reducing provider inefficiencies and potentially lowering costs (or cost growth) for Medicare. By design, these goals are intrinsic to these models, and stakeholders (including CMS, other payers, providers, patients/ consumers, and the Congress) naturally want to see real-world results from their investments as soon as possible. This pressure presents a clear tension between the desire for immediate results versus the time it takes to test fully-implemented interventions.
CMS’s commitment to “rapid cycle” improvements in the demonstrations means that CMS is able to refine the payment models as they are being implemented in light of early results and unforeseen circumstances.9 While potentially advantageous, tracking and monitoring the changes will be difficult, and designing evaluations that can hold constant all other factors, including site-specific variables, to determine definitively what works and what does not, presents methodological challenges.10 Additionally, the evaluation of medical homes, ACOs, and bundled payments are conducted separately, which may preclude assessing how they might work together in a coherent way.
CMMI has also launched a number of new models in 2016, several of which are designed to address issues raised by stakeholders with respect to the initial model offerings. For example, new ACO and bundled payment models, described later in this Primer, will provide advance payments to providers to address their concerns about start-up resources needed for transforming their patient care and business models. CMMI is also offering models that aim to inform and engage beneficiaries about the goals of the new payment approaches. Consumer involvement has not, as yet, been a major component of delivery system reform, particularly outside of medical home models. It will be helpful in future models to see how beneficiaries’ understanding of the models affects provider approaches, changes in service utilization, and patient outcomes. With increased beneficiary involvement also comes the need to incorporate appropriate measures for beneficiaries who have cognitive impairments.
Introducing delivery system reform in Medicare is an extremely ambitious effort and one that comes with a number of challenges. Health care is changing rapidly, and while it is difficult to guarantee a controlled experiment in which only the changes of interest (typically targeted payment incentives) are allowed to vary, understanding the ability of providers to lower costs while maintaining or improving quality may help illuminate the ingredients of success (or failure). Ultimately, a key consideration for CMS and Congress to track is how Medicare patients fare in these delivery system reform models, especially those with the greatest health care needs. This issue, along with overall spending and quality, will help policymakers identify which models to pursue, and what it will take to disseminate the most successful payment and delivery models more broadly.
Report
Medical Homes, Accountable Care Organizations (ACOs), and Bundled Payments: Descriptions and Summaries of Early Evidence
Medical Homes
What is a Medical Home?
The medical home—also called an advanced primary care practice model or a patient-centered medical home—is a team-based approach to patient care that is intended to provide comprehensive care and serve as the medical practice which provides for the majority of their patients’ health care needs.11 When seeking care, medical home patients either obtain care from their medical home directly, or the medical home coordinates their care with another provider. Overall management of care in a medical home is generally led by a primary care clinician—often a physician, but it may also be another health professional, such as a nurse practitioner.12 Health insurers that support the medical home model typically provide monthly care management fees or other resources to the practice to support certain activities. These include care management and coordination, communication with patients outside of office visits for acute, chronic, and preventive health care needs (including by email, internet “portals,” and telephone), and data collection for reporting patient outcomes and quality improvement. CMMI is supporting the transformation of primary care practices into medical homes through grant funding and technical assistance for several models. Among them, CMS has released results on savings and quality (detailed in Table 3) for the following four models located across the country (Figure 1):
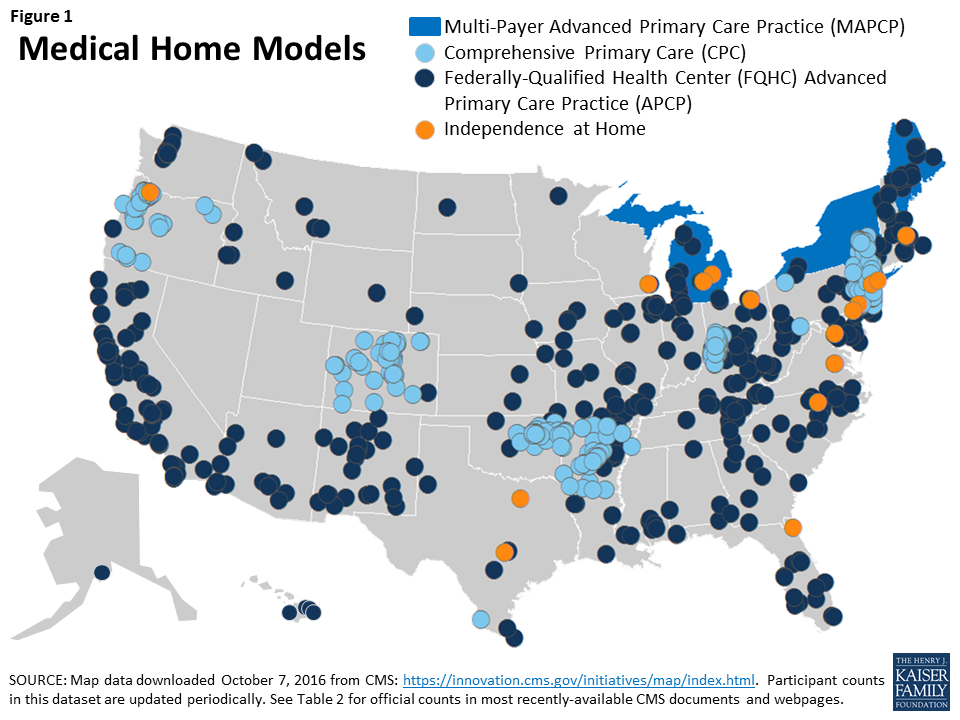
- Multi-Payer Advanced Primary Care Practice (MAPCP) – The MAPCP model tests if medical homes that receive monthly care management fees for most of their patients across multiple insurers (including but not limited to Medicare) perform better on quality and spending measures than either (a) medical homes without payer alignment of these fees (non-MAPCP medical homes); or (b) practices which are not medical homes. State agencies coordinate the medical practice requirements and monthly care management fees across Medicare, Medicaid, and commercial insurers.
- Comprehensive Primary Care (CPC) – Similar to the MAPCP model, the CPC model is also testing a multi-payer approach for medical homes. However, CMMI—rather than the state—is playing the major role in convening insurers to combine resources to provide care management fees to medical homes, provide data feedback on patient utilization, and implement quality and efficiency incentives that are aligned across all insurers. Participating payers provide practices with care management fees and an opportunity for regional shared savings. They also share data on cost and utilization to give practices information on their patients’ total spending.
- Federally-Qualified Health Center (FQHC) Advanced Primary Care Practice (APCP) – The FQHC/APCP model, which ended in 2014, tested effects on the cost and quality of care for Medicare beneficiaries served by FQHCs. Each participating FQHC was paid monthly care management fees per Medicare beneficiary to support services and activities associated with requirements for patient-centered medical homes. An additional goal of the FQHC/APCP model was to help FQHCs achieve recognition by the National Committee for Quality Assurance for as a “Level-3” medical home.
- Independence at Home (IAH) – The IAH model is testing effects on health outcomes and Medicare spending when primary care services are provided to chronically ill beneficiaries in their own homes. Although IAH practices have the same home visit coverage in traditional Medicare as other practices, IAH practices are uniquely eligible for incentive payments for meeting quality and spending targets. Unlike MAPCP and CPC, IAH providers are not paid monthly care management fees.
Conceptually, How Could Medical Homes Improve Quality and Reduce Costs?
The overarching goals of medical homes are to improve clinical outcomes and patient experience while reducing overall health costs through reductions in unnecessary and avoidable acute care services and long-term expenses associated with chronic illness and its complications. In fully implemented models, the medical home relies on several features: a care team (including clinicians, care managers and coordinators, social workers, and when applicable, pharmacists community health workers, and others); health information technology; standardized preventive and acute care consistent with evidence-based guidelines; patient and family engagement in care and medical decision-making; access to clinicians outside of regular office hours; and consideration of the whole patient, inclusive of social, mental, and behavioral health and other issues.13 This model presumes that in addition to better patient care, it costs less on the whole to provide patients with comprehensive primary care than it does to cover the health care costs of patients who seek specialty services without care management and coordination by their primary care provider.
How Do Medical Homes Differ from the Status Quo in Traditional Medicare?
Aside from the recently established chronic care management code, medical practices, in general, may not bill Medicare separately for many activities that are outside of the direct provision of face-to-face medical care.14 Such activities could include care coordination with external providers taking place between a patient’s visits, information technology enhancements, follow-up phone communications with patients, and after-hours clinical access. Three of the medical home models being tested (MAPCP, CPC, and FQHC/APCP) provide additional payments in the form of supplemental per member per month fees to primary care providers that are intended, in part, to offset the costs of these activities whether or not they are performed in the presence of the patient. Additional costs defrayed by these care management fees include staffing expenses and infrastructure costs needed to perform functions of, or be recognized as, a medical home.
How Are Medicare Beneficiaries Involved in Medical Home Models?
Approximately 1.4 million beneficiaries are attributed to one of the four CMMI models of medical homes described in Table 3. A core concept of the medical home model of care is that the beneficiary be actively engaged and involved in their care. While these medical home models have beneficiary satisfaction and engagement measures as part of their quality indicators, the degree to which patients themselves are educated about the medical home model and informed about their role and options is not clear and varies across models. Even less clear is how well beneficiaries understand the model, even after receiving these explanations. In general, providers do not enroll beneficiaries in the CMMI medical homes; instead, eligible beneficiaries in traditional Medicare are attributed through a claims-based process by CMS. Beneficiaries are notified by mail or by a posted notification within the practice that their primary care provider is part of a medical home model being tested by CMMI. This notification also explains that beneficiaries may opt out of having CMS share their Medicare utilization and spending data with the medical home. Consistent with traditional Medicare, beneficiaries are free to seek services from other Medicare providers such as specialists at any time and are not required to obtain care from the medical home to which they are attributed.
What Are Some of the Implications for Beneficiaries in Medical Homes?
Beneficiaries whose primary care providers are converting to medical homes may encounter new care models that include greater reliance on clinical teams and electronic health records—which may or may not be features beneficiaries desire—and enhanced access to clinicians outside of office visits and after regular business hours. Patients with higher health risks are considered key targets for care management in medical homes, so patients with multiple chronic conditions may receive more frequent contact from their primary care practice to encourage them to maintain prescribed treatment protocols and to monitor their health. Beneficiaries in the IAH model are able to stay home to receive primary care services. While beneficiaries in medical homes may be receiving more advanced primary care services, this emphasis could possibly translate to the beneficiary as reluctance from their primary care providers to make referrals to specialists.
What Are Some of the Implementation Challenges with Medical Homes?
Implementation of the medical home model presents many practical challenges for both the primary care clinicians in medical homes and researchers examining their impact on care quality and spending. The key elements of the medical home—including expanded patient access, acute and preventive care management, and adoption of health information technology—represent changes to the process and design of current primary care practice. Accordingly, organizational and financial hurdles may surface when trying to transform practices into medical homes.15 Further, providers in medical homes report operational problems stemming from the lack of incentives for external providers and systems to interact with medical homes, minimal mechanisms for physicians to share in overall savings in certain models, and insufficient resources to hire additional staff and purchase infrastructure (such as electronic health record systems), particularly for models with little or no monthly care management fee structures.16
Medical home providers have also noted that beneficiaries do not have financial incentives to consult with their medical home prior to seeking specialty care or going to a hospital emergency department. Health services researchers face significant challenges evaluating the impact of medical home interventions on clinical outcomes, due to the variability in how these models are being implemented across the many sites involved, and the rapid cycle manner of continuously adapting and modifying interventions based on real-time feedback in the field. Additionally, there may be some self-selection issues among primary care practices that voluntarily joined the CMMI models, raising the potential for greater challenges with dissemination across primary care practices that may be less interested in the medical home model of care.
What Early Results Are Available for the Medical Home Models?
Early results from CMMI’s medical home and advanced primary care models are mixed (Table 3). In the MAPCP model, one state (Michigan) out of eight achieved savings over the first two years, net of care management fees. The CPC model almost broke even after care management fees, and the FQHC/APCP models experienced comparatively greater net losses, on average. In contrast, the IAH model, which focuses on providing care to chronically ill Medicare patients in their own homes, showed savings—over $25 million in its first year and over $10 million in its second year.17 Unlike the other medical home models, the IAH model does not pay monthly care management fees to providers. Given the difference in beneficiary counts for each medical home model, it is difficult to compare the relative magnitude of savings among the different models.
With respect to quality, evaluation results across the medical home models have found some improvement, but generally minimal effects across most measures. For the CPC model, patient-reported measures on their experience with the practice improved slightly more for CPC practices than for comparison groups, as did performance on quality measures for diabetes care. CMS also reports that for 2015, CPC quality scores improved overall compared to 2014. For the FQHC/APCP model, little difference was noted on quality measures between FQHCs that were participating in the medical home model and those that were not, and FQHCs had higher rates of emergency room visits compared to non-medical home FQHCs. In the first year of the IAH model, all 17 participating practices (including one consortium) met quality goals on at least three or six quality measures, such as lower hospital readmissions and greater follow-up contact between the patient and the provider after a hospital or emergency department discharge. In the second year, all 15 participating IAH practices further improved on at least two of six quality measures, and four practices met goals for all six quality measures.
| Table 3: Medical Home Models in Medicare (Active in 2014 and 2015) | ||||
| Multi-Payer Advanced Primary Care Practice (MAPCP) | Comprehensive Primary Care (CPC) | Federally-Qualified Health Center (FQHC) Advanced Primary Care Practice (APCP) | Independence at Home (IAH) | |
| Description of Model; what is being tested | The MAPCP model is testing if medical homes that receive monthly care management fees for most of their patients, across multiple insurers, perform better on quality and spending measures than either (a) medical homes without payer alignment of these fees; or (b) practices which are not medical homes. State agencies coordinate the medical practice requirements and monthly care management fees across Medicare, Medicaid, and commercial insurers. | The CPC model is also testing a multi-payer approach for medical homes. Unlike the MAPCP model, CMMI—rather than the state—is convening insurers to combine resources to provide care management fees to medical homes and technical assistance and data feedback on patients’ total cost and utilization to practices. Quality and efficiency incentives are aligned across all insurers. | The FQHC/APCP model is testing effects on patient care and costs of care for Medicare beneficiaries served by FQHCs. Each participating FQHC was paid monthly care management fees per Medicare beneficiary to support services and activities associated with requirements for patient-centered medical homes. | The IAH model is testing effects on health outcomes and Medicare spending when primary care practices, which focus on providing services to chronically ill beneficiaries in their own homes, are able to share in financial savings if they meet specified quality and spending targets. Unlike the MAPCP and CPC models, IAH providers are not paid monthly care management fees. |
| Start date/ End date | Start date7/2011 (initial cohort) | Start date10/2012 (initial cohort) | Start date11/2011 | Start date6/2012 |
| End dateInitially, MAPCP was a 3-year demonstration but was extended through 2016 for 5 of 8 states | End dateExpected to end 12/2016 | End date10/2014 | End dateInitially, IAH was a 3-year model, but was extended by Congress for all participants an additional 2 years into 2017 | |
| Num./type of participants | 5 states participating (as of 10/2016)b | 481 primary care practices participating (as of 12/2015)c | 434 FQHCs (as of 10/2014)d | 13 home-based primary care practices and 1 consortium (as of 8/2016)e |
| Num. Medicare beneficiaries | Over 900,000 beneficiaries at the end of year 3b | Over 376,000 Medicare beneficiaries (as of 12/2015)c | 195,000 beneficiaries (as of 10/2014)d | Over 8,400 in Year 1fOver 10,000 in Year 2j |
| States with participants | ME, MI, MN, NC, NY, PA, RI, VT (original 3 years);ME, MI, NY, RI, VT (extended through 2016) | AR, CO, NJ, OR, and specified regions of NY, KY/OH, OK (as of 1/2016) | All states and DC, except DE, NV, UT, and VT (as of 10/2014) | DE, DC, FL, MA, MI, NY, NC, OH, OR, PA, TX, VA, WI (as of 1/2016) |
| Payment arrangements | Care management feesMedical homes in MAPCP models receive Medicare care management fees of about $10 per beneficiary per month, varying by state, in addition to fees paid by other insurers. The care management fees are paid in addition to regular fee-schedule payments in traditional Medicare. | Care management feesMedical homes in CPC models receive an average of $18-20 per beneficiary per month from Medicare in years 1 and 2 (decreasing to $15 in years 3 and 4), in addition to fees paid by other insurers. Like the MAPCP, these care management fees are on top of regular Medicare fee-schedule payments. | Care management feesFQHCs received Medicare care management fees of $18 per beneficiary per quarter, in addition to payments received for Medicare services rendered. | Care management feesIAH practices do not receive any care management fees. |
| Other payments and financial incentivesMedical homes may receive additional payments for meeting medical home accreditation. Medicare payments in some states may support community health teams and state’s operational expenses for the MAPCP. In PA, medical homes can share in savings. | Other payments and financial incentivesCPC practices can share in financial savings to Medicare, based on (a) risk-adjusted, practice-level performance on quality and patient experience measures; and (b) regional (market-level) utilization measures. | Other payments and financial incentivesFQHCs received financial support from the Health Resources and Services Administration (HRSA) to help with costs associated with becoming a medical home. | Other payments and financial incentivesIAH practices share savings when at least 3 of 6 quality standards and reducing total costs based on projected FFS expenditures. | |
| Early results | SavingsIn the first two years of MAPCP, 6 of 8 states had savings net of care management fees, but savings were only significant in one state (Michigan). At $336 million, these savings were considerably larger than in the other states.a | Savings In the first three years, CPC did not yield total net savings to Medicare when factoring in expenditures on care management fees.c, g In year 2, CPC practices lowered gross Medicare spending on services (by $11 on average per beneficiary; $91.6 million cumulatively) but Medicare expenditures on care management fees exceeded these savings (averaging $18 per beneficiary; cumulative amount unreported).g In year 3, CPC produced $57.7 million in gross savings, but spent $58 million in care management fees.c | SavingsIn a little more than the first two years (9 quarters) the FQHC/APCPs did not achieve savings, relative to FQHCs not participating in the APCP medical home model. A final evaluation is pending.h | SavingsIn the first year, the IAH model produced net Medicare savings totaling over $25 million. CMS paid no care management fees.f, i–In the second year, the IAH model produced net Medicare savings totaling over $10 million.j |
| QualityAcross the first two years, there were few significant differences in quality between MAPCP medical homes and non-MAPCP. On process measures (e.g., diabetes tests, screenings), results showed measure-by-measure and state-by-state variation in MAPCP performance. On preventable hospitalizations and composite prevention scores, most states had no significant differences between their MAPCP and control group.a | QualityAcross the first two years, patient-reported experience measures improved slightly more for CPC practices than for comparison groups, as did performance on quality measures for diabetes care. In the third year (2015), CMS states that CPC practices demonstrated lower than expected hospital admissions and readmission rates, and favorable performance on patient experience measures.c | QualityOn most quality measure categories (40 of 46), participating (medical home) FQHCs did not perform better than non-participating FQHCs and had higher Medicare utilization and rates of emergency room visits among its Medicare beneficiaries.h | Quality In the first year, all IAH practices met quality goals on at least 3 of 6 designated measures. On average, IAHs had fewer hospital readmissions and met quality standards for follow-up and medication management after hospital discharges, and lower rates of hospital use for certain chronic conditions.fIn the second year, all practices further improved on at least 2 of 6 quality measures; 4 practices met goals for all 6 quality measures.k | |
| ParticipationNo participants discontinued during initial study period; 6 of 8 states were offered opportunity to continue after 2014, of which 5 elected to extend through 2016.a | ParticipationParticipation decreased from 502 practices in the first year to 481 in 2015. 2 of 31 insurers discontinued participation in 2013, with no change in 2014.c, g | ParticipationThe number of FQHC medical homes decreased from 500 to 434.j | ParticipationParticipation decreased from 17 practices in year 1 to 15 practices in year 2.f, k | |
| Evaluation contractor/ Most recent report | RTI International: Evaluation of the Multi-Payer Advanced Primary Care Practice (MAPCP) Demonstration: Second Annual Report (April 2016) | Mathematica Policy Research: Evaluation of the Comprehensive Primary Care Initiative: Second Annual Report (April 2016) | RAND Corporation: Evaluation of CMS’ FQHC APCP Demonstration (July 2015) | Mathematica Policy Research (no released report) |
| SOURCES:–a Evaluation of the Multi-Payer Advanced Primary Care Practice (MAPCP) Demonstration, Second Annual Report, RTI International and The Urban Institute, April 2016, available at https://downloads.cms.gov/files/cmmi/mapcp-secondevalrpt.pdf.–b Center for Medicare and Medicaid Innovation, “Multi-Payer Advanced Primary Care Practice, updated May 2016, accessed October 2016, http://innovation.cms.gov/initiatives/Multi-Payer-Advanced-Primary-Care-Practice/.–c Conway, P., “Medicare’s investment in primary care shows progress,” CMS Blog, October 17, 2016, https://blog.cms.gov/2016/10/17/medicares-investment-in-primary-care-shows-progress/.–d Center for Medicare and Medicaid Innovation, “FQHC Advanced Primary Care Practice Demonstration, updated December 2015, accessed January 2016, https://innovation.cms.gov/initiatives/FQHCs/.–e Center for Medicare and Medicaid Innovation, “Independence at Home Demonstration,” updated December 2015, accessed January 2016, https://innovation.cms.gov/initiatives/independence-at-home/.–f Centers for Medicare and Medicaid Services, “Affordable Care Act payment model saves more than $25 million in first performance year,” June 2015, https://www.cms.gov/Newsroom/MediaReleaseDatabase/Press-releases/2015-Press-releases-items/2015-06-18.html.–g Peikes et al., Evaluation of the Comprehensive Primary Care Initiative, Second Annual Report, Mathematica Policy Research, April 2016, available at https://innovation.cms.gov/Files/reports/cpci-evalrpt2.pdf.–h Evaluation of CMS FQHC APCP Demonstration, Second Annual Report, RAND Corporation, July 2015, available at https://innovation.cms.gov/Files/reports/fqhc-scndevalrpt.pdf.–i Center for Medicare and Medicaid Innovation, “Year 1 Practice Results,” June 2015, http://innovation.cms.gov/Files/x/iah-yroneresults.pdf.–j Evaluation of CMS’ FQHC APCP Demonstration, Final First Annual Report, RAND Corporation, February 2015, available at https://innovation.cms.gov/Files/reports/FQHCEvalRpt.pdf.–k Centers for Medicare and Medicaid Services, “Independence at Home Demonstration Performance Year 2 Results,” August 2016, https://www.cms.gov/Newsroom/MediaReleaseDatabase/Fact-sheets/2016-Fact-sheets-items/2016-08-09.html. | ||||
What are the Newest Medical Home Models to be Introduced?
- Comprehensive Primary Care Plus (CPC+) Model – After the conclusion of the CPC model at the end of 2016, current participants and new practices will have the opportunity to transition into (or join) the CPC+ model in January 2017. CMS projects that the new CPC+ model will have a greater number of participants (up to 5,000 practices in 20 regions) compared to the CPC model. All CPC+ practices will receive a prospective Medicare care management fee, as in the CPC model; however, CPC+ practices will also receive a pre-paid incentive for meeting quality and utilization benchmarks that, if not met, will be recouped by CMS. Also, the CPC+ model will include two payment tracks to accommodate practices that are more or less advanced in their existing medical home capabilities. CPC+ practices will receive higher prospective payments under track 2 than track 1, but lower standard office visit payments—a hybrid payment arrangement that CMMI designed to provide a greater incentive for care management outside of face-to-face encounters. In August 2016, CMMI selected 14 regions for the CPC+ model. CMMI estimates that up to 5,000 primary care practices serving an estimated 3.5 million beneficiaries could participate in the model.
Accountable Care Organizations (ACOs)
What is an ACO?
ACOs are groups of doctors, hospitals, and other health care providers who form partnerships to collaborate and share accountability for the quality and cost of care delivered to Medicare beneficiaries who are attributed to their ACO. Medicare payments to ACOs incorporate financial incentives for their performance on specified spending and quality metrics for their attributed beneficiaries. These financial incentives—in the form of shared savings or losses (sometimes referred to as bonuses or penalties)—are paid to, or collected from, the ACO rather than being divided among the individual providers or facilities that treated each of the ACO’s attributed beneficiaries. ACOs can be comprised of physicians only, or include hospitals and other providers, as well. CMS and CMMI are currently implementing several ACO models across the U.S. (Figure 2), including the following three, for which early results are described in Table 4:
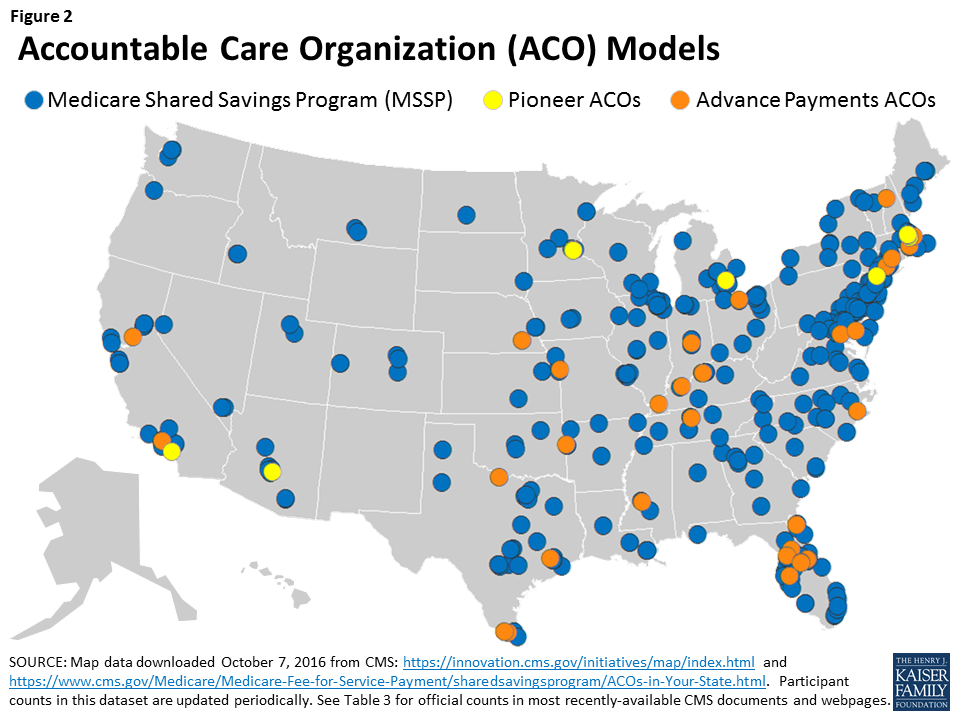
- Medicare Shared Savings Program (MSSP) ACOs — The MSSP is a permanent ACO program in traditional Medicare that provides financial incentives for meeting or exceeding savings targets and quality goals. The MSSP allows ACOs to choose between sharing in both savings and losses, or just savings. Overwhelmingly, for 2016, most ACOs are in models which only include potential for shared savings. MSSPs are accountable for at least 5,000 assigned Medicare beneficiaries.
- Pioneer ACOs — Like the MSSP, the Pioneer ACO model is designed to assess the effects of providing ACOs with financial incentives to lower overall spending and maintain or improve care quality. However, unlike most MSSP ACOs, all Pioneer ACOs are required to pay back CMS if spending exceeds a target amount. Thus, all Pioneers accept both upside and downside risk. Also, Pioneer ACOs enter the model already having experience accepting risk through contracts with other payers and are accountable for at least 15,000 assigned Medicare beneficiaries.
- Advanced Payment ACOs — The Advance Payment ACO model is a subset of the MSSP. It provides up-front payments to ACOs to support infrastructure development and operations. The Advance Payment ACO model assesses whether or not these early investments increase participation in the MSSP among smaller and/or rural providers. Advance Payment ACOs also receive monthly, population-based payments and can share in savings, if realized after CMS recoups the additional advance payments.
Conceptually, How Could an ACO Improve Care and Reduce Costs?
The basic assumption underlying the ACO model of care is that patient care is improved and less fragmented when providers have a financial incentive to work together to coordinate care. Under this premise, joint accountability among providers may lead to lower costs and better quality, such as reductions in unnecessary or duplicative testing, fewer medical errors, and lower rates of hospitalizations due to exacerbations of chronic conditions and medical complications.18 The ACO model is designed to reward providers financially for working together, sharing information, and coordinating care, especially for high-risk and high-cost chronically-ill patients. In addition to overall Medicare spending, CMS also factors in performance on quality measures to determine final payments to ACOs. Accordingly, quality and cost savings intersect in the overall incentive structure of the ACO model.
How Are ACOs Different from the Status Quo in Traditional Medicare?
In traditional Medicare, providers do not receive bonuses or penalties tied to the overall net spending for their patients in a given time period; rather, they receive payment for the care they provide in their own practices/facilities. When Medicare spends less on patients in an ACO—netted across all settings—than their target amount (based, in part, on national spending in traditional Medicare), the ACO shares in the Medicare savings. Pioneer ACOs and a small number of MSSP ACOs are also at a financial risk when the reverse happens: when their spending is higher than expected, they owe CMS a portion of the “excess” cost (i.e., a penalty). When applicable, shared-savings payments offer ACO providers the opportunity to gain additional revenue without providing additional care. Savings and losses may be shared across partnering providers as an incentive for furnishing high quality care and, in the case of shared savings, to offset costs associated with services and staff needed to effectively implement their care protocols.
In theory, as a result of these incentives, greater coordination between the various providers and across settings distinguishes care delivered by ACO providers from non-ACO providers in traditional Medicare. This coordination may occur in a variety of ways. For example, care coordinators or care managers may work with individual patients as navigators and advocates, reaching out to patients in between visits to the physician. Coordination may also occur through the sharing of information via electronic health records and health information exchanges, so that all providers have timely access to complete and current information. Similar to the medical home model, in the ACO model, the primary care provider or medical practice ideally coordinates all patient care to reduce fragmentation of care across different specialists and facilities. Additionally, ACOs may have incentives to encourage patients to seek care at lower-cost settings, provided the care meets the patients’ needs.
How Are Medicare Beneficiaries Involved with ACOs?
As of January 2016, almost 9 million Medicare beneficiaries were attributed to an ACO.19 CMS attributes beneficiaries to ACOs based on fairly complex claims analyses, which vary based on the type of ACO, but generally reflect beneficiaries’ link to a primary care practice affiliated with an ACO. By and large, beneficiaries do not actively select (or enroll in) an ACO; rather, they are informed of their attribution by their provider and can opt-out if they do not wish their data to be shared with other providers. Pioneer ACOs may submit attestations from beneficiaries regarding their desire to be attributed or not attributed to the ACO. Consistent with traditional Medicare, beneficiaries are free to seek services from any provider who will see them, so there is no “lock-in” from the beneficiary’s standpoint and they have no obligation or financial incentive to stay within the ACO and its network of providers. In newer ACO models, CMS is testing ways for beneficiaries to indicate or verify whether they consider their assigned ACOs to be their main provider (described later in this section).
What Are Some of the Implications for Beneficiaries in ACOs?
Essentially, Medicare beneficiaries attributed to ACOs do not experience any difference in their traditional Medicare benefits. In many cases, they may not be aware that their physician is part of an ACO and that CMS has attributed them to one, despite having received notification with this information or being told by their doctor. On the one hand, this attribution method is the least disruptive to beneficiaries and places greater responsibility on the providers to engage with beneficiaries and provide better quality care. It is also less susceptible to selection issues, whereby beneficiaries with lower health costs are somehow encouraged to “join” an ACO, either through an enrollment process or through their selection of a primary care physician. On the other hand, some analysts propose that beneficiaries could play a greater role in lowering health care costs if they understood how Medicare and ACO incentives are aligned, and if they had incentives to see providers in their ACO and participate in care management activities. Further, when providers and Medicare share in savings, some propose that beneficiaries could as well. In newer ACO models, CMS is exploring ways for beneficiaries to receive financial incentives from CMS for seeking care from ACO providers (described later in this section).
While analyses of Pioneer ACOs and MSSP ACOs finds that beneficiaries attributed to ACOs are demographically similar to beneficiaries in comparison groups in the same market areas, additional research is needed to examine how Medicare beneficiaries in ACOs compare to the general Medicare population.20 In particular, it would be useful to understand the extent to which ACOs across the country are serving high-cost and high-need populations—such as beneficiaries with multiple chronic conditions and beneficiaries dually covered by Medicare and Medicaid.
What Are Some of the Implementation Challenges with ACOs?
Policy analysts, researchers, and ACOs providers have raised a number of challenges associated with implementing ACOs. For example, some have cited that the infrastructure costs for ACOs are front-loaded with start-up expenses including: hiring and training of staff; creation of partnerships; design and implementation of coordination tools, such as electronic health record (EHR) upgrades; and process changes. These investments may take years to recoup—if at all—through future shared savings. Further, the up-front investments serve the entire patient population of that practice, not just the Medicare ACO patients. Yet if savings are achieved, they only reflect amounts associated with Medicare ACO patients and therefore do not account for savings realized by other payers. CMS is also faced with challenges determining the best benchmark upon which to measure spending performance. ACOs have noted that benchmarks which incorporate ACOs’ spending history make it more difficult for high-saver ACOs to perform better in future years. CMS is offering new methods for benchmarking in future years to address some of these concerns.
Another implementation challenge involves how beneficiaries are attributed to each ACO based on a CMS claims analysis, as described above. As with the medical home models, because beneficiaries do not take an active role in selecting an ACO and have no obligation or financial incentive to stay within the ACO and its network of providers, ACOs have little control over costs that may result from out-of-ACO utilization. The challenge for ACO providers lies in educating and engaging beneficiaries about their health care and reasons for staying within the ACO network. This issue is magnified by the retrospective process of beneficiary attribution to ACOs in the MSSP (for 2015 and earlier), preventing the ACOs from knowing at the point of care whether they will ultimately be held accountable for the beneficiary. Addressing this concern, CMS provides ACOs with a prospective list of likely assigned beneficiaries, but the final payment reconciliation is based on retrospective assignment. Pioneer ACOs have more opportunities to know with certainty their attributed beneficiaries because Pioneer ACOs may submit attestations from beneficiaries regarding their desire to be attributed/not attributed to the ACO, and beneficiaries who were part of the ACO in previous years may be prospectively attributed.
Another consideration that has been raised is the potential for ACOs to contribute to the current trends for market consolidation through hospital and health system mergers and the purchase of physician practices.21 When a limited number of health systems consume a large portion of a market area, they may have the ability to drive up health care spending, particularly for non-Medicare insurers.
What Early Results Are Available for the ACOs?
Medicare ACOs are, by most accounts, showing mixed results, with most ACOs reaching quality benchmarks, but realizing relatively modest or no savings on net.22 From the most recently reported results, for 2015, less than one third of the MSSP ACOs and half of the Pioneer ACOs earned shared savings bonuses because their total spending was low enough (compared to their benchmark) and their quality scores were high enough. Among the Pioneer ACOs that did not receive shared savings bonuses, a small share owed CMS payments to account for spending over their benchmarks. About one quarter of the Advance Payment ACOs, a subset of the MSSP ACOs, qualified for shared savings.
Both MSSP ACOs and Pioneer ACOs achieved lower beneficiary expenditures than their benchmarks in 2015; but after factoring in Medicare’s shared savings bonuses only the Pioneer ACOs saved Medicare, on net, totaling $669,000 in savings (Table 4).23 In contrast, total bonus payments Medicare made to MSSP ACOs exceeded the total savings that MSSP ACOs achieved on beneficiary expenditures, resulting in a net cost of $216 million in 2015. Advance payment ACOs saved $45 million on net, after bonus payments. It is difficult to compare the magnitude of savings across models because of the variation in their sizes.
| Table 4: Accountable Care Organization (ACO) Models in Medicare (Active in 2015) | |||
| Medicare Shared Savings Program (MSSP) ACOs | Pioneer ACOs | Advance Payment ACOs | |
| Description of Model; what is being tested | The MSSP is a permanent ACO program in traditional Medicare that provides financial incentives for meeting or exceeding savings targets and quality goals. The MSSP allows ACOs to choose between sharing in both savings and losses, or just savings. For 2016, the vast majority of ACOS are in models which only include potential for shared savings. MSSPs are accountable for at least 5,000 assigned Medicare beneficiaries.a | The Pioneer ACO model is also testing the effects of financial incentives to lower spending and maintain or improve quality. Unlike most MSSP ACOs, all Pioneer ACOs are required to pay back CMS if spending exceeds their target. Pioneer ACOs are accountable for at least 15,000 assigned Medicare beneficiaries and must have experience accepting risk through contracts with other payers.c | The Advance Payment ACO model is a subset of the MSSP, testing if providing advance payments to typically smaller providers (such as physician-owned and/or rural practices) towards infrastructure and operations increases participation in the MSSP and how these payments affect spending and quality. |
| Start date/ End date | Start dateApril 2012 (initial cohort) | Start dateJanuary 2012 (initial cohort) | Start dateApril 2012 (initial cohort) |
| End dateNone | End dateEnd of 2016 | End dateUnspecified | |
| Num./type of participants | 433 MSSP ACOs (as of 4/2016); comprised of multiple provider types, including physician practices, pharmacies, hospitals, rehabilitation facilities, durable medical equipment suppliers, and othersb | 9 Pioneer ACOs (as of 9/2016); comprised of multiple provider types, similar to the MSSP ACOs, but because of beneficiary capacity requirements and existence of other risk contracts, Pioneer ACOs are generally largerd | 35 Advance Payment ACOs (as of 2/2016); similar provider types as MSSP ACOs, but limited to being either small (<$50 million annual revenue), or with limited inpatient facilities and <$80 million in annual revenuee |
| Num. Medicare beneficiaries | 7.7 million beneficiaries (as of 4/2016)b | Not available for 2016(2015: 461,442 beneficiaries)m | Not available for 2016(2015: 270,427 beneficiaries)h |
| States with participants | All states, DC, and PR, except HI (as of 1/2016) | AZ, CA, MA, MI, MN, NY (as of 1/2016) | AR, CA, CT, FL, IN, KY, MD, MA, MS, MO, NE, NH, NC, OH, RI, TN, TX (as of 1/2016) |
| Payment arrangements | Providers within MSSP ACOs continue to receive traditional Medicare payments for services rendered. Assessment of each ACO’s overall spending and quality—for calculating shared savings eligibility and amount—is based on the collective performance of all of the ACO’s providers for all of the ACO’s assigned beneficiaries. Although ACOs get a preliminary list of prospective beneficiaries, final assessments are based on retrospective attribution (usually based on their primary care providers). A future MSSP track will have prospective attribution opportunities. | Like MSSPs, individual providers in Pioneer ACOs receive traditional Medicare payments and performance is also based on the collective provider performance on spending and quality for attributed beneficiaries, using the same quality measures as MSSP ACOs. Beneficiary assignment to Pioneer ACOs is also usually based on primary care utilization, but Pioneer ACOs may submit beneficiary attestations regarding their desire to be attributed/not attributed to the ACO if the beneficiary was attributed to the ACO in the prior year. | Like both the MSSPs and the Pioneer ACOs, individual providers within Advance Payment ACOs continue to receive payments under traditional Medicare, but receive additional upfront and monthly payments. These payments are calculated to be recouped by CMS before being eligible for shared savings. |
| Shared savings/lossesMSSP ACOs are eligible to receive additional payments (essentially, share in financial savings with CMS) if total Medicare spending for their assigned beneficiaries is at or below pre-set, risk-adjusted spending benchmarks and their performance on quality metrics meets specified targets. 99% of MSSP ACOs are in Track 1 (eligible for shared savings); 1% are in Track 2 (potential for higher shared savings, but also at risk for shared losses). | Shared savings/lossesLike MSSP ACOs, Pioneer ACOs that meet quality standards can share in Medicare savings. However, unlike MSSP ACOs, all Pioneer ACOs are also at risk for losses if total spending exceeds risk-adjusted, retrospectively calculated benchmark. Pioneer ACOs have a higher maximum allowed shared saving percentage than the MSSP ACOs, and quality scores affect final sharing/loss rates by either increasing applicable bonuses or decreasing applicable losses. | Shared savings/lossesAdvanced Payment ACOs follow the same shared savings arrangements as the MSSP ACOs, but CMS recoups previously made advance payments from any allocated shared savings. | |
| Population-based paymentsPioneer ACOs with savings in their first two years may start receiving a combination of traditional Medicare fees and population-based payments (per beneficiary payments) in their third year.–Medicare waiverPioneer ACOs are eligible for a waiver of the Medicare requirement for 3-day hospital stay prior to SNF coverage. | Upfront advanced paymentsACOs receive two upfront payments towards startup costs: one fixed payment and one variable payment based on the number of assigned beneficiaries.–Monthly advanced paymentsEach ACO also receives monthly payments towards operational activities based on the number of its assigned beneficiaries. | ||
| Early results | SavingsNet savings on beneficiary expenditures before bonuses:2012-2013: $234 millionf2014: $291 milliong2015: $429 millionh–Net savings after bonuses:2012-2013: -$78 millionf2014: -$50 milliong2015: -$216 millionh–For 2015, 119 of 392 MSSP ACOs generated enough savings to receive bonus payments from CMS; 83 produced savings that were not high enough for bonus payments; 189 generated losses.i–(CMS results for 2014 also reported savings of $465 million, which did not include Medicare spending above benchmark for ACOs that did not achieve savings; however, that total did account for bonus payments to qualifying ACOsj | SavingsNet savings on beneficiary expenditures before bonuses:2013: $96 millionk2014: $120 millionl2015: $37 millionm–Net savings after bonuses:2013: $41 millionk2014: $47 millionl2015: $669,000m–For 2015, 8 of 12 Pioneer ACOs generated savings, and 6 of these earned enough savings to receive shared-savings bonus payments from CMS; 4 generated losses (of which 1 had enough to owe a portion to CMS).i–(Other evaluation results showed higher gross savings in first two years, based on an analysis comparing Pioneer ACO beneficiaries to similar non-ACO beneficiaries.n) | SavingsNet savings on beneficiary expenditures before bonuses:2012-2013: $8 millionf2014: $85 milliong2015: $112 millionh–Net savings after bonuses:2012-2013: $22 millionf2014: $41 milliong2015: $45 millionh–For 2015, 17 of 33 Advance Payment ACOs generated savings; all were high enough to receive bonus payments from CMS.h–Note: Advance Payment ACO savings are a subset of MSSP savings. |
| QualityAcross 33 measures within four categories (patient/caregiver experience; care coordination/patient safety; preventive health; and at-risk populations),o most quality measures for MSSP ACOs improved from the previous year.i, p MSSP ACOs also scored as well or better than providers in traditional Medicare on comparable quality measures.a–Overall average composite score:2014: 83%g2015: 91%h | QualityUsing the same measures as MSSPs, most quality measures for Pioneer ACOs improved from the previous year.i Pioneer ACOs also scored as well or better than providers in traditional Medicare on comparable quality measures.a–Overall average composite score:2014: 87%i2015: 92%i | QualityUsing the same measures as MSSPs, most quality measures for Advance Payment ACOs improved from the previous year.a–Overall average composite score:2014: 85%g2015: 90%h | |
| ParticipationIncreased to 433 MSSP ACOs in April 2016, from 220 in the initial year (2012-2013).b, q | ParticipationDecreased to 9 Pioneer ACOs in 2016, from 20 ACOs in 2014, 23 in 2013, and 32 in 2012 (8 Pioneer ACOs transitioned to MSSP ACOs).p, r | ParticipationParticipation has remained relatively steady. The model included 35 participants during both its first year as well as during 2016.s, e However, 2015 performance results included only 33 participants.h | |
| Evaluation contractor/ Most recent report | No independent evaluator.Performance data released on CMS website. | L&M Policy Research: Pioneer ACO Evaluation Findings from Performance Years One and Two (March 2015)Performance data released on CMS website. | Independent evaluation in progress.Performance data released on CMS website. |
| SOURCES: a MedPAC, “Accountable Care Organization Payment Systems,” revised October 2016, http://medpac.gov/docs/default-source/payment-basics/medpac_payment_basics_16_aco_final.pdf?sfvrsn=0. b Centers for Medicare and Medicaid Services, “Fast Facts: All Medicare Shared Savings Program (Shared Savings Program) ACOs,” April 2016, https://www.cms.gov/Medicare/Medicare-Fee-for-Service-Payment/sharedsavingsprogram/Downloads/All-Starts-MSSP-ACO.pdf. c Centers for Medicare and Medicaid Services, “Pioneer ACO Model Fact Sheet,” updated September 2016 and accessed October 2016, https://innovation.cms.gov/initiatives/pioneer-aco-model/pioneeraco-factsheet.html. d Center for Medicare and Medicaid Innovation, “Pioneer ACO Model,” updated and accessed January 2016, https://innovation.cms.gov/initiatives/Pioneer-aco-model/; “Medicare Accountable Care Organizations 2015,” 2016. e Center for Medicare and Medicaid Innovation, “Advance Payment ACO Model,” updated and accessed January 2016, https://innovation.cms.gov/initiatives/Advance-Payment-ACO-Model/. f Centers for Medicare and Medicaid Services, “Medicare Shared Savings Program Accountable Care Organizations Performance Year 1 Results,” accessed October 2016 and exported from https://data.cms.gov/ACO/Medicare-Shared-Savings-Program-Accountable-Care-O/yuq5-65xt. g Centers for Medicare and Medicaid Services, “Medicare Shared Savings Program Accountable Care Organizations Performance Year 2014 Results,” accessed October 2016 and exported from https://data.cms.gov/ACO/Medicare-Shared-Savings-Program-Accountable-Care-O/ucce-hhpu. h Centers for Medicare and Medicaid Services, “Medicare Shared Savings Program Accountable Care Organizations Performance Year 2015 Results,” accessed October 2016 and exported from https://data.cms.gov/ACO/Medicare-Shared-Savings-Program-Accountable-Care-O/x8va-z7cu. i Centers for Medicare and Medicaid Services, “Medicare Accountable Care Organizations 2015 Performance Year Quality and Financial Results, August 25, 2016, https://www.cms.gov/Newsroom/MediaReleaseDatabase/Fact-sheets/2016-Fact-sheets-items/2016-08-25.html. j For calculations adjusted for “excess” spending, see Medicare Payment Advisory Commission, “Accountable Care Organizations Payment Systems,” revised October 2015, available at http://www.medpac.gov/docs/default-source/payment-basics/accountable-care-organization-payment-systems-15.pdf?sfvrsn=0. k Centers for Medicare and Medicaid Services, “Medicare Pioneer Accountable Care Organization Model Performance Year 2 (2013) Results,” accessed October 2016, available at https://innovation.cms.gov/Files/x/pioneeraco-fncl-py2.pdf. l Centers for Medicare and Medicaid Services, “Medicare Pioneer Accountable Care Organization Model Performance Year 3 (2014) Results,” accessed October 2016, available at https://innovation.cms.gov/Files/x/pioneeraco-fncl-py3.pdf. m Centers for Medicare and Medicaid Services, “Medicare Pioneer Accountable Care Organization Model Performance Year 4 (2015) Results,” accessed October 2016, available at https://innovation.cms.gov/Files/x/pioneeraco-fncl-py4.pdf. n This analysis found gross savings of $280 million in the first performance year (2012) and $104.5 million in the second year (2013): Evaluation of CMMI Accountable Care Organization Initiatives: Pioneer ACO Evaluation Findings from Performance Years One and Two,” L&M Policy Research, March 2015, available at https://innovation.cms.gov/Files/reports/PioneerACOEvalRpt2.pdf. o Centers for Medicare and Medicaid Services, “Table: 33 ACO Quality Measures,” accessed October 2016, available at https://www.cms.gov/Medicare/Medicare-Fee-for-Service-Payment/sharedsavingsprogram/Downloads/ACO-Shared-Savings-Program-Quality-Measures.pdf. p Centers for Medicare and Medicaid Services, “Medicare ACOs Provide Improved Care While Slowing Cost Growth in 2014, “ August 25, 2015, https://www.cms.gov/Newsroom/MediaReleaseDatabase/Fact-sheets/2015-Fact-sheets-items/2015-08-25.html. q Centers for Medicare and Medicaid Services, “Fact sheets: Medicare ACOs continue to succeed in improving care, lowering cost growth,” September 16, 2014, https://www.cms.gov/Newsroom/MediaReleaseDatabase/Fact-sheets/2014-Fact-sheets-items/2014-09-16.html.q L&M Policy Research, 2015. r Centers for Medicare and Medicaid Services: Office of the Actuary, “Certification of Pioneer Model Savings,” April 10, 2015, available at https://www.cms.gov/Research-Statistics-Data-and-Systems/Research/ActuarialStudies/Downloads/Pioneer-Certification-2015-04-10.pdf. s Centers for Medicare and Medicaid Services, “Advance Payment Accountable Care Organization (ACO) Model” Fact Sheet, Updated January 2013, available at https://innovation.cms.gov/Files/fact-sheet/Advanced-Payment-ACO-Model-Fact-Sheet.pdf. | |||
In addition to quality improvements since their initial years, CMS has stated that for both MSSP and Pioneer ACOs, performance on quality measures is comparably as good or better than the traditional Medicare program overall.24 Further, ACOs that continued in the program for multiple years performed better on quality measures and were more likely to share in savings than ACOs that withdrew.25 In terms of participation in the ACO models, the number of MSSP ACOs has almost doubled, growing from about 200 MSSP ACOs in the initial year to over 400 in 2016. In contrast, participation in the Pioneer ACO model has declined from 32 at the start to 9 in 2016, but several Pioneer ACOs that withdrew transitioned to become MSSP ACOs.
What are the Newest ACO Models to be Introduced?
In addition to establishing a “Track 3” option in the MSSP program (described below), CMMI has launched new ACO models to test additional interventions and refinements to the current models, based on the early ACO experiences and discussions with stakeholders.
- Track 3 MSSP ACO — Started in 2016, Track 3 of the MSSP ACO model offers new financial incentive structure and different beneficiary attribution rules. For example, under Track 3, ACOs have the potential for both greater shared risk and greater shared savings than under Track 2, the initial track that had downside risk. Also, in Track 3, beneficiaries are prospectively attributed to the ACO, allowing ACOs to know their assigned beneficiaries ahead of time, and in 2017, beneficiaries will be able to select the ACO in which their main doctor is participating. Beneficiaries may request a waiver from traditional Medicare rules requiring a 3-day hospital stay for most post-acute care coverage. In several ways, the Track 3 MSSP ACO program is similar to the Pioneer ACO model, but can have fewer than 10,000 attributed beneficiaries. As of November 2016, 16 ACOs are participating in this model.
- The ACO Investment Model — Started in 2016, this model provides advanced capital resources to MSSP ACOs to aid in their development of infrastructure for population health care management. This model is focused predominantly on physician-only ACOs and rural ACOs with between 5,000 and 10,000 assigned beneficiaries. It follows a similar financial structure as the Advance Payment ACO, which provides for shared savings opportunities after accounting for advance payments. As of November 2016, 45 ACOs are participating in this model.
- The Next Generation ACO Model — Also started in 2016, this new ACO model is designed to allow experienced ACOs with at least 10,000 Medicare beneficiaries to assume higher levels of both financial risk and reward than the earlier ACO models. Additionally, beneficiaries have the opportunity to confirm or reject their claims-based attribution to an ACO and may receive a coordinated care incentive (payment made directly to beneficiaries from CMS) if at least a specified percentage of their patient encounters are with their Next Generation ACO’s providers/suppliers (or preferred providers and affiliates). As with other ACOs, and consistent with traditional Medicare, patients in Next Generation ACOs will continue to have no restrictions on their ability to see any providers they choose, whether or not the providers are affiliated with their assigned ACO. As of November 2016, 18 ACOs are participating in this model.
Bundled Payments
What Are Bundled Payments?
Also known as episode-of-care payments, the concept of bundled payments is to establish a total budget for all services provided to a patient receiving a course of treatment for a given clinical condition over a defined period of time. For example, a single payment amount for a patient undergoing knee replacement would include: the surgeon’s fee, the anesthesiologist charges, the hospital’s charges, other physician charges for hospital-based care, and costs for post-surgical physical therapy. Rather than each provider (or each site) being responsible only for their part in the patient’s care and spending, all of the affiliated providers share a portion of the total budget. As such, if total expenses for an episode of care are lower than the target price of the bundle, then the affiliated providers may share in the “savings”; alternatively, if their costs for that episode of care exceed the bundle’s target price, then the providers may “lose” money on that episode.
CMS is testing several new and ongoing bundled payment models for acute and post-acute care, four of which are part of the Bundled Payment Care Improvement (BPCI) initiative. As noted below, these models vary based on scope of services included in the bundle, type of organization that holds the overall risk contract for the episodes (e.g., inpatient hospital or post-acute provider), and payment methodology. In some of the models, providers also have flexibility to choose the length of the episode (30, 60, or 90 days). Early results from BPCI are detailed in Table 5; newer models, for which results are not yet available, are described later in this section. Across the country (Figure 3), the four BPCI models that CMMI is implementing are:
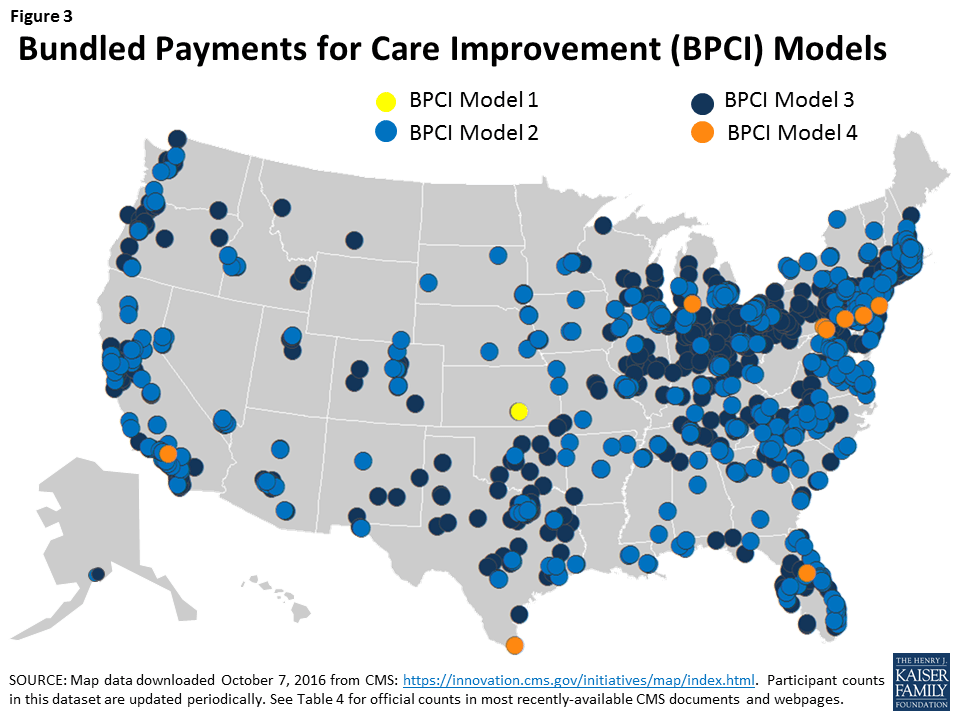
- BPCI Model 1 —Model 1 bundles all inpatient hospital services for the episode of care and applies a discount to the usual Medicare hospital payment. Hospitals can make “gainsharing” payments to contracted physicians or practitioners to provide incentives for lowering overall episode spending.
- BPCI Model 2 —Model 2 bundles inpatient hospital services, physician services, and post-acute care services throughout an episode of care (beginning with an inpatient hospitalization), as well as other Part A and Part B services received post-discharge from the hospital, including hospital readmissions. CMS retrospectively compares actual expenditures against a target price.
- BPCI Model 3 —Model 3 bundles post-acute care services throughout an episode of care (which begins after discharge from an inpatient hospitalization), as well as other Part A and Part B services received post-discharge from the hospital, including hospital readmissions. Like Model 2, CMS retrospectively compares actual expenditures against a target price.
- BPCI Model 4 —Model 4 bundles all inpatient and physician services during the initial hospital stay and subsequent hospital readmissions, but does not include post-acute care services in the bundle. Unlike models 2 and 3, Model 4 provides a prospective payment at the start of the episode of care.
Conceptually, How Could Bundled Payments Improve Care and Reduce Costs?
When a set of providers shares the budget for multiple services provided to a given patient within one episode of care, rather than separate payments for each service, the providers have a financial incentive to collaborate to improve efficiency and possibly lower their own costs associated with an episode of care.26 For example, under models two and three, providers may find ways to eliminate duplicative or unnecessary services and work with patients and other physicians to select the most appropriate post-acute patient care settings. Bundled payments may also create incentives to improve care quality, because the cost of treatments due to errors or medical complications comes from within the total episode budget. Fewer complications may translate into higher savings to be shared among the participating providers, as well as better patient experience.
How Do Bundled Payments Differ from the Status Quo in Traditional Medicare?
Under traditional Medicare, each provider or facility is reimbursed separately for the services they deliver, whether or not they are part of a larger episode of care for a given patient. In contrast, with bundled payment arrangements, Medicare determines a single target price for a defined episode of care, which may span across multiple providers (potentially, hospitals, physicians, and post-acute care providers). Presumably, the financial risk and savings are shared across providers, but the extent to which individual providers in bundled payment arrangements incur losses or bonuses depends on their contractual agreements with the organization that is officially designated as accountable for the episodes of care (i.e., the “awardee”).
CMS payment to BPCI providers are subject to the same quality incentive payments administered through traditional Medicare, such as in the Hospital Value-Based Purchasing program.27 The reconciliation payments (e.g., the savings to Medicare that providers keep from spending below their target levels) are not tied to specific quality metrics. BPCI awardees, however, may make incentive payment to partnering providers that meet quality performance targets pre-determined in their contractual agreement.
How Are Beneficiaries Involved in Bundled Payment Models?
CMMI estimates that about 130,000 beneficiaries are affected by the BPCI models—all of whom had a hospitalization to “trigger” the episode of care under a bundled payment arrangement. CMS requires that providers participating in all four models of the BPCI inform their patients that they are participating in the model, and that as beneficiaries in traditional Medicare, they are free to obtain services from any willing Medicare provider. Providers participating in bundled payment models may recommend or direct patients to certain provider partners (such as certain home health agencies), if they determine that those providers might offer care that could help meet quality and spending targets.
What Are Some of the Implications for Beneficiaries of Bundled Payments?
On the one hand, beneficiaries may experience better health outcomes, considering providers’ financial incentives to improve care to avoid re-hospitalizations and other complications. Additionally, for patients who wish to recover at home following a hospital admission, bundled payment arrangements may help providers find ways to provide adequate care in lower-cost environments. On the other hand, with incentives to reduce the overall costs, there is a concern that bundled payment arrangements may encourage some providers to stint on care or avoid caring for sicker patients.28 Patients with high health needs and less family caregiver support at home may require more costly post-acute care than other patients, highlighting the need for program evaluation to monitor care provided to these vulnerable patients. Also, while Medicare beneficiaries have free choice of their providers, it will also be important to examine discharge patterns to understand if or how patients may be steered to affiliated facilities—which may be beneficial to patients when the facilities provide better and more efficient care, but may not be as helpful to patients if the facilities are inconvenient or provide lower-quality care.
What Are Some of the Implementation Challenges with Bundled Payments?
Administering bundled payments raises several implementation challenges from the standpoints of both Medicare and the individual providers. For Medicare and CMS, these include determining what services are included in the bundles, setting payment levels for each bundle, and identifying appropriate quality measures. Except for model 1, all other BPCI models allow provider participants to select the conditions for which their bundled payments will apply (from 48 options), which may minimize the potential benefit of the payment approach. Provider organizations receiving bundled payments also face challenges, including determining which partners bear the costs of infrastructure investments and how potential savings will be shared among the affiliated providers, given that some may see more patients, or costlier patients, than others.
What Early Results Are Available from the Bundled Payment Models Being Tested?
Evaluation results for the BPCI models show variation both between models and within models, depending on the type of clinical episode and other variables, such as post-acute care settings (Table 5). For example, for Model 1, which bundles inpatient hospital care, evaluators report that for the first 15 months, BPCI episodes achieved lower cost growth overall than non-BPCI episodes (relative to the baseline level). Savings during the initial hospital stay were minimized when factoring in relatively higher spending in the post-acute period for the BPCI participants. Regarding quality, the first evaluation found no significant differences in readmission rates or mortality rates between BPCI and non-BPCI episodes, but evaluators noted need for further analysis of outlier mortality measures. Multiple withdrawals during the evaluation period among participants in Model 1 affected the measurability of these results.
| Table 5: Bundled Payment for Care Improvement (BPCI) Models in Medicare | ||||
| Model 1Bundle focus: Inpatient hospital services | Model 2Bundle focus: Inpatient hospital, physician, and post-acute services | Model 3Bundle focus: Post-acute services | Model 4Bundle focus: Inpatient hospital and physician services | |
| Description of Model; what is being tested | Four BPCI models are testing the effects on Medicare spending and quality of patient care when CMS allocates a single, pre-determined payment amount (“bundle”) for an episode of care. The participants gain financially if total spending for an episode is below the pre-determined bundled amount (a target price, generally discounted 1-3% from applicable fee-schedule totals) or conversely incur financial losses if spending exceeds the bundled amount. The range of potential services included in the bundle (e.g., acute hospital inpatient services, post-acute care) differ across models. Currently, BPCI payments are not tied to specific quality metrics. | |||
| Start date/ End date | Start date4/2013 (initial cohort) | Start date10/2013 (initial cohort) | Start date10/2013 (initial cohort) | Start date10/2013 (initial cohort) |
| End date3-year participation period | End date3-year participation period, initially; extended two additional years through September 2018 | End date3-year participation period, initially; extended two additional years through September 2018 | End date3-year participation period, initially; extended two additional years through September 2018 | |
| Num./type of participants | 1 acute care hospitals (as of 7/2016)a | 601 acute care hospitals, post-acute care facilities, or physician group practices (as of 7/2016)b | 836 post-acute care facilities or physician group practices (as of 7/2016)c | 10 acute care hospitals (as of 7/2016)d |
| Num. Medicare beneficiaries | 130,000 beneficiaries across 4 models; individual model estimates are not availablee | 130,000 beneficiaries across 4 models; individual model estimates are not availablee | 130,000 beneficiaries across 4 models; individual model estimates are not availablee | 130,000 beneficiaries across 4 models; individual model estimates are not availablee |
| States with participants | KS (as of 7/2016) | All states and DC except AK, HI, ID, KS, ME, MD, MT, NE, NM, ND, OK (as of 7/2016) | All states and DC except AK, AR, CO, DE, HI, KS, LA, ME, MS, MO, NE, NV, NH, NJ, NM, ND, OK, SC, VT, VA, WV, WY (as of 7/2016) | CA, FL, MI, NJ, PA, TX (as of 7/2016) |
| Payment arrangements | Individual hospitals automatically receive a discounted (up to 1%) MS-DRG payment from CMS. Hospitals can make gainsharing payments to contracted physicians or practitioners to provide incentives for lowering episode spending. | Individual providers continue to receive regular payments under traditional Medicare. A 2-3% discount is applied to the episode target price during reconciliation. | Like Model 2, individual providers continue to receive regular payments under traditional Medicare, but a 3% discount is applied to the episode target price during reconciliation. | Unlike Models 2 and 3, participating hospitals receive prospective payments equal to a pre-determined, risk-adjusted bundled amount, rather than starting with regular payments under traditional Medicare. A 3%-3.25% discount is applied to the prospective payment. |
| Services in bundleAll Part A services provided in episode of care. | Services in bundleAll related Part A/B services (with some exceptions) during initial hospitalization and related services for up to 90 days after discharge from the hospital; includes related readmissions. | Services in bundleAll related Part A/B services (with some exceptions) during post-acute period for up to 90 days; includes related readmissions. | Services in bundleAll related Part A/B services (with some exceptions) during initial inpatient stay; includes related readmissions. | |
| Payment reconciliationNone. CMS’s hospital payments (MS-DRG) are automatically discounted. Any internal cost savings are kept by the hospital and potentially redistributed to partnering providers through gainsharing arrangements. | Payment reconciliationRetrospectively, CMS compares actual total spending for each episode of care against pre-determined risk-adjusted bundled amount (“target price”); if spending was below the bundled amount, CMS makes added payment to hospital; if higher, then hospital owes CMS.–Medicare waiverParticipants are eligible for waiver of requirement for 3-day hospital stay prior to SNF coverage. | Payment reconciliationSame as Model 2. | Payment reconciliationCMS makes prospective payments to hospitals based on pre-determined amounts that bundle hospital and physician services. Hospitals are responsible for determining payments to partnering physicians if costs are lower than CMS payments. | |
| Early results | SavingsIn the first 15 months, BPCI episodes had lower spending growth compared to baseline spending than non-BPCI episodes (by $123) overall. Savings during the initial hospital stay were minimized by highed spending after discharge (to other providers) for BPCI-episodes compared to non-BPCI episodes.f | SavingsFirst year results found that for orthopedic surgery episodes (mostly hip and knee replacements), average overall episode payments declined more for BPCI participants (by $864) than non-BPCI participants, but increased more for spinal surgery episodes (by $3,477). For the four remaining clinical groups, difference in spending growth between BPCI and non-BPCI episodes were not statistically significant.g | SavingsFirst year results found no significant difference in the growth of average total episode payments between BPCI providers and non-BPCI providers. Within the episodes, SNF days decreased for BPCI episodes relative to the comparison group, but this decline did not significantly affect total episode spending differences.g | SavingsFirst year results found no significant difference in spending growth between BPCI episodes and non-BPCI episodes for cardiovascular surgery and orthopedic surgery. Results are limited by small sample sizes.g |
| QualityNo significant differences in readmission rates or mortality rates between BPCI and non-BPCI episodes, relative to baseline. Outliers were identified on measures for increased mortality after discharge among BPCI providers.f | QualityDifferences in quality between BPCI and non-BPCI episodes varied by measure and clinical episode group.g
| QualityDifferences in quality between BPCI and non-BPCI episodes varied by measure and clinical episode group.g
| QualityLimited sample for analysis, but no significant differences between BPCI and non-BPCI episodes in mortality, 30-day readmission rates, or emergency dept use (without hospitalization) after hospital discharge.g | |
| ParticipationDecreased in the first 5 quarters from 24 to 15 participants.f, h Subsequently decreased to 1 participant.a | ParticipationIncreased from 9 episode initiators (EI) in the first 3 months to 113 by the end of the first year.g, h Note: EIs can include multiple provide participants. | ParticipationIncreased from 9 EIs in the first 3 months to 94 by the end of the first year.g, h | ParticipationIncreased from 1 EI in the first 3 months to 20 by the end of the first year; 10 EIs subsequently withdrew.g, h | |
| Evaluation contractor/ Most recent report | Econometrica, Inc.: Evaluation and Monitoring of the Bundled Payments for Care Improvement Model 1 Initiative (July 2015) | Lewin Group: CMS Bundled Payments for Care Improvement Initiative Models 2-4: Year 2 Evaluation & Monitoring Annual Report (August 2016) | Lewin Group: CMS Bundled Payments for Care Improvement Initiative Models 2-4: Year 2 Evaluation & Monitoring Annual Report (August 2016) | Lewin Group: CMS Bundled Payments for Care Improvement Initiative Models 2-4: Year 2 Evaluation & Monitoring Annual Report (August 2016) |
| SOURCES: a Center for Medicare and Medicaid Innovation, “BPCI Model 1: Retrospective Acute Care Hospital Stay Only,” updated and accessed October 2016, https://innovation.cms.gov/initiatives/BPCI-Model-1/index.html. b Center for Medicare and Medicaid Innovation, “BPCI Model 2: Retrospective Acute & Post Acute Care Episode,” updated and accessed October 2016, https://innovation.cms.gov/initiatives/BPCI-Model-2/index.html. c Center for Medicare and Medicaid Innovation, “BPCI Model 3: Retrospective Post Acute Care Only,” updated and accessed October 2016, https://innovation.cms.gov/initiatives/BPCI-Model-3/index.html. d Center for Medicare and Medicaid Innovation, “BPCI Model 4: Prospective Acute Care Hospital Stay Only, updated and accessed January 2016, https://innovation.cms.gov/initiatives/BPCI-Model-4/index.html. e Center for Medicare and Medicaid Innovation, Report to Congress, December 2014, available at http://innovation.cms.gov/Files/reports/RTC-12-2014.pdf. f Econometrica, Evaluation and Monitoring of the Bundled Payments for Care Improvement Model 1 Initiative, July 9, 2015, available at https://downloads.cms.gov/files/cmmi/BPCIM1_ARY1_Report.pdf. g Lewin Group, CMS Bundled Payments for Care Improvement Initiative Models 2-4: Year 2 Evaluation & Monitoring Annual Report, August 2016, available at https://innovation.cms.gov/Files/reports/bpci-models2-4-yr2evalrpt.pdf. h The provider count refers to “episode initiators.” These are generally acute care hospitals, under Models 1, 2, and 4; or, under Model 3 post-acute care providers, such as skilled nursing facilities, long-term care hospitals, inpatient rehabilitation facilities, and home health agencies; or physician group practices under Models 2 and 3. | ||||
Model 2, for which hospitals and physician groups are accountable for both the acute and post-acute period of care, was the most widely adopted model among BPCI participants. Evaluation results for the first year found that orthopedic surgery episodes (mostly hip and knee replacements) among BPCI participants had lower spending over 90 days than non-BPCI participants. This reduction was attributable, in part, to decreases in the use of skilled nursing facility (SNF) services and inpatient rehabilitation facilities (IRF) concurrent with increases in the use of home health services, and reductions in hospital readmissions. Spinal surgery episodes, however, had higher Medicare payments among BPCI participants compared to non-BPCI participants. The remaining four clinical episode groups showed no statistically significant difference in spending between BPCI and non-BPCI episodes. Researchers are considering the impacts that noted increases in the number of episodes may have on total Medicare spending among BPCI hospitals.29 Quality outcomes showed no differences between BPCI and non-BPCI episodes in hospital readmissions, but certain BPCI episodes had higher emergency department use. Using additional months of outcome data, evaluators generally found no statistically significant differences in mortality rates for most episode groups.
In Model 3, which focused only on post-acute care episodes, and Model 4, which focused only on acute care, most clinical episode groups did not show a statistically significant change in overall spending, though days in SNF care among Model 3 participants was lower. Also for Model 3, quality outcomes were similar to those in comparison groups, with a few exceptions, including an increase in readmission rates. Model 4 participation declined during the evaluation period, limiting the ability to detect statistically significant differences in spending and quality.
What are the Newest Bundled Payment Models to be Introduced?
CMS is planning additional bundling payment models in the near future, including:
- Oncology Care Model (OCM) — This model, started in 2016, focuses on care provided by medical practices to beneficiaries receiving chemotherapy for cancer during six-month episodes of care. It will include a two-part payment system—a per-beneficiary payment for each month of the episode and a lump sum performance-based payment for episodes of chemotherapy care based on quality and spending outcomes. This program is also seeking agreements with other insurers, including commercial insurers and state Medicaid agencies, to join this payment model for participating practices and potentially create broader incentives for care transformation at the practice level, not just for Medicare beneficiaries in traditional Medicare. As of November 2016, nearly 200 physician practices are participating.
- The Comprehensive Care for Joint Replacement (CJR) Model — This bundled payment model, started in 2016, is designed for episodes of care initiated by a hospital stay for lower extremity joint (hip and/or knee) replacements. This model is similar to BPCI Model 2, but a key difference is that for most hospitals in the 67 selected geographic areas, participation is mandatory rather than voluntary. Under the CJR model, about 800 hospitals will be at financial risk for the care provided during the initial hospital stay plus 90 days after discharge from the hospital. As with other bundled payment approaches, the aim is to give hospitals and other providers an incentive to improve care coordination and invest in activities that will increase quality and efficiency.
Appendix
Appendix: Payments Allocated for CMMI Models
| Table A1: Innovation Center Model Payments, as of September 2014(From the Centers for Medicare and Medicaid Services’ Report to Congress, December 2014)a | |||
Initiative | CMS Innovation Center payments made to model participants | Payments under Title XVIII or XIX made for services on behalf of beneficiaries | Other CMS Innovation Center funds obligated to support model development and testing |
| Primary Care Transformation | |||
| Comprehensive Primary Care | $172,740,615 | Payments not yet made (expected FY 2015) | $57,609,096 |
| Federally Qualified Health Center (FQHC) Advanced Primary Care Practice (APCP) | $45,967,680 | N/A | $22,868,754 |
| Accountable Care Organizations | |||
| Pioneer Accountable Care Organization Model | N/A | $80,719,585 | $87,048,657 |
| Advance Payment Accountable Care Organization Model | $67,801,572b | $5,705,754c | $5,371,781 |
| Comprehensive End-Stage Renal Disease Care Model | N/A | Payments not yet made | $16,476,376d |
| Bundled Payments for Care Improvement | |||
| Bundled Payments for Care Improvement (Models 1-4) | N/A | Data not yet available | $40,399,579 |
| Initiatives Focused on the Medicaid Population | |||
| Strong Start for Mothers and Newborns (Strategies 1 & 2) | $23,594,395 | N/A | $47,649,930 |
| Initiatives Focused on Medicare-Medicaid Enrollees | |||
| State Demonstrations to Integrate Care for Medicare-Medicaid Enrollees | $70,509,361 | N/A | $18,928,906 |
| Financial Alignment Initiative | $5,207,996 | Data not yet available | $79,839,514e |
| Initiative to Reduce Avoidable Hospitalizations Among Nursing Facility Residents | $78,900,786 | N/A | $11,245,590 |
| Initiatives to Speed the Adoption of Best Practices | |||
| Partnership for Patients | N/A | N/A | $451,352,024 |
| Million Hearts® | N/A | N/A | N/A |
| Initiatives to Accelerate New Service Delivery and Payment Model Testing | |||
| Health Care Innovation Awards Round 1 | $879,640,554f | N/A | $60,477,074 |
| Health Care Innovation Awards Round 2 | $120,033,340 | N/A | $7,272,376 |
| State Innovation Models (Round One) | $181,418,835 | N/A | $32,335,764 |
| State Innovation Models (Round Two) | Payments not yet made | N/A | $1,985,982g |
| Medicaid Innovation Accelerator Program | N/A | N/A | Obligations not yet made |
| Maryland All-Payer Model | N/A | N/A | $5,608,084 |
| Medicare Care Choices Model | Payments not yet made | N/A | $1,857,149 |
| Prior Authorization Model: Non-Emergent Hyperbaric Oxygen Therapy | N/A | N/A | Obligations not yet made |
| Prior Authorization Model: Repetitive Scheduled Non-Emergent Ambulance Transport | N/A | N/A | $4,338,941 |
| Subtotals | $1,645,815,124 | $86,425,339 | $952,665,577 |
| SOURCES:–a Table taken from: Table 3 of Centers for Medicare and Medicaid Services, Report to Congress, December 2014, available at https://innovation.cms.gov/Files/reports/RTC-12-2014.pdf.–b Payments made to model participants in the Advance Payment ACO Model represent the advance payments given to ACOs as part of the model, which were distributed under the authority of section 1115A of the Social Security Act.–c Payments made to model participants in the Advance Payment ACO Model under Title XVIII or XIX were distributed as shared savings payments under the authority of the Medicare Shared Savings Program.–d Of this amount, $1,321,039 was obligated as application support through the FY2013 pre-implementation budget.–e Of this amount, $1,495,660 was obligated for the Financial Alignment Initiative under the FY2011 budget for the State Demonstrations to Integrate Care for Medicare-Medicaid Enrollees.–f This total reflects the full amount of grant funding provided to HCIA awardees for the 3-year period of performance. Funds are used by awardees to implement models, including payments to providers of services, and to suppliers.–g This funding was used for the Medicaid Innovation Accelerator Program (IAP) Learning Collaborative in FY2014. The IAP program is budgeted separately in FY2015 and thereafter. | |||
Endnotes
- Department of Health and Human Services, Press Release: “Better, Smarter, Healthier: In historic announcement, HHS sets clear goals and timeline for shifting Medicare reimbursements from volume to value,” January 26, 2015, http://www.hhs.gov/about/news/2015/01/26/better-smarter-healthier-in-historic-announcement-hhs-sets-clear-goals-and-timeline-for-shifting-medicare-reimbursements-from-volume-to-value.html. ↩︎
- DHHS, 2015. ↩︎
- On October 14, 2016, CMS released its final rule defining the health professionals who can qualify for bonuses, and the eligibility criteria for the applicable alternative payment models. See final rule here: https://www.federalregister.gov/documents/2016/11/04/2016-25240/medicare-program-merit-based-incentive-payment-system-mips-and-alternative-payment-model-apm. ↩︎
- Centers for Medicare and Medicaid Services: Center for Medicare and Medicaid Innovation, Report to Congress, December 2012, cited September 20, 2014, available at http://innovation.cms.gov/Files/reports/RTC-12-2012.pdf. ↩︎
- Includes programs managed outside of CMMI, such as the Medicare Shared Savings Program. Calculated from data provided on Center for Medicare and Medicaid Innovation sites as of August, 2015, available at https://innovation.cms.gov. ↩︎
- Blumenthal, D., M. Abrams, and R. Nuzum, “The Affordable Care Act at 5 Years,” N. Engl. J. Med. 2015;372(25):2451-58; Abrams, M. et al., “The Affordable Care Act’s Payment and Delivery System Reforms: A Progress Report at Five Years,” Bipartisan Policy Center, May 2015, http://www.commonwealthfund.org/publications/issue-briefs/2015/may/aca-payment-and-delivery-system-reforms-at-5-years; Korda, H. and Gloria N. Eldridge, “Payment Incentives and Integrated Care Delivery: Levers for Health System Reform and Cost Containment,” Inquiry (Oslo) 2011;48(4):277-87; America’s Health Insurance Plans, “Transforming Care Delivery,” January 2012, available at http://www.ahip.org/HillBriefings/Issue-Brief-Transforming-Care-Delivery/. ↩︎
- Office of the Legislative Counsel, 2010; Centers for Medicare and Medicaid Services, Report to Congress, 2012. ↩︎
- Rajkumar, R., M. Press, and P. Conway, “The CMS Innovation Center—A Five-Year Self-Assessment” New England Journal of Medicine 372;21 (May 2015) http://www.nejm.org/doi/full/10.1056/NEJMp1501951. ↩︎
- Shrank, W., “The Center for Medicare and Medicaid Innovation’s Blueprint for Rapid-Cycle Evaluation of New Care and Payment Models,” Health Aff. (Millwood) 2013;32(4):1-6. ↩︎
- For further discussion of the evaluation methods for the CMMI models, see: Howell, B., P. Conway, and R. Rajkumar, “Guiding Principles for Center for Medicare & Medicaid Innovation Model Evaluations,” Journal of American Medical Association, 313;23 (June 16, 2015). http://jama.jamanetwork.com/article.aspx?articleid=2278025. ↩︎
- American College of Physicians, “What is the Patient-Centered Medical Home?” cited June 9, 2014, available at http://www.acponline.org/running_practice/delivery_and_payment_models/pcmh/understanding/what.htm. ↩︎
- AcademyHealth, “Medical Homes and Accountable Care Organizations: If We Build It, Will they Come?” 2009, available at http://www.academyhealth.org/files/publications/RschInsightMedHomes.pdf. ↩︎
- Cassidy, A., “Patient-Centered Medical Homes,” Health Affairs and the Robert Wood Johnson Foundation Health Policy Brief, September 14, 2010, available at http://healthaffairs.org/healthpolicybriefs/brief_pdfs/healthpolicybrief_25.pdf. ↩︎
- Starting January 1, 2015, Medicare allowed certain physicians and other health professionals to bill a care management code for non-face-to-face care management of eligible Medicare patients with multiple conditions. For more information, see: https://www.cms.gov/Outreach-and-Education/Medicare-Learning-Network-MLN/MLNProducts/Downloads/ChronicCareManagement.pdf. ↩︎
- Mathematica Policy Research, “Coordinating Care for Adults with Complex Care Needs in the Patient-Centered Medical Home: Challenges and Solutions,” prepared for Department of Health and Human Services: Agency for Healthcare Research and Quality, January 2012, available at https://pcmh.ahrq.gov/sites/default/files/attachments/Coordinating%20Care%20for%20Adults%20with%20Complex%20Care%20Needs.pdf; “Patient-Centered Medical Homes,” 2010. ↩︎
- Curnow, R.J., “The Patient Centered Medical Home: Opportunity and Challenges”
This slideshow could not be started. Try refreshing the page or viewing it in another browser.