Medicare Part D in Its Ninth Year: The 2014 Marketplace and Key Trends, 2006-2014
Section 3: Part D Benefit Design and Cost Sharing
Plan Benefit Design
Most Part D plans do not offer the defined standard benefit (with a $310 deductible in 2014 and 25 percent coinsurance); the vast majority have a tiered cost-sharing structure with incentives for enrollees to use less expensive generic and preferred brand-name drugs. In 2014, only 3 percent of PDPs and 2 percent of MA-PD plans offer the defined standard benefit that has no formulary tiers (with 2 percent and 1 percent of enrollment, respectively).
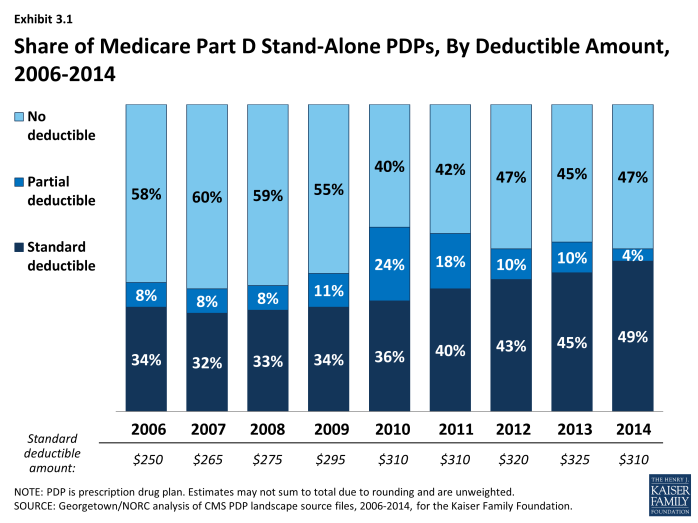
Use of a deductible by stand-alone PDPs is considerably higher in 2014 than in the first few years of the program, but down somewhat since 2010 (Exhibit 3.1). About 53 percent of PDPs charge a deductible this year, compared to a high of 60 percent in 2010. Most PDPs with a deductible use the standard deductible allowed by law ($310 in 2014). A far smaller number of MA-PD plans (14 percent) than PDPs have a deductible in 2014.
In 2014, about three-fourths of all plans (76 percent of PDPs and 75 percent of MA-PD plans) use five cost-sharing tiers: preferred and non-preferred tiers for generic drugs, preferred and non-preferred tiers for brand drugs, and a tier for specialty drugs. About 73 percent of PDP enrollees and 81 percent of MA-PD enrollees are in plans with five tiers. Most of the other Part D enrollees are in plans with four tiers: one generic tier, two brand tiers, and a specialty tier.1 Four-tier arrangements were most common until 2012 when plans began shifting toward the five-tier cost-sharing design.
Part D Cost-Sharing Amounts
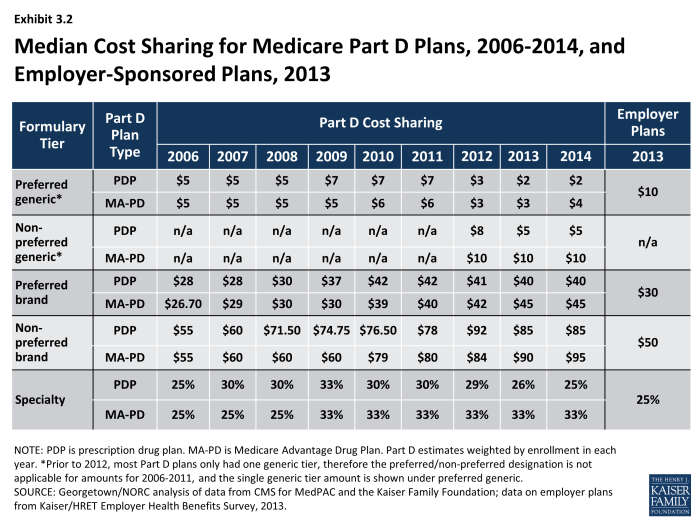
While cost sharing has been relatively stable in recent years, the median cost sharing for a 30-day supply of “non-preferred” brand-name drugs in stand-alone PDPs has increased by 55 percent since 2006, from $55 to $85, while cost sharing for preferred brand drugs increased by 43 percent, from $28 to $40 (Exhibit 3.2). From 2011 to 2014, the spread between tiers widened modestly. Median cost sharing for preferred generic drugs in PDPs (or for generic drugs among plans with a single generic tier) is $2 in 2014, lower than in any year since the program began. For PDPs with two generic tiers (about two-thirds of all PDPs and PDP enrollment), the median cost sharing is $2 for the preferred generic tier and $5 for the non-preferred tier (the same as in 2013). Some PDPs set cost sharing for their non-preferred generic tier as high as $33.
Cost-sharing amounts for brand-name drugs vary widely across Part D plans in 2014, as they have in previous years. For preferred brand tiers, PDPs set copayment levels as low as $17 and as high as $45; for non-preferred tiers, the copayments range from $35 to $95. These ranges are less than in some previous years because of CMS guidance that sets maximum allowable copayment levels.
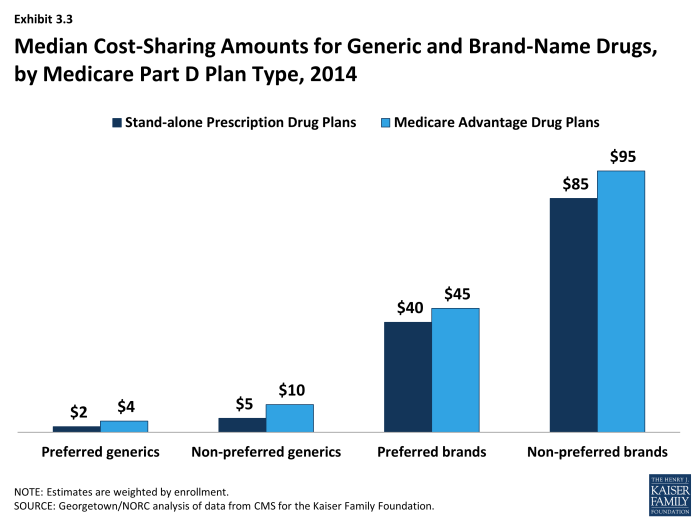
In 2014, median cost-sharing amounts are generally higher in MA-PD plans than in PDPs in all tiers.2 For example, the median cost sharing for preferred brands in MA-PD plans is $5 more than the median in PDPs ($45 versus $40) and $2 more for preferred generic drugs ($4 versus $2) (Exhibit 3.3). The comparisons for UnitedHealth, the sponsor with largest share of both PDP and MA-PD enrollment, illustrate the pattern. For preferred and non-preferred generic drugs, UnitedHealth’s median cost sharing, weighted by enrollment, is $3 and $6 in its PDPs and $4 and $8 in its MA-PD plans, respectively. The differences for brand drugs for UnitedHealth’s plans mirror the national differences. Higher cost sharing for MA-PD plans is surprising, given the incentives for MA-PD plans to encourage use of drugs that might reduce other types of health care costs. Further work is needed to assess variations in copayments by Part D plan type, including for example, the extent to which these differences persist across all plan sponsors and within different geographic areas, as well as whether differences in tier placement of specific drugs or whether some plans cover more drugs than others on specific tiers may be a factor in explaining differences in cost-sharing amounts between types of Part D plans.
Copayments in the form of a flat dollar payment amount remain the most common type of cost sharing; however, the share of PDPs using percentage-based coinsurance for non-specialty brand-name drug tiers has increased since 2006. In 2014, 37 percent of PDPs with a tier for non-preferred brand drugs charge a coinsurance rate for drugs on that tier. Of these plans, nearly all have a mixed pricing design. Typically they use a flat copayment for their generic drug tiers, and many also use a flat copayment for preferred brand drugs. The use of percentage coinsurance for drugs remains uncommon among MA-PD plans.
For plans that use percentage coinsurance instead of dollar copayments, the actual amount an enrollee pays depends on the retail price of the drug. The median coinsurance percentage for PDPs in 2014 for the preferred brand tier is 20 percent. For drugs on the non-preferred brand tier, the median coinsurance rate is 40 percent, a substantial share of the drug’s cost. In fact, 39 PDPs require beneficiaries to pay half the cost of drugs on the non-preferred brand tier (which is less than the 75 percent coinsurance applied in some previous years).
Medicare Part D plans generally charge more than private-sector employer plans do for preferred and non-preferred brand drugs, but less for generics. At the median, PDPs charge $40 per month for a preferred brand in 2014, higher than the median $30 charged by employer plans in 2013, the most recent available data (Exhibit 3.2).3 Cost-sharing differences are even greater for non-preferred brands ($85 for PDPs versus $50 for employer plans). By contrast, employers charge much higher copays for generic drugs than PDPs charge ($10 versus $2). Thus the spreads between cost sharing for brands and generics and between preferred and non-preferred brand drugs are greater in Medicare Part D plans. Compared to commercial health plans, the typical structure of cost sharing in Part D offers a greater incentive for plan enrollees to choose generics or preferred brand drugs.
Specialty Tiers
Specialty drugs appear to be one of the faster-growing segments of the Part D drug benefit. According to one of the pharmacy benefit managers (PBMs), the growth trend for specialty drugs in Medicare in 2013 was 14.7 percent, compared to no growth for non-specialty drugs.4 The growth for specialty drugs was entirely driven by increases in unit cost, rather than utilization. Although the drugs are expensive, specialty drugs represented only 11 percent of Part D drug spending in 2013.5
Most Part D plans use a specialty tier for high-cost medications in 2014. In 2014, among Part D enrollees in plans using tiered cost sharing, 96 percent of PDP enrollees and 98 percent of MA-PD plan enrollees are in plans with a specialty tier. Specialty tiers are commonly used by Medicare drug plans for relatively expensive drugs (at least $600 per month in 2014—a level that has been unchanged since 2008).
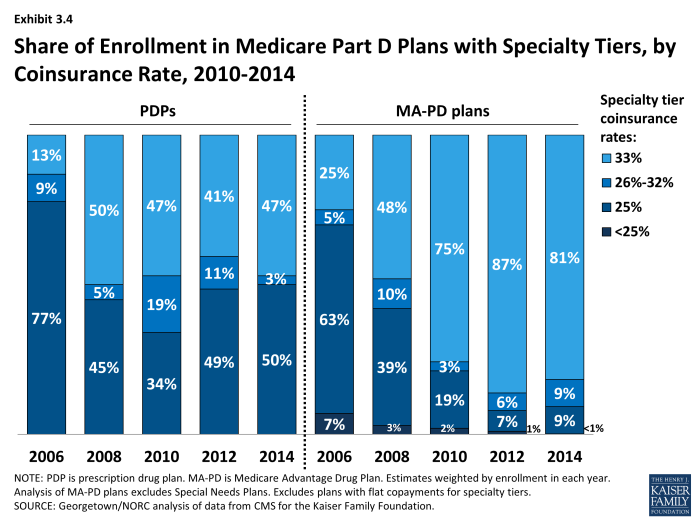
About half of PDP enrollees and most MA-PD plan enrollees are in plans with a 33 percent coinsurance rate for specialty tier drugs. While CMS limits the coinsurance rate for drugs placed on a specialty tier to 25 percent, plans are allowed to impose higher cost sharing (up to 33 percent) for specialty tier drugs if offset by a lower deductible.6 In 2014, about 47 percent of PDP enrollees are in plans charging 33 percent coinsurance for specialty drugs in the initial coverage period (Exhibit 3.4). By contrast, in 2006 only 13 percent of beneficiaries in PDPs with specialty tiers faced a 33 percent coinsurance rate for the specialty tier. In 2014, 81 percent of MA-PD plan enrollees are in plans with 33 percent coinsurance for specialty drugs—well above the 48 percent share in 2008.
Most plans without specialty tiers charge coinsurance for all covered brand-name drugs, including drugs that tend to be placed by other plans on specialty tiers. Cost sharing for specialty drugs in these plans may actually be higher than that in plans with specialty tiers. Only one national PDP (First Health Part D Essentials) has no specialty tier in 2014, instead placing specialty drugs either on a non-preferred brand tier with 43 percent coinsurance or a preferred brand tier with 15 percent coinsurance.
Placing a drug on the specialty tier or on a non-preferred brand tier with high coinsurance can have serious cost implications for plan enrollees, at least before they reach the catastrophic coverage phase of the Part D benefit. A specialty drug priced at the $600 threshold will cost the beneficiary between $150 and $200 per month during the initial coverage period prior to the coverage gap. But monthly cost sharing for other common specialty drugs, such as Copaxone (for multiple sclerosis), Enbrel (for rheumatoid arthritis), Gleevec (for certain cancers), and Truvada (for HIV) can range from $300 to $2,000, before a beneficiary reaches the coverage gap or qualifies for catastrophic coverage. The cost for the first month of Sovaldi, a newly approved drug for hepatitis C, can exceed $5,000.7 For beneficiaries who use specialty drugs and exceed the catastrophic coverage threshold, the cost sharing is lowered to 5 percent of the drug cost for the remainder of the year.
Formularies and Utilization Management
In 2014, the average PDP enrollee is in a plan where the formulary lists 83 percent of all eligible drugs, the same as in 2013 but slightly below the average in prior years. The scope of formulary coverage, however, continues to vary widely across PDPs in 2014. Some plans list all drugs from the CMS drug reference file on their formularies, while other plans list as few as 63 percent of these drugs.8 Even the most limited formularies, however, exceed the formulary requirements established under law and CMS program guidance.9 The seven largest PDPs range in formulary coverage from 73 percent to 92 percent of drugs in the reference file. The average MA-PD plan enrollee is in a plan with slightly more drugs on formulary (87 percent) than PDPs. Beneficiaries retain the option of requesting an exception to have the plan cover an off-formulary drug, or they can obtain the drug by paying the full purchase price out of pocket.
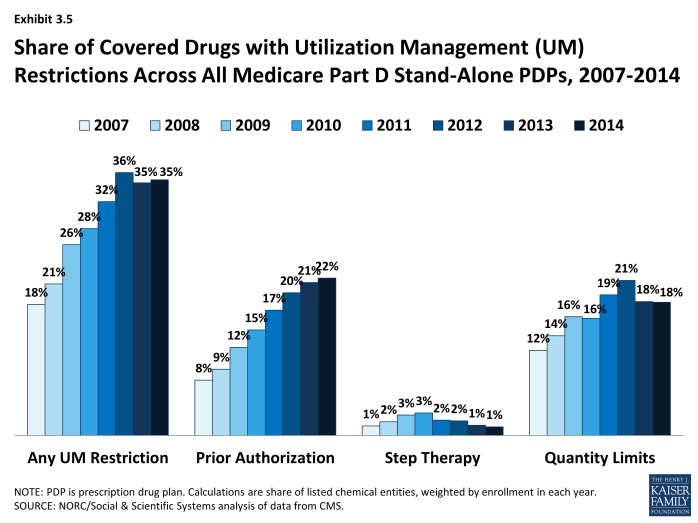
Since 2007, PDPs have applied utilization management (UM) restrictions to an increasing share of on-formulary drugs, increasing from 18 percent in 2007 to 35 percent in 2014 (Exhibit 3.5). Even if a drug is listed on a plan’s formulary, utilization management rules, including step therapy, prior authorization, and quality limits, may restrict a beneficiary’s access to the drug.10 In 2014, more drugs are subject to prior authorization than to other UM tools. On average across all PDPs (weighted for enrollment), prior authorization is applied to 22 percent of drugs. Quantity limits (e.g., limiting a prescription to 30 pills for 30 days) are applied to 18 percent of drugs in 2014, whereas only 1 percent of drugs are subject to step therapy. MA-PD plans tend to apply UM restrictions to a somewhat smaller share of drugs; in particular, they are less likely to apply quantity limits.
The Coverage Gap
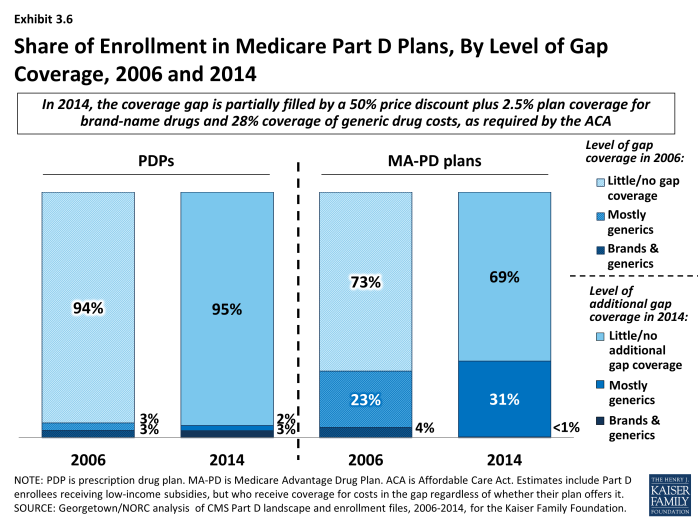
In 2014, most PDPs (82 percent) offer little or no gap coverage beyond what is required by law; PDPs offering extra gap coverage cost more and have attracted fewer enrollees.11 In 2014, beneficiaries reaching the gap pay 47.5 percent of the full price for brand-name drugs in the gap (after a manufacturer price discount of 50 percent and plans paying 2.5 percent), and 72 percent of the cost for generics (plans pay the remaining 28 percent). Under current law, beneficiaries will face average cost sharing of only 25 percent for all drugs in the gap by 2020—the same as in the initial coverage period—effectively eliminating the coverage gap.
In 2014, 95 percent of all PDP enrollees are in plans without additional gap coverage beyond what is required by law (Exhibit 3.6). Overall, however, only 52 percent of PDP enrollees are potentially exposed to the gap in coverage if their spending exceeds the initial coverage limit. This lower percentage reflects the fact that LIS enrollees pay the same modest cost-sharing amounts in the gap as in the initial coverage period. In 2014, the vast majority of non-LIS Part D enrollees (92 percent) are enrolled in PDPs with no gap coverage beyond what is required by the ACA.
A similar share of MA-PD plans (22 percent) and PDPs (18 percent) offer additional gap coverage in 2014 for more than a “few” drugs, but a much larger share of MA-PD plan enrollees than PDP enrollees are in such plans.12 About one-third (31 percent) of MA-PD plan enrollees have at least some additional gap coverage beyond what the ACA requires, a modest increase since 2006 in the share with gap coverage, but considerably lower than the level of gap coverage in 2011 (43 percent) (Exhibit 3.6).13 The higher level of additional gap coverage among enrollees in MA-PD plans occurs largely because Medicare Advantage plans are able to use payments received from the government for providing benefits covered under Parts A and B to reduce cost sharing and premiums under Part D.14 Furthermore, because Medicare Advantage plans cover hospital and physician services and other Medicare benefits, they have stronger incentives than PDPs to offer at least some gap coverage to forestall the negative health and cost consequences that could arise if enrollees do not take their medications when they reach the gap. Despite these incentives, most MA-PD plans offer no additional gap coverage.
The vast majority of Part D enrollees with gap coverage (beyond that required by law) are in plans that cover only some generic drugs in the gap. In 2014, only about 3 percent of PDP enrollees and less than 1 percent of MA-PD plan enrollees have any significant gap coverage for brand-name drugs beyond the 50 percent discount and 2.5 percent payment that all plans must provide. Furthermore, gap coverage that includes all generic drugs (as opposed to a subset of generic drugs) has declined substantially over time. In 2014, only 7 percent of MA-PD plan enrollees and no PDP enrollees are in plans that cover all generics in the gap, compared to 28 percent and 3 percent in 2008.
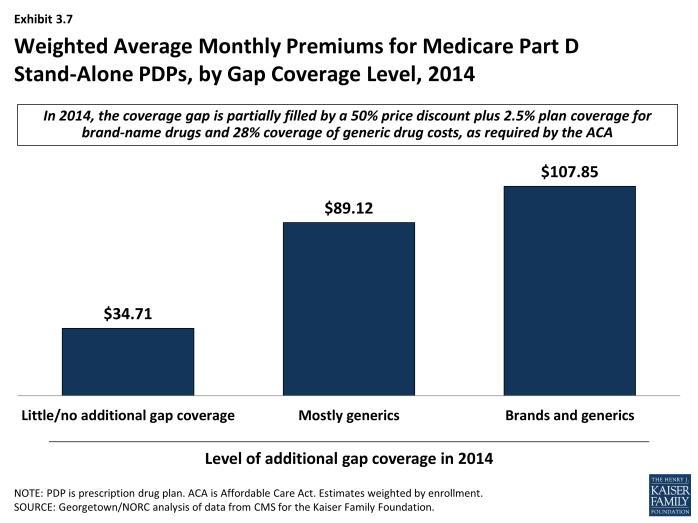
Enrollees in stand-alone Part D plans tend to pay substantially higher premiums for plans with gap coverage (beyond that which is required by law) compared to those without such coverage. On average, the weighted monthly premium for a stand-alone PDP offering additional gap coverage for generic drugs is $89.12, about $54 per month above that for plans offering no gap coverage (Exhibit 3.7).15 Plans with gap coverage for at least some brands are the most expensive, with average premiums of $107.85 for PDPs, which is about $19 per month higher than for PDPs covering only generics in the gap.
Preferred Pharmacy Networks
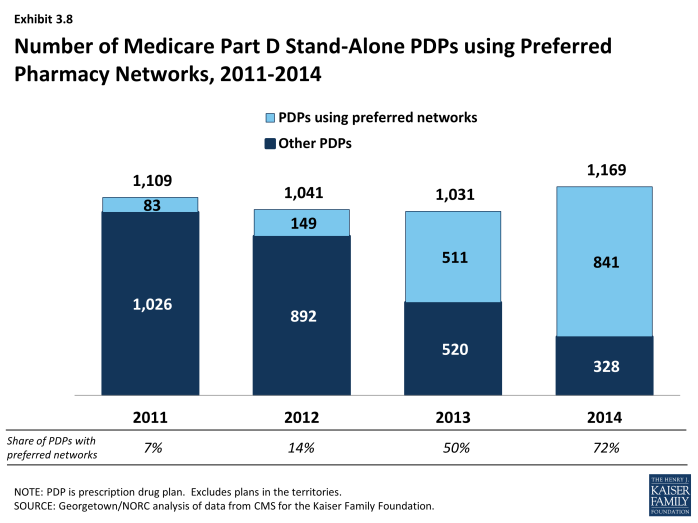
In 2014, 72 percent of all PDPs—representing 75 percent of all enrollees—have a preferred pharmacy network. By contrast, only 7 percent of PDPs (6 percent of enrollees) had a preferred pharmacy network in 2011 (Exhibit 3.8). Enrollees in these plans pay lower cost sharing for their prescriptions if they use preferred pharmacies.16 This new approach to plan design started in 2011 with the market entry of co-branded PDPs featuring relationships with specific pharmacy chains, such as the Humana Walmart-Preferred Rx PDP (new in 2011) and the Aetna CVS/Pharmacy PDP (new in 2012). Many other plan sponsors designated a preferred network in 2013 or 2014, mostly without a co-branded relationship. The idea behind these arrangements is that Part D plans are able to negotiate discounted prices at certain pharmacies in exchange for higher volume of sales. The lower cost sharing creates an incentive for enrollees to use the preferred pharmacies.
For most tiers, the median difference in cost sharing between filling a monthly prescription in a preferred pharmacy versus another network pharmacy is about $5. For example, in the AARP MedicareRx Saver Plus PDP sponsored by UnitedHealth, the copayment for a preferred brand drug is $20 in a preferred pharmacy and $30 in another network pharmacy ($35 versus $50 for other brand drugs). Copayments in the Humana Preferred Rx PDP at a preferred pharmacy are $1 for drugs on the preferred generic tier and $2 for drugs on the non-preferred generic tier, compared to $4 and $6, respectively, at other network pharmacies. Coinsurance differences for this Humana PDP are 20 percent versus 25 percent for a preferred brand drug and 35 percent versus 41 percent for a non-preferred brand drug.
Although the difference in cost for filling a single prescription is modest, the financial consequences for non-LIS Part D plan enrollees if they do not use preferred pharmacies can add up for beneficiaries taking multiple brand-name drugs.17 An enrollee in the AARP MedicareRx Saver Plus PDP who fills two brand drugs and one generic drug per month might pay an extra $252 over the year if she does not use one of the preferred pharmacies.
In 2013 (the most recent available data), PDPs with preferred pharmacy networks designated only about 30 percent of their network pharmacies as preferred.18 The share of preferred pharmacies in these PDPs ranged from 9 percent to 44 percent of network pharmacies. Overall, access to pharmacies is high. Most PDPs contract with at least 95 percent of all available pharmacies in their full pharmacy network. But generally plan sponsors do not offer the preferred terms to all pharmacies in their networks.
Limited information is available on the share of plan enrollees who fill prescriptions at preferred pharmacies. A CMS analysis of 2012 claims data found that the share of retail claims in preferred pharmacies ranged from 19 percent to 79 percent across 13 plans. For 7 of the 13 plans, the share of claims in preferred pharmacies was 37 percent or less.19
For some PDPs, access to preferred pharmacies is geographically limited. In some plans, there is no preferred pharmacy within a reasonable travel distance. A look at preferred pharmacies in 2014, using 14 sample zip codes, shows how the smaller network of preferred pharmacies affects beneficiaries. At a distance that corresponds roughly to how far consumers might expect to travel to a pharmacy,20 enrollees in the plans with preferred pharmacy networks typically find that a smaller share of local pharmacies are in the preferred networks: from zero percent to 22 percent of all network pharmacies, depending on the community. Furthermore, the level of access varies considerably by plan. Enrollees in the basic-benefit PDP with the most enrollees in 2014 (Humana’s Preferred Rx PDP) have no preferred pharmacy that is relatively close in 8 of the 14 sample zip codes and only one in the other six zip codes, whereas the second largest basic-benefit plan (UnitedHealth’s AARP Medicare Rx Saver Plus PDP) has no preferred pharmacy in only 3 of 14 zip codes. By expanding their potential travel distance, plan enrollees can reach more preferred pharmacies. But even at this greater distance, Humana’s PDP (which relies solely on Walmart pharmacies) still has no nearby preferred pharmacy in three urban zip codes.
In the call letter issued in April 2014, CMS indicated that it has contracted for a study of beneficiary access to different types of pharmacies.21 In addition, it will monitor pharmacy networks and take action against plan sponsors with too little meaningful access to the pharmacies that offer preferred cost sharing.
Premiums increased from 2013 to 2014 for nearly all PDPs with preferred pharmacy networks. Proponents of this new model of Part D plan point to lower premiums as a sign of their role in holding down Part D costs. One study found that preferred pharmacy networks could reduce federal spending considerably as a result of lower premiums.22 In fact, savings depend on the degree of discounts negotiated with pharmacies, the difference in cost sharing, and the share of beneficiaries who use the preferred pharmacies. Premium trends from 2013 to 2014, however, do not show clear evidence of savings. Whereas the average PDP premium fell by 2 percent from 2013 to 2014, all but one of the national or near-national PDPs with preferred pharmacy networks raised premiums, and most did so by at least 10 percent.

