
Implementing Coverage and Payment Initiatives: Results from a 50-State Medicaid Budget Survey for State Fiscal Years 2016 and 2017
Managed Care Initiatives
| Key Section Findings |
Tables 5 through 9 include more detail on the populations covered under managed care (Tables 5 and 6), behavioral health services covered under MCOs (Table 7), managed care quality initiatives (Table 8), and MLR (Table 9).
|
Managed care remains the predominant delivery system for Medicaid in most states. As of July 2016, all states except three – Alaska, Connecticut and Wyoming– had in place some form of managed care.2 Across the 48 states with some form of managed care, 39 had contracts with comprehensive risk-based managed care organizations (MCOs), unchanged from July 1, 2015. Three states (Iowa, Rhode Island, and West Virginia) reported ending their Primary Care Case Management (PCCM) programs leaving 16 states that administered a PCCM program as of July 1, 2016, down from 19 states a year earlier. PCCM is a managed fee-for-service (FFS) based system in which beneficiaries are enrolled with a primary care provider who is paid a small monthly fee to provide case management services in addition to primary care.
Of the 48 states that operate some form of managed care, seven operate both MCOs and a PCCM program while 32 states operate MCOs only and nine states operate PCCM programs only3 (Figure 3). Wyoming, one of the three states without any managed care (i.e., without either MCOs or a PCCM program), does operate a limited-benefit risk-based prepaid health plan (PHP). In total, 24 states (including Wyoming) contracted with one or more PHPs to provide selected Medicaid benefits, such as behavioral health care, dental care, maternity care, non-emergency medical transportation, LTSS, or other benefits.
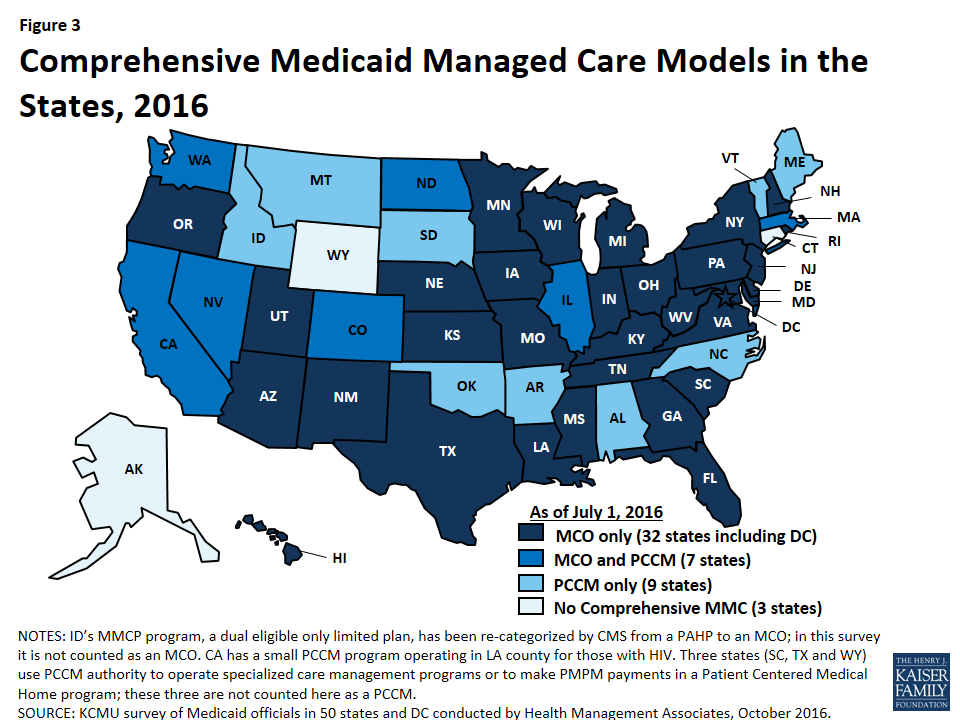
Figure 3: Comprehensive Medicaid Managed Care Models in the States, 2016
Populations Covered by Risk-Based Managed Care
The share of Medicaid beneficiaries enrolled in MCOs or PCCM programs or remaining in FFS for their acute care varies widely by state. However, the share of Medicaid beneficiaries enrolled in MCOs has steadily increased as states have expanded their managed care programs to new regions and new populations and made MCO enrollment mandatory for additional eligibility groups. The survey asked states to indicate the approximate share of specific Medicaid populations who receive their acute care in MCOs, PCCM programs, and FFS. As shown in Figure 4, among the 39 states with MCOs, 28 states reported that 75 percent or more of their Medicaid beneficiaries were enrolled in MCOs as of July 1, 2016 (up from 21 states in last year’s survey), including four of the five states with the largest total Medicaid enrollment. These four states (California, New York, Texas, and Florida) account for nearly four out of every 10 Medicaid beneficiaries across the country (Figure 4 and Table 5).4
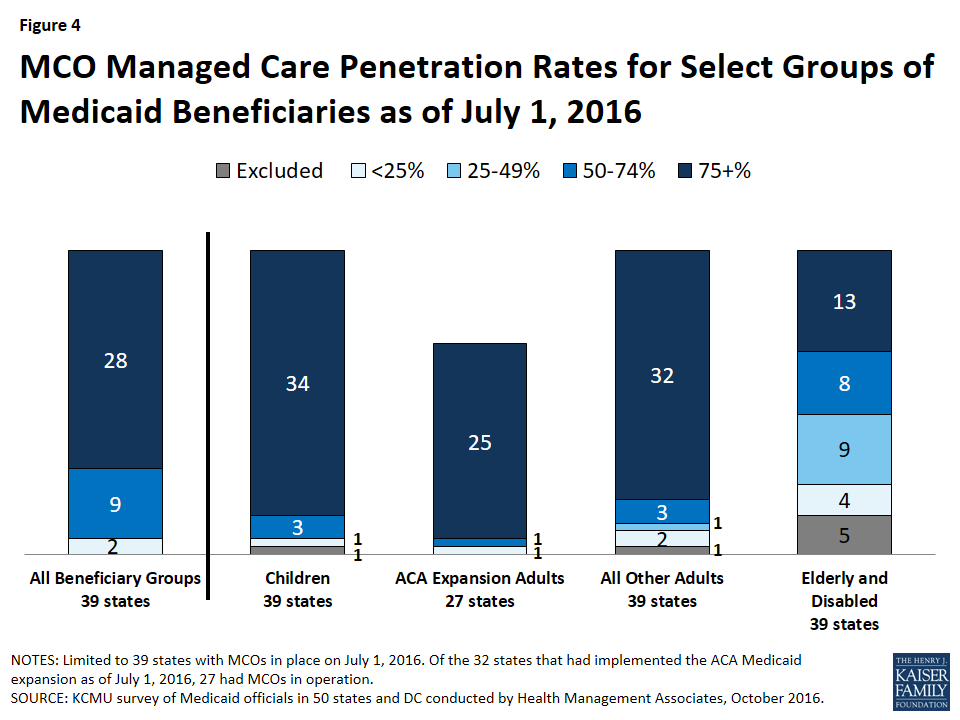
Figure 4: MCO Managed Care Penetration Rates for Select Groups of Medicaid Beneficiaries as of July 1, 2016
Children and adults (particularly those enrolled through the ACA Medicaid expansion) are much more likely to be enrolled in an MCO than elderly Medicaid beneficiaries or those with disabilities. Thirty-four (34) of the 39 MCO states covered 75 percent or more of all children through MCOs. Thirty-two (32) of the 39 MCO states covered 75 percent or more of low-income adults in pre-ACA expansion groups (e.g., parents, pregnant women) through MCOs. The elderly and people with disabilities were the group least likely to be covered through managed care contracts, with only 13 of the 39 MCO states covering 75 percent or more such enrollees through MCOs (Figure 4).
Of the 32 states that had implemented the ACA Medicaid expansion as of July 1, 2016, 27 were using MCOs to cover newly eligible adults. (The five Medicaid expansion states without risk-based managed care were Alaska, Arkansas, Connecticut, Montana, and Vermont.) The large majority (25) of these 27 states covered more than 75 percent of beneficiaries in this group through risk-based managed care. The remaining two states, which reported less than 75 percent MCO penetration for this group, were Colorado and Illinois.
Seven of the 16 states with PCCM programs also contract with MCOs. In most of these states, MCOs cover a larger share of beneficiaries than PCCM programs. However, Colorado and North Dakota are exceptions: as of July 1, 2016, a majority of Colorado’s enrollees were in the PCCM program, which is the foundation of the state’s Accountable Care Collaboratives, and approximately half (49 percent) of enrollees in North Dakota were enrolled in the PCCM program.
Populations with Special Needs
This year’s survey also asked states with MCOs whether, as of July 1, 2016, certain subpopulations with special needs were enrolled in MCOs for their acute care services on a mandatory or voluntary basis or were always excluded. On the survey, states selected from “always mandatory,” “always voluntary,” “varies (by geography or other factor),” or “always excluded” for the following populations: pregnant women, foster children, persons with intellectual and developmental disabilities (ID/DD), children with special health care needs (CSHCNs), adults with serious mental illness (SMI) and adults with physical disabilities. As shown in Exhibit 2 (and Table 6) below, pregnant women were the group most likely to be enrolled on a mandatory basis (28 states) while persons with ID/DD were least likely to be enrolled on mandatory basis (10 states) and also most likely to be excluded from MCO enrollment (7 states). Foster children were the group most likely to be enrolled on a voluntary basis (10 states) (although they were enrolled on a mandatory basis in a larger number of states).
Among states indicating that the enrollment approach for a given group or groups varied, geographic location and LTSS eligibility were the primary bases of variation. Six states (Colorado, Illinois, Missouri, Nevada, Utah, and Washington) specifically mentioned geographic variations and five states (Indiana, Kentucky, Louisiana, Ohio, and Texas) mentioned variations based on LTSS eligibility (or “level of care”).
| Exhibit 2: MCO Enrollment of Populations with Special Needs, July 1, 2016 (# of States) |
||||||
| Pregnant women | Foster children | Persons with ID/DD | CSHCNs | SMI Adults | Adults w/ physical disabilities | |
| Always mandatory5 | 28 | 16 | 10 | 16 | 16 | 16 |
| Always voluntary | 1 | 10 | 7 | 3 | 3 | 3 |
| Varies (by geography or other factor) | 9 | 10 | 15 | 18 | 17 | 15 |
| Always excluded | 1 | 3 | 7 | 2 | 3 | 5 |
Acute Care Managed Care Population Changes
In both FY 2016 and FY 2017, states continued to take actions to increase enrollment in acute care managed care, although fewer states reported doing so than in the last two surveys (in 2014 and 2015) reflecting full or nearly full MCO saturation in a growing number of states. Of the 39 states with MCOs, a total of 16 states indicated that they made specific policy changes in either FY 2016 (11 states) or FY 2017 (11 states) to increase the number of enrollees in MCOs through geographic expansions, voluntary or mandatory enrollment of new groups into MCOs, or mandatory enrollment of specific eligibility groups that were formerly enrolled on a voluntary basis (Exhibit 3).
| Exhibit 3: Medicaid Acute Care Managed Care Population Expansions, FY 2016 and FY 2017 | ||
| FY 2016 | FY 2017 | |
| Geographic Expansions | IA, MS, UT | AL, CO, MS, MO |
| New Population Groups Added | CA, IA, LA, MS, NE, NY, WA, WV | AL, LA, NE, OH, RI, TX, UT, WV |
| Voluntary to Mandatory Enrollment | NH, RI, UT | |
Some of the notable acute care MCO expansions include:
- Three states (Iowa, Rhode Island, and West Virginia) terminated their PCCM programs in FY 2016 and shifted those populations into risk-based managed care. Iowa implemented statewide MCO coverage for almost all Medicaid enrollees on April 1, 2016 and ended its PCCM and behavioral health PHP programs.6 Rhode Island eliminated its PCCM program for adults with disabilities (Connect Care Choice) in FY 2016 and transitioned the enrollees to MCOs. West Virginia ended its small PCCM program and also transitioned its SSI population from FFS to mandatory MCO enrollment in July 2016.
- Alabama plans to implement mandatory MCO enrollment for nearly all Medicaid enrollees (currently served through PCCM and FFS) in FY 2017, although the state recently requested CMS approval to delay implementation until July 1, 2017.7 (Alabama’s fiscal year ends on September 30.)
- Missouri will extend its MCO program geographically statewide on May 1, 2017 for the populations eligible for managed care under current rules.
Geographic expansions of MCO service areas were reported in three states in FY 2016 (Iowa, Mississippi, and Utah), and in four states for FY 2017 (Alabama, Colorado, Mississippi, and Missouri).
In FY 2016 and FY 2017, states expanded MCO enrollment (either voluntary or mandatory) to additional groups. Some states added multiple groups. Some groups that states added or are planning to add include: foster care or adoption assistance children (Louisiana, Nebraska, Ohio, and Texas); persons eligible for LTSS (Nebraska, New York, and Washington); ACA expansion, newly eligible adult group (Louisiana and West Virginia); Breast and Cervical Cancer Treatment Program group (Ohio and Texas); children with special health care needs (Louisiana and Ohio); pregnant women (California); Native Americans (Louisiana); children (Mississippi); SSI population (West Virginia); persons with intellectual and developmental disabilities (Ohio).
Three states made enrollment mandatory in FY 2016 for specific eligibility groups that were formerly enrolled on a voluntary basis: New Hampshire (dual eligibles, disabled children, and foster care children), Rhode Island (SSI), and Utah (enrollees in nine new mandatory counties).
Although outside the period covered by this survey report, Oklahoma reported plans to implement risk-based managed care for the aged, blind, and disabled population after FY 2017.
Services Covered Under MCO Contracts
Behavioral Health Services Covered Under MCO Contracts
Although MCOs are at risk financially for providing a comprehensive set of acute care services, nearly all states exclude or “carve-out” certain services from their MCO contracts, most commonly behavioral health services. In this year’s survey, states with acute care MCOs were asked to indicate whether specialty outpatient mental health services, inpatient mental health services, and outpatient and inpatient substance use disorder (SUD) services are always carved-in (i.e., virtually all services are covered by the MCO), always carved-out (to PHP or FFS), or carve-in status varies by geographic or other factors.
For purposes of this survey, “specialty outpatient mental health” services mean services used by adults with Serious Mental Illness (SMI) and/or youth with serious emotional disturbance (SED), commonly provided by specialty providers such as community mental health centers. Depending on the service, about half of the 39 MCO states reported that specific behavioral health service types were carved into their MCO contracts, with specialty outpatient mental health services somewhat less likely to be carved in (Exhibit 4 and Table 7).
Of the nine states that indicated variation in the carve-in status of some behavioral health services, Texas and Washington cited geographic variation for all four service types; Ohio and Virginia indicated that outpatient mental health and SUD services were carved in only for dual eligibles in their Financial Alignment Demonstrations; Arizona reported that all four service types were carved out for children with a severe emotional disturbance; Missouri indicated variation based on diagnosis for children; New Jersey stated that inpatient medical detoxification services were always carved in while non-medical detoxification and short-term residential treatment for SUD were always carved out; South Carolina mentioned variation in specialty outpatient mental health services based on eligibility category, and also reported that psychiatric services in a freestanding hospital or dedicated unit are carved out, but psychiatric care during a hospital stay is carved in, and Wisconsin indicated that some specialty outpatient mental health services are carved in while others are carved out.
| Exhibit 4: MCO Coverage of Behavioral Health, July 1, 2016 (# of States) |
||||
| Specialty Outpatient MH | Inpatient MH | Outpatient SUD | Inpatient SUD | |
| Always carved-in | 20 | 24 | 24 | 26 |
| Always carved-out | 12 | 10 | 9 | 8 |
| Varies (by geography or other factor) | 7 | 5 | 6 | 5 |
Seven states in both FY 2016 (Arizona, Louisiana, New Hampshire, New York, Rhode Island, Washington, and West Virginia) and FY 2017 (Alabama, Nebraska, New York, Rhode Island, South Carolina, Virginia and Washington) reported a new action to carve in, or plans to carve in, behavioral health services into their MCO contracts. Also, Wisconsin reported that, in an effort to promote care coordination, beginning in FY 2016, members receiving medication-assisted treatment for opioid addiction are no longer exempt from managed care enrollment, except for continuity of care reasons.
Institutions for Mental Diseases (IMD) Rule Change
The recently finalized Medicaid Managed Care final rule8 allows states (under the authority for health plans to cover services “in lieu of” those available under the Medicaid state plan), to receive federal matching funds for capitation payments on behalf of adults who receive inpatient psychiatric or substance use disorder treatment or crisis residential services in an IMD for no more than 15 days in a month.9
States were asked in the survey whether they planned to use this new authority. Of the 39 states with MCOs plus Alabama (which plans to implement MCOs in FY 2017), 16 states answered “yes,” six answered “no,” and 18 states said a decision had not yet been made. Maryland said “no” but indicated that the state had applied for an IMD waiver to offer residential services for persons with an SUD diagnosis.
Additional Services
States with MCO contracts reported that plans in their states may offer a range of services beyond those described in the state plan or waivers. Twelve (12) states reported that MCOs in their states provide limited or enhanced adult dental services beyond contractually required state plan benefits. Nine states reported enhanced vision services for adults. Vermont reported enhanced mental health and substance use disorder services and the District of Columbia reported telemedicine for behavioral health services. States also reported a wide range of other extra services, including car seats, wireless cell phones or smart phone applications, gym memberships, smoking cessation supports, nutrition education, transportation, adult vaccines, health and wellness outreach centers, equine therapy, and Native American healing benefits. Some states (including Arizona and California) reported that MCOs are not required to report non-covered services to the state, but have the discretion to offer them when the plan judges an additional service to be beneficial and cost-effective. New Mexico allows MCOs to provide additional services, subject to state approval.
Managed Care Quality, Contracts Requirements and Administration
Quality Initiatives
States procure MCO contracts using different approaches. States may set a capitation rate that meets the test of actuarial-soundness and contract with any MCO willing to meet state and federal requirements. Most states now competitively bid for Medicaid MCOs, in part because the dollar value is so large – in some cases the largest procurement ever undertaken by the state. In these procurements, states can specify requirements and criteria that go beyond price such as value-based payments, specific policy priorities such as improving birth outcomes, or strategies to address social determinants of health, as well as specific performance and quality criteria. In this year’s survey, states were asked if they used, or planned to use, National Committee for Quality Assurance’s (NCQA’s) Healthcare Effectiveness Data and Information Set (HEDIS®) scores as criteria for selecting MCOs to contract with. Of the 39 states with MCOs, 14 answered “yes.”
After contracts are procured, all states with MCO programs track one or more quality measures and require other health plan activities to improve health care outcomes and plan performance. States were asked to indicate whether they had selected quality strategies in place in FY 2015, to establish a baseline, and also to indicate newly added or expanded initiatives in FY 2016 or FY 2017. Thirty-six (36) of the 39 MCO states reported one or more select MCO quality initiatives in place in FY 2015. The most common strategies were the collection of adult and child quality measures and pay for performance (Figure 5 and Table 8).
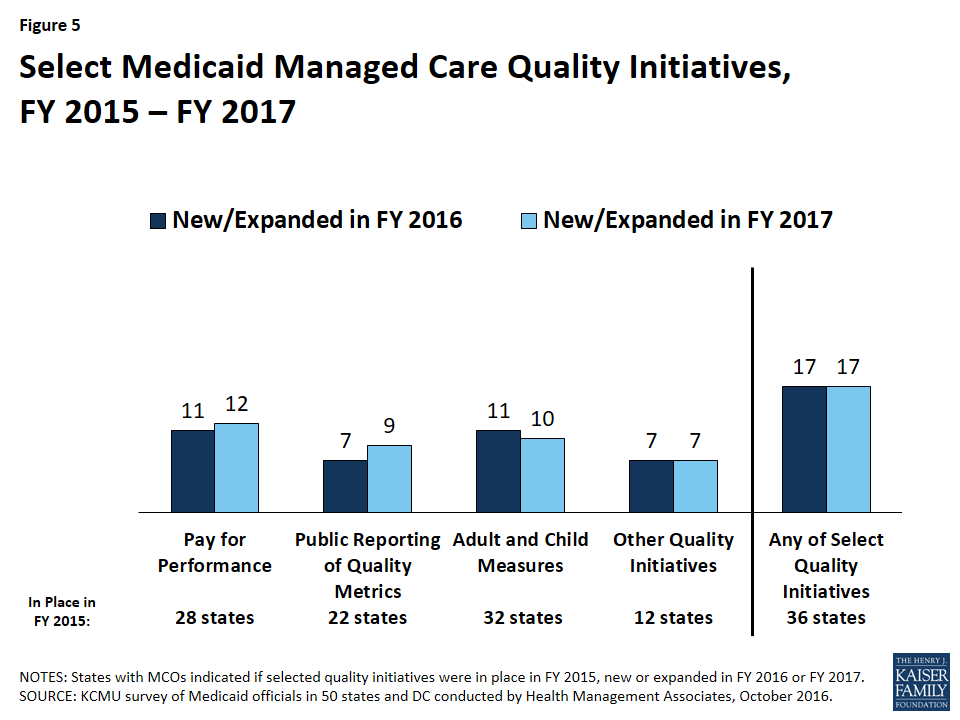
Figure 5: Select Medicaid Managed Care Quality Initiatives, FY 2015 – FY 2017
In FY 2016, 17 states implemented new or expanded quality initiatives and 17 states plan to do so in FY 2017 (Figure 5 and Table 8). Of the 39 MCO states, a total of 38 states in FY 2016 and all 39 states in FY 2017 will have at least one of these initiatives in place. The most common new quality initiatives were pay for performance and use of quality measures pulled from CMS’s core measure sets for adults and children (which are available but not mandatory for states to use).
States were also asked if capitation withholds in MCO contracts were in place in FY 2015, added in FY 2016, or planned for FY 2017. Twenty (20) states indicated withholds were in place as of FY 2015. States were also asked to specify what share of MCO capitation payments were withheld in FY 2016 and FY 2017. One state added a new MCO capitation payment withhold tied to quality performance in FY 2016 (Iowa) and three states intend to add a new MCO withhold in FY 2017 (Alabama, DC, and Oregon). Withhold amounts typically ranged from 1 percent (Massachusetts, Michigan, Texas, and Washington) to 5 percent (Georgia, West Virginia, and Minnesota). Tennessee reported using withholds in a range from 2.5 percent to 10 percent.
Contract Requirements
Alternative [Provider] Payment Models (APM) within MCO Contracts
Alternative provider payment models to advance value-based purchasing (VBP) strategies are a sharp focus of Medicaid programs, as states pursue improved quality and outcomes and reduced costs of care within Medicaid and across payers. Many states have included a focus on adopting and promoting alternative provider payment models as part of their State Innovation Models (SIM) projects, and some states have considered specifically how Medicaid MCOs can play a part in achieving improved accountability in the health care delivery system.10 The survey found that:
- Five states (Arizona, Delaware, Hawaii, Iowa, and South Carolina) identified a specific target in their MCO contracts for the percentage of provider payments, network providers, or plan members that plans must cover via alternative provider payment models in FY 2016; and
- Ten (10) additional states (California, Kansas, Louisiana, Michigan, Nebraska, New York, Oregon, Pennsylvania, Rhode Island, and Virginia) intend to include a target percentage in their contracts for FY 2017.
Further, 12 states had contracts that encouraged or required Medicaid MCOs to adopt alternative provider payment models in FY 2016, with eight additional states intending to encourage or require alternative provider payment arrangements within MCOs in FY 2017. The following box provides state examples of alternative provider payment targets.
| Alternative Provider Payment Targets |
|
Social Determinants of Health
In 2016, the CMS Center for Innovation announced a new Accountable Health Community model that represents the first CMS innovation model that focuses on social determinants of health. The goal of the five-year program is to raise awareness of and access to community-based services for Medicaid and Medicare beneficiaries.11 This development reflects growing awareness and interest on the part of CMS to seek improved health outcomes and reduced costs by linking beneficiaries to social services and supports to address issues such as housing and food insecurity, among others, that can impact the ability of individuals to achieve health goals. States have also been focused on addressing social determinants of health, so federal and state activity are occurring simultaneously.
The survey found that 26 of the 39 states that contract with MCOs required or encouraged plans to screen enrollees for social needs and provide referrals to other services in FY 2016. Several states required MCOs to perform a health needs/risk assessment that includes information on social needs as well as medical needs. The following box provides state examples.
| Strategies to Address Social Determinants of Health |
|
Four states (Hawaii, Maryland, Nebraska, and New York) plan to require or encourage MCOs to screen and/or refer to social services and other programs in FY 2017. For example, Nebraska will require all MCO staff to be trained on how social determinants affect members’ health and wellness, including issues related to housing, education, food, physical and sexual abuse, violence, and risk and protective factors for behavioral health concerns.
Criminal Justice Involved Populations
Five of the 39 states with MCO contracts encourage or require MCOs to provide care coordination services to enrollees prior to release from incarceration (Arizona, Iowa, Kentucky, New Mexico, and Ohio), and 10 states intend to add such requirements in FY 2017. Ohio described a system in which pre-release care coordination is provided for enrollees with serious health conditions. An MCO care manager develops a care-focused transition plan to help facilitate access to needed services in the community, and a videoconference is conducted as a means to establish a relationship between the enrollee and the care manager. The care manager will follow up with the enrollee post-release to identify and remove barriers to care. Arizona noted that, in CY 2016, the requirement for pre-release care coordination services were limited to the behavioral health carve-out plan, but indicated that it would be extended to apply to all MCOs in CY 2017. In the letter approving the Arizona waiver on September 30, 2016, CMS said they would continue to work with Arizona on the delivery system reforms to integrate physical and behavioral health for Medicaid beneficiaries leaving the justice system.
While Florida does not require MCOs to provide pre-release care coordination, the state has a multi-agency project in place to implement pre-release care coordination to incarcerated Medicaid enrollees.
Administrative Policies
Minimum Medical Loss Ratios
The proportion of total capitation payments received by an MCO that is spent on clinical services and quality improvement is known as the Medical Loss Ratio (MLR). In 2016, CMS published a final rule that requires states to develop capitation rates for Medicaid so as to achieve an MLR of at least 85 percent in the rate year.12 This is consistent with the minimum MLR established in the ACA for commercial health plans in the Marketplace and for small group and individual plans in the private market and with the minimum MLR applied to Medicare Advantage plans. There is no federal requirement that states require Medicaid plans to remit payment if they fail to meet the MLR standard, but states have discretion to require remittances. The minimum MLR requirement for Medicaid takes effect for rating periods and contracts starting on or after July 1, 2017.13
As of July 1, 2016, 20 of the 39 states that contract with comprehensive risk-based MCOs already specified a minimum MLR. Eighteen (18) of these 20 states applied the MLR requirement to all MCO contracts, while two states applied it on a limited basis (in Virginia, for the Financial Alignment Demonstration (FAD) only; in Massachusetts, for the Senior Care Options (SCO) program only). Thirteen (13) of the 20 states with minimum MLR requirements always require remittance payments to the state if the minimum MLR is not achieved; three states require remittances under some circumstances.
Medicaid MLRs vary by state but are most commonly set at 85 percent. A few states noted that their minimum MLRs varied by type of plan or population. For example, in New Jersey, the MLR is calculated separately for each population covered. Fourteen (14) states count some or all care management costs as medical (rather than administrative) expenses in the calculation of the MLR. For example, New Mexico spells out a broad set of activities that can be counted as medical expenses, including face-to-face and telephonic interactions between a care coordinator and a member; comprehensive needs assessment, development of a care plan, case management, health education, disease management, and costs associated with Community Health Workers.
Table 9 provides state-specific information regarding the use of a minimum MLR.
Auto-Enrollment
Generally, beneficiaries who are required to enroll in MCOs must be offered a choice of at least two plans. Those who do not select a plan are auto-enrolled in a plan by the state. The proportion of MCO beneficiaries who are auto-enrolled, which may reflect the level of consumer understanding and engagement or design aspects of the managed care program, varies widely across states. Three of the 39 states with MCOs had auto-enrollment rates of 10 percent or less (Georgia, New York, and Pennsylvania) while seven states auto-enrolled 75 percent or more of new MCO enrollees.14 State auto-enrollment algorithms also vary, but they are usually designed to take into consideration previous plan or provider relationships, geographic location of the beneficiary, and/or plan enrollments of other family members. In addition, over half (23) of MCO states reported that their auto-enrollment algorithms were designed to balance enrollments among plans.
As of July 1, 2016, 10 states took plan quality rankings into consideration in the auto-enrollment algorithm, and Illinois plans to incorporate plan quality into its auto-enrollment algorithm during CY 2017 (Exhibit 5). This is an increase from eight states a year earlier. California noted that it makes auto-assignments based in part on MCO compliance with encounter data reporting requirements and plan inclusion of safety net providers in their provider networks. Michigan reported incorporating MCO performance on the Consumer Assessment of Healthcare Providers and Systems (CAHPS) survey.15 Exhibit 5 shows use of selected components in state auto-enrollment algorithms.
| Exhibit 5: Select Factors Used in State Auto-Enrollment Algorithms, as of July 2016 | ||
| # of States | States | |
| Balancing Enrollment | 23 | DC, DE, HI, IA, IL, KS, KY, MA, MD, MO, MS, NE, NM, NV, NY, PA, RI, SC, TN, TX, UT, WI, WV |
| Quality | 10 | CA, GA, LA, MI, MN, NM, NY, OH, SC, WA |
| Encouraging New Plan Entrants | 1 | HI |
PCCM and PHP Program Changes
Primary Care Case Management (PCCM) Program Changes
Of the 16 states with PCCM programs, three reported enacting policies to increase PCCM enrollment in FY 2016 or FY 2017: Colorado reported continued growth in its PCCM-based Accountable Care Collaboratives in both FY 2016 and FY 2017; Montana enrolled its ACA expansion population into its PCCM program in FY 2016, and Massachusetts allowed members in the CarePlus (ACA expansion) program, who were previously required to enroll in an MCO, to enroll in either the Primary Care Clinician plan (PCCM) or an MCO. Also, Alaska – one of only three states without either an MCO or PCCM program as of July 1, 2016 – reported plans to implement a PCCM program in FY 2017.
In contrast, five states (Alabama, Iowa, Rhode Island, Washington, and West Virginia) have taken actions to decrease enrollment in their PCCM programs in FY 2016 or FY 2017. Four of these states (Alabama, Iowa, Rhode Island, and West Virginia) ended or plan to end their PCCM programs and transition PCCM enrollees to risk-based managed care. Nevada stated that it was evaluating the cost-effectiveness of its PCCM program before making any policy changes and Oregon reported that it was working with nine federally recognized tribes to determine whether to pursue PCCM for tribal members and Tribal Health Centers.
Limited-Benefit Prepaid Health Plans (PHP) Changes
In this year’s survey, the 24 states contracting with at least one PHP as of July 1, 2016, were asked to indicate the services provided under these arrangements. As shown in Exhibit 6 below, the most frequently cited services provided were outpatient behavioral health services (13 states) and inpatient behavioral health services (12 states), followed by substance use disorder treatment and non-emergency medical transportation (NEMT) (10 states each). “Other” services reported included maternity care (Alabama), primary care (Colorado), behavioral health-related “diversionary” services (Massachusetts), incontinence supplies and vision care (Wisconsin), and mental health wrap-around services for children with emotional disturbances (Wyoming).
| Exhibit 6: Services Covered Under PHP Contracts, July 1, 2016 | ||
| # of States | States | |
| Outpatient Behavioral Health | 13 | AZ, CA, CO, HI, ID, MA, MI, NC, NE, PA, TX, UT, WA |
| Inpatient Behavioral Health | 12 | AZ, CA, CO, HI, MA, MI, NC, NE, PA, TX, UT, WA |
| Outpatient Substance Use Disorder Treatment | 10 | AZ, CO, ID, MA, NC, NE, PA, TX, UT, WA |
| Inpatient Substance Use Disorder Treatment | 10 | AZ, CO, MA, MI, NC, NE, PA, TX, UT, WA |
| Non-Emergency Medical Transportation (NEMT) | 10 | IA, KY, ME, MI, NJ, NV, RI, TX, UT, WI |
| Dental | 7 | IA, ID, LA, MI, RI, TX, UT |
| Long-Term Services and Supports | 5 | ID, MI, NC, NY, WI |
| Other | 5 | AL, CO, MA, WI, WY |
Four states reported implementing policies to increase PHP enrollment in FY 2016 or FY 2017. Michigan expanded or will expand its dental PHP program to additional counties in both FY 2016 and FY 2017. In FY 2017, California is implementing a waiver to provide substance use disorder services under a county-based PHP arrangement;16 Colorado implemented a primary care PHP in one region; Indiana is planning to implement an NEMT PHP. While not counted in this report as an expansion, Massachusetts noted that allowing newly eligible adults to enroll in the PCCM program could also result in higher enrollment in its behavioral health PHP. Also, Arkansas and Nevada are planning to implement dental PHPs in FY 2018.
Five states also reported actions to decrease PHP enrollment in FY 2016 or FY 2017. Four states reported ending a PHP and folding the covered services into MCO contracts – Iowa (behavioral health) in FY 2016 and Alabama (maternity care), Nebraska (behavioral health), and Texas (behavioral health) in FY 2017. Also, Washington reported that PHP enrollment decreased in FY 2016 and will decrease further in FY 2017 when the state converts behavioral health PHPs to fully integrated MCO contracts in two counties.
Table 5: Share of the Medicaid Population Covered Under Different Delivery Systems in all 50 States and DC, as of July 1, 2016
| States | Type(s) of Managed Care In Place | Share of Medicaid Population in Different Managed Care Systems | ||
| MCO | PCCM | FFS / Other | ||
| Alabama | PCCM | — | 65.7% | 34.4% |
| Alaska | FFS | — | — | 100.0% |
| Arizona | MCO | 92.8% | — | 7.2% |
| Arkansas | PCCM | — | NR | NR |
| California | MCO and PCCM* | 84.6% | — | 15.4% |
| Colorado | MCO and PCCM* | 8.6% | 77.2% | 14.2% |
| Connecticut | FFS* | — | — | 100.0% |
| Delaware | MCO | >90% | — | <10% |
| DC | MCO | 76.0% | — | 24.0% |
| Florida | MCO | 93.0% | — | 7.1% |
| Georgia | MCO | 69.0% | — | 31.0% |
| Hawaii | MCO | 99.9% | — | <0.1% |
| Idaho | PCCM* | — | 93.0% | 7.0% |
| Illinois | MCO and PCCM | 63.4% | 11.5% | 25.1% |
| Indiana | MCO | 79.0% | — | 21.0% |
| Iowa | MCO | 96.0% | — | 4.0% |
| Kansas | MCO | 95.0% | — | 5.0% |
| Kentucky | MCO | 91.0% | — | 9.0% |
| Louisiana | MCO | 70.0% | — | 30.0% |
| Maine | PCCM | — | NR | NR |
| Maryland | MCO | 80.0% | — | 20.0% |
| Massachusetts | MCO and PCCM | 53.5% | 26.0% | 20.5% |
| Michigan | MCO | 75.0% | — | 25.0% |
| Minnesota | MCO | 75.0% | — | 25.0% |
| Mississippi | MCO | 70.0% | — | 30.0% |
| Missouri | MCO | 51.2% | — | 48.8% |
| Montana | PCCM | — | 71.0% | 29.0% |
| Nebraska | MCO | 77.0% | — | 23.0% |
| Nevada | MCO and PCCM | 77.0% | 6.9% | 16.0% |
| New Hampshire | MCO | 95.7% | — | 4.3% |
| New Jersey | MCO | 94.6% | — | 5.4% |
| New Mexico | MCO | 88.2% | — | 11.8% |
| New York | MCO | 77.1% | — | 22.9% |
| North Carolina | PCCM | — | 80.3% | 19.7% |
| North Dakota | MCO and PCCM | 22.0% | 49.0% | 29.0% |
| Ohio | MCO | 88.0% | — | 12.0% |
| Oklahoma | PCCM | — | 74.8% | 25.2% |
| Oregon | MCO* | 85.7% | — | 14.3% |
| Pennsylvania | MCO | 82.8% | — | 17.2% |
| Rhode Island | MCO | 90.0% | — | 10.0% |
| South Carolina | MCO* | 72.7% | — | 27.3% |
| South Dakota | PCCM | — | 80.0% | 20.0% |
| Tennessee | MCO | 100.0% | — | — |
| Texas | MCO* | 88.0% | — | 12.2% |
| Utah | MCO | 81.5% | — | 18.5% |
| Vermont | PCCM | — | >90% | <10% |
| Virginia | MCO | 83.0% | — | 17.0% |
| Washington | MCO and PCCM | 83.0% | 2.0% | 15.0% |
| West Virginia | MCO | 63.0% | — | 36.0% |
| Wisconsin | MCO | 67.0% | — | 33.0% |
| Wyoming | FFS* | — | — | 100.0% |
| NOTES: NR – not reported. Share of Medicaid Population that is covered by different managed care systems. MCO refers to risk-based managed care; PCCM refers to Primary Care Case Management. FFS/Other refers to Medicaid beneficiaries who are not in MCOs or PCCM programs. *CA – PCCM program operates in LA county for those with HIV. *CO – PCCM enrollees are part of the state’s Accountable Care Collaboratives (ACCs). *CT – terminated its MCO contracts in 2012 and now operates its program on a fee-for-service basis using four Administrative Services Only entities. *ID – The Medicaid-Medicare Coordinated Plan (MMCP) has been recategorized by CMS as an MCO but is not counted here as such since it is secondary to Medicare. *OR – MCO enrollees include those enrolled in the state’s Coordinated Care Organizations. *SC – uses PCCM authority to provide care management services to approximately 200 medically complex children. *TX – Texas Medicaid Wellness program provides care management services for high-cost/high-risk enrollees (under PCCM authority).*WY – the state does not operate a traditional PCCM or MCO program, but does use PCCM authority to make PCMH payments. SOURCE: Kaiser Commission on Medicaid and the Uninsured Survey of Medicaid Officials in 50 states and DC conducted by Health Management Associates, October 2016. |
||||
Table 6: Enrollment of Special Populations Under Medicaid Managed Care Contracts for Acute Care in all 50 States and DC, as of July 1, 2016
| States | Pregnant Women | Foster Children | Persons with ID/DD | CSHCNs | SMI Adults | Adults w/ physical disabilities |
| Alabama | — | — | — | — | — | — |
| Alaska | — | — | — | — | — | — |
| Arizona | Varies | Varies | Varies | Varies | Varies | Varies |
| Arkansas | — | — | — | — | — | — |
| California* | Always Mandatory | Always Mandatory | Varies | Always Mandatory | Always Mandatory | Always Mandatory |
| Colorado | Varies | Varies | Varies | Varies | Varies | Varies |
| Connecticut | — | — | — | — | — | — |
| Delaware | Always Mandatory | Varies | Varies | Always Mandatory | Always Mandatory | Always Mandatory |
| DC | Always Mandatory | Varies | Always Excluded | Varies | Varies | Varies |
| Florida | Always Mandatory | Always Mandatory | Always Voluntary | Always Voluntary | Always Mandatory | Always Mandatory |
| Georgia | Always Mandatory | Always Mandatory | Always Excluded | Always Excluded | Always Excluded | Always Excluded |
| Hawaii | Always Mandatory | Always Mandatory | Always Mandatory | Always Mandatory | Always Mandatory | Always Mandatory |
| Idaho | — | — | — | — | — | — |
| Illinois | Varies | Always Excluded | Varies | Varies | Varies | Varies |
| Indiana | Always Mandatory | Always Voluntary | Varies | Varies | Varies | Varies |
| Iowa | Always Mandatory | Always Mandatory | Always Mandatory | Always Mandatory | Always Mandatory | Always Mandatory |
| Kansas | Always Mandatory | Always Mandatory | Always Mandatory | Always Mandatory | Always Mandatory | Always Mandatory |
| Kentucky | Varies | Varies | Varies | Varies | Varies | Varies |
| Louisiana | Always Mandatory | Always Mandatory | Varies | Always Mandatory | Varies | Varies |
| Maine | — | — | — | — | — | — |
| Maryland | Always Mandatory | Always Mandatory | Always Mandatory | Always Mandatory | Always Mandatory | Always Mandatory |
| Massachusetts | Always Voluntary | Always Voluntary | Always Voluntary | Always Voluntary | Always Voluntary | Always Voluntary |
| Michigan | Always Mandatory | Always Mandatory | Always Mandatory | Always Mandatory | Always Mandatory | Always Mandatory |
| Minnesota | Always Mandatory | Always Voluntary | Always Voluntary | Always Voluntary | Always Voluntary | Always Voluntary |
| Mississippi | Always Mandatory | Always Voluntary | Varies | Varies | Varies | Varies |
| Missouri | Always Mandatory | Always Mandatory | Always Excluded | Varies | Varies | Always Excluded |
| Montana | — | — | — | — | — | — |
| Nebraska | Always Mandatory | Always Mandatory | Always Excluded | Always Mandatory | Always Mandatory | Varies |
| Nevada | Varies | Varies | Always Excluded | Varies | Varies | Always Excluded |
| New Hampshire | Always Mandatory | Always Mandatory | Always Mandatory | Always Mandatory | Always Mandatory | Always Mandatory |
| New Jersey | Varies | Always Mandatory | Always Mandatory | Always Mandatory | Always Mandatory | Always Mandatory |
| New Mexico | Varies | Varies | Varies | Varies | Varies | Varies |
| New York | Always Mandatory | Varies | Always Voluntary | Varies | Always Mandatory | Always Mandatory |
| North Carolina | — | — | — | — | — | — |
| North Dakota | Always Excluded | Always Excluded | Always Excluded | Always Excluded | Always Excluded | Always Excluded |
| Ohio | Always Mandatory | Always Voluntary | Always Voluntary | Varies | Varies | Always Mandatory |
| Oklahoma | — | — | — | — | — | — |
| Oregon | Always Mandatory | Always Voluntary | Always Voluntary | Always Mandatory | Always Mandatory | Always Mandatory |
| Pennsylvania | Always Mandatory | Always Mandatory | Always Mandatory | Always Mandatory | Always Mandatory | Always Mandatory |
| Rhode Island | Always Mandatory | Always Voluntary | Always Mandatory | Always Mandatory | Always Mandatory | Always Mandatory |
| South Carolina | Always Mandatory | Always Voluntary | Varies | Varies | Varies | Varies |
| South Dakota | — | — | — | — | — | — |
| Tennessee | Always Mandatory | Always Mandatory | Always Mandatory | Always Mandatory | Always Mandatory | Always Mandatory |
| Texas | Always Mandatory | Varies | Varies | Varies | Varies | Varies |
| Utah | Varies | Varies | Varies | Varies | Varies | Varies |
| Vermont | — | — | — | — | — | — |
| Virginia | Always Mandatory | Always Mandatory | Varies | Varies | Varies | Varies |
| Washington | Varies | Always Voluntary | Varies | Varies | Varies | Varies |
| West Virginia | Always Mandatory | Always Excluded | Always Excluded | Always Mandatory | Always Excluded | Always Excluded |
| Wisconsin | Always Mandatory | Always Voluntary | Always Voluntary | Varies | Always Voluntary | Always Voluntary |
| Wyoming | — | — | — | — | — | — |
| Always Mandatory | 28 | 16 | 10 | 16 | 16 | 16 |
| Always Voluntary | 1 | 10 | 7 | 3 | 3 | 3 |
| Varies | 9 | 10 | 15 | 18 | 17 | 15 |
| Always Excluded | 1 | 3 | 7 | 2 | 3 | 5 |
| NOTES: “–” indicates there were no MCOs operating in that state’s Medicaid program in July 2016. ID/DD – intellectual and developmental disabilities, CSHCN – Children with special health care needs, SMI – Serious Mental Illness. States were asked to indicate for each group if enrollment in MCOs is “always mandatory,” “always voluntary,” “varies (by geography or other factor),” or if the group is “always excluded” from MCOs as of July 1, 2016. *CA was re-categorized from “Varies” to “Always Mandatory” across all population groups (except for persons with ID/DD) as the state noted that enrollment is generally mandatory across the state with the exception of one, small rural county where managed care is voluntary because there is only one plan and it is not a COHS county. The ID/DD population is subject to mandatory enrollment only in COHS counties. SOURCE: Kaiser Commission on Medicaid and the Uninsured Survey of Medicaid Officials in 50 states and DC conducted by Health Management Associates, October 2016. |
||||||
Table 7: Behavioral Health Services Covered under Acute Care MCO Contracts in all 50 States and DC, as of July 1, 2016
| States | Specialty OP Mental Health | Inpatient Mental Health | Outpatient SUD | Inpatient SUD |
| Alabama | — | — | — | — |
| Alaska | — | — | — | — |
| Arizona | Varies | Varies | Varies | Varies |
| Arkansas | — | — | — | — |
| California | Always Carved-out | Always Carved-out | Always Carved-out | Always Carved-out |
| Colorado | Always Carved-out | Always Carved-out | Always Carved-out | Always Carved-out |
| Connecticut | — | — | — | — |
| Delaware | Always Carved-out | Always Carved-in | Always Carved-in | Always Carved-in |
| DC | Always Carved-in | Always Carved-in | Always Carved-out | Always Carved-in |
| Florida | Always Carved-in | Always Carved-in | Always Carved-in | Always Carved-in |
| Georgia | Always Carved-in | Always Carved-in | Always Carved-in | Always Carved-in |
| Hawaii | Always Carved-out | Always Carved-out | Always Carved-in | Always Carved-in |
| Idaho | — | — | — | — |
| Illinois | Always Carved-in | Always Carved-in | Always Carved-in | Always Carved-in |
| Indiana | Always Carved-out | Always Carved-in | Always Carved-in | Always Carved-in |
| Iowa | Always Carved-in | Always Carved-in | Always Carved-in | Always Carved-in |
| Kansas | Always Carved-in | Always Carved-in | Always Carved-in | Always Carved-in |
| Kentucky | Always Carved-in | Always Carved-in | Always Carved-in | Always Carved-in |
| Louisiana | Always Carved-in | Always Carved-in | Always Carved-in | Always Carved-in |
| Maine | — | — | — | — |
| Maryland | Always Carved-out | Always Carved-out | Always Carved-out | Always Carved-out |
| Massachusetts | Always Carved-in | Always Carved-in | Always Carved-in | Always Carved-in |
| Michigan | Always Carved-out | Always Carved-out | Always Carved-out | Always Carved-out |
| Minnesota | Always Carved-in | Always Carved-in | Always Carved-in | Always Carved-in |
| Mississippi | Always Carved-in | Always Carved-in | Always Carved-in | Always Carved-in |
| Missouri | Always Carved-out | Varies | Varies | Varies |
| Montana | — | — | — | — |
| Nebraska | Always Carved-out | Always Carved-out | Always Carved-out | Always Carved-out |
| Nevada | Always Carved-in | Always Carved-in | Always Carved-in | Always Carved-in |
| New Hampshire | Always Carved-in | Always Carved-in | Always Carved-in | Always Carved-in |
| New Jersey | Always Carved-out | Always Carved-out | Always Carved-out | Varies |
| New Mexico | Always Carved-in | Always Carved-in | Always Carved-in | Always Carved-in |
| New York | Always Carved-in | Always Carved-in | Always Carved-in | Always Carved-in |
| North Carolina | — | — | — | — |
| North Dakota | Always Carved-in | Always Carved-in | Always Carved-in | Always Carved-in |
| Ohio | Varies | Always Carved-in | Varies | Always Carved-in |
| Oklahoma | — | — | — | — |
| Oregon | Always Carved-in | Always Carved-out | Always Carved-in | Always Carved-out |
| Pennsylvania | Always Carved-out | Always Carved-out | Always Carved-out | Always Carved-out |
| Rhode Island | Always Carved-in | Always Carved-in | Always Carved-in | Always Carved-in |
| South Carolina | Varies | Varies | Always Carved-in | Always Carved-in |
| South Dakota | — | — | — | — |
| Tennessee | Always Carved-in | Always Carved-in | Always Carved-in | Always Carved-in |
| Texas | Varies | Varies | Varies | Varies |
| Utah | Always Carved-out | Always Carved-out | Always Carved-out | Always Carved-out |
| Vermont | — | — | — | — |
| Virginia | Varies | Always Carved-in | Varies | Always Carved-in |
| Washington | Varies | Varies | Varies | Varies |
| West Virginia | Always Carved-in | Always Carved-in | Always Carved-in | Always Carved-in |
| Wisconsin | Varies | Always Carved-in | Always Carved-in | Always Carved-in |
| Wyoming | — | — | — | — |
| Always Carved-in | 20 | 24 | 24 | 26 |
| Always Carved-out | 12 | 10 | 9 | 8 |
| Varies | 7 | 5 | 6 | 5 |
| NOTES: OP – Outpatient. SUD – Substance Use Disorder. “–” indicates there were no MCOs operating in that state’s Medicaid program in July 2016. For beneficiaries enrolled in an MCO for acute care benefits, states were asked to indicate whether these benefits are always carved-in (meaning virtually all services are covered by the MCO), always carved-out (to PHP or FFS), or whether the carve-in varies (by geography or other factor). “Specialty outpatient mental health” refers to services utilized by adults with Serious Mental Illness (SMI) and/or youth with serious emotional disturbance (SED) commonly provided by specialty providers such as community mental health centers. SOURCE: Kaiser Commission on Medicaid and the Uninsured Survey of Medicaid Officials in 50 states and DC conducted by Health Management Associates, October 2016. |
||||
Table 8: Medicaid Managed Care Quality Initiatives in all 50 States and DC, FY 2015 – FY 2017
| States | Pay for Performance/ Performance Bonus or Penalties | Adult and Child Quality Measures | Publicly Report MCO Quality Metrics | Other Quality Initiatives | Any Quality Initiatives | ||||||||||
| In Place | New/ Expanded |
In Place | New/ Expanded |
In Place | New/ Expanded |
In Place | New/ Expanded |
In Place | New/ Expanded |
||||||
| 2015 | 2016 | 2017 | 2015 | 2016 | 2017 | 2015 | 2016 | 2017 | 2015 | 2016 | 2017 | 2015 | 2016 | 2017 | |
| Alabama | X | X | X | X | |||||||||||
| Alaska | |||||||||||||||
| Arizona | X | X | X | X | X | X | X | X | X | X | X | ||||
| Arkansas | |||||||||||||||
| California | X | X | X | X | X | X | X | X | X | X | X | X | X | X | X |
| Colorado | X | X | X | X | |||||||||||
| Connecticut | |||||||||||||||
| Delaware | X | X | X | X | X | X | X | X | X | ||||||
| DC | X | X | X | X | X | X | X | X | X | X | |||||
| Florida | X | X | X | X | X | ||||||||||
| Georgia | X | X | X | X | |||||||||||
| Hawaii | X | X | X | X | |||||||||||
| Idaho | |||||||||||||||
| Illinois | X | X | X | X | |||||||||||
| Indiana | X | X | |||||||||||||
| Iowa | X | X | X | X | X | X | |||||||||
| Kansas | X | X | X | ||||||||||||
| Kentucky | X | X | X | X | X | ||||||||||
| Louisiana | X | X | X | X | |||||||||||
| Maine | |||||||||||||||
| Maryland | X | X | X | X | |||||||||||
| Massachusetts | X | X | X | X | X | ||||||||||
| Michigan | X | X | X | X | |||||||||||
| Minnesota | X | X | X | X | X | ||||||||||
| Mississippi | X | X | |||||||||||||
| Missouri | X | X | X | X | X | X | X | X | X | ||||||
| Montana | |||||||||||||||
| Nebraska | X | X | X | X | |||||||||||
| Nevada | X | X | |||||||||||||
| New Hampshire | X | X | X | X | X | X | X | X | |||||||
| New Jersey | X | X | X | X | X | X | |||||||||
| New Mexico | X | X | X | X | |||||||||||
| New York | X | X | X | X | |||||||||||
| North Carolina | |||||||||||||||
| North Dakota | X | X | |||||||||||||
| Ohio | X | X | X | X | X | ||||||||||
| Oklahoma | |||||||||||||||
| Oregon | X | X | X | X | |||||||||||
| Pennsylvania | X | X | X | X | X | X | X | X | X | X | X | X | X | X | |
| Rhode Island | X | X | X | ||||||||||||
| South Carolina | X | X | X | X | X | X | |||||||||
| South Dakota | |||||||||||||||
| Tennessee | X | X | X | X | X | X | X | X | |||||||
| Texas | X | X | X | X | X | X | X | X | X | X | |||||
| Utah | X | X | X | X | |||||||||||
| Vermont | |||||||||||||||
| Virginia | X | X | X | X | X | X | X | X | X | X | X | X | X | X | X |
| Washington | X | X | X | X | |||||||||||
| West Virginia | X | X | X | X | X | X | X | X | X | ||||||
| Wisconsin | X | X | X | X | X | X | X | ||||||||
| Wyoming | |||||||||||||||
| Totals | 28 | 11 | 12 | 32 | 11 | 10 | 22 | 7 | 9 | 12 | 7 | 7 | 36 | 17 | 17 |
| NOTES: States with MCO contracts were asked to report if select quality initiatives were included in contracts in FY 2015, new or expanded in FY 2016 or FY 2017. “Adult and Child Quality Measures” refers to CMS’s core measure sets for adults and children, which are available but not mandatory for states to use. The table above does not reflect all quality initiatives states have included as part of MCO contracts. SOURCE: Kaiser Commission on Medicaid and the Uninsured Survey of Medicaid Officials in 50 states and DC conducted by Health Management Associates, 2016 |
|||||||||||||||
Table 9: Minimum Medical Loss Ratio Policies for Medicaid MCOs in all 50 States and DC, as of July 1, 2016
| Minimum Medical Loss Ratio (MLR) | ||
| States | Require minimum MLR | % if required |
| Alabama | — | |
| Alaska | — | |
| Arizona | Yes — always | 85% |
| Arkansas | — | |
| California | No | |
| Colorado | Yes — always | 85% |
| Connecticut | — | |
| Delaware | No | |
| DC | Yes — always | 85% |
| Florida | Yes — always | 85% |
| Georgia | No | |
| Hawaii | No | |
| Idaho | — | |
| Illinois | Yes — always | 85%-88% * |
| Indiana | Yes — always | 85%-87%* |
| Iowa | Yes — always | 88% |
| Kansas | No | |
| Kentucky | Yes — always | 90% |
| Louisiana | Yes — always | 85% |
| Maine | — | |
| Maryland | Yes — always | 85% |
| Massachusetts | Yes — sometimes* | 80% |
| Michigan | No | |
| Minnesota | No | |
| Mississippi | Yes — always | 85% |
| Missouri | No | |
| Montana | — | |
| Nebraska | No | |
| Nevada | No | |
| New Hampshire | No | |
| New Jersey | Yes — always | 85% |
| New Mexico | Yes — always | 85% |
| New York | No | |
| North Carolina | — | |
| North Dakota | No | |
| Ohio | Yes — always | 85% |
| Oklahoma | — | |
| Oregon | Yes — always | 80% |
| Pennsylvania | No | |
| Rhode Island | No | |
| South Carolina | Yes — always | 86% |
| South Dakota | — | |
| Tennessee | No | |
| Texas | No* | |
| Utah | No* | |
| Vermont | — | |
| Virginia | Yes — sometimes | 85% |
| Washington | Yes — always | 85-87%* |
| West Virginia | Yes — always | 85% |
| Wisconsin | No* | |
| Wyoming | — | |
| Yes — always | 18 | |
| Yes — sometimes | 2 | |
| No | 19 | |
| N/A – No MCOs | 12 | |
| NOTES: “–” indicates states that do not have Medicaid MCOs. MLR refers to the proportion of total per member per month capitation payments that is spent on clinical services and for quality improvement. *MA reported that there is no minimum MLR for acute MCOs or the One Care (FAD) program; however, the SCO program has a minimum MLR of 80%. *UT and WI reported not requiring a minimum MLR but using a target MLR as part of their rate setting process. *TX has experience rebates on plans above a certain profit level. *IL, IN and WA indicated that the minimum MLR varies by population. SOURCE: Kaiser Commission on Medicaid and the Uninsured Survey of Medicaid Officials in 50 states and DC conducted by Health Management Associates, October 2016. |
||

Sections
Also of Interest
- The 16th Annual Kaiser 50-State Medicaid Budget Survey: Slowing Growth and Evolving Policies at a Forum with the National Association of Medicaid Directors
- Medicaid Enrollment & Spending Growth: FY 2016 & 2017
- Putting Medicaid in the Larger Budget Context: An In-Depth Look at Four States in FY 2016 and FY 2017
- 50-State Medicaid Budget Survey Archives