Health Care Costs: A Primer
Introduction
Key Facts
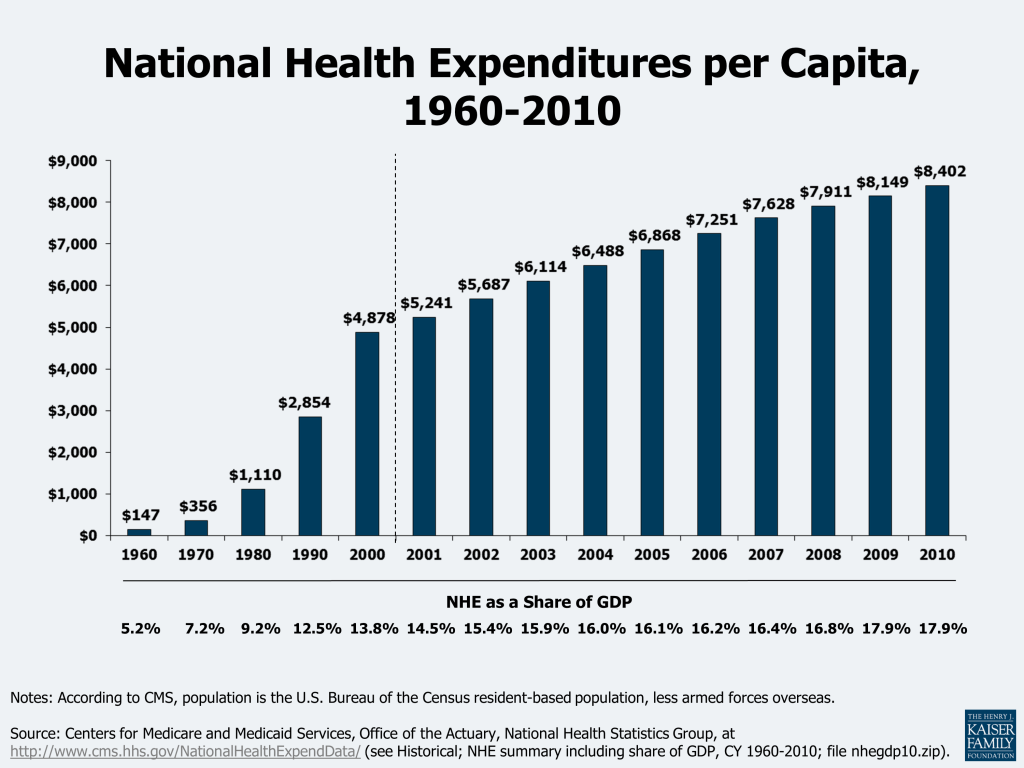
- In 2010, the U.S. spent $2.6 trillion on health care, an average of $8,402 per person.
- The share of economic activity (gross domestic product, or GDP) devoted to health care has increased from 7.2% in 1970 to 17.9% in 2009 and 2010.
- Health care costs per capita have grown an average 2.4 percentage points faster than the GDP since 1970.
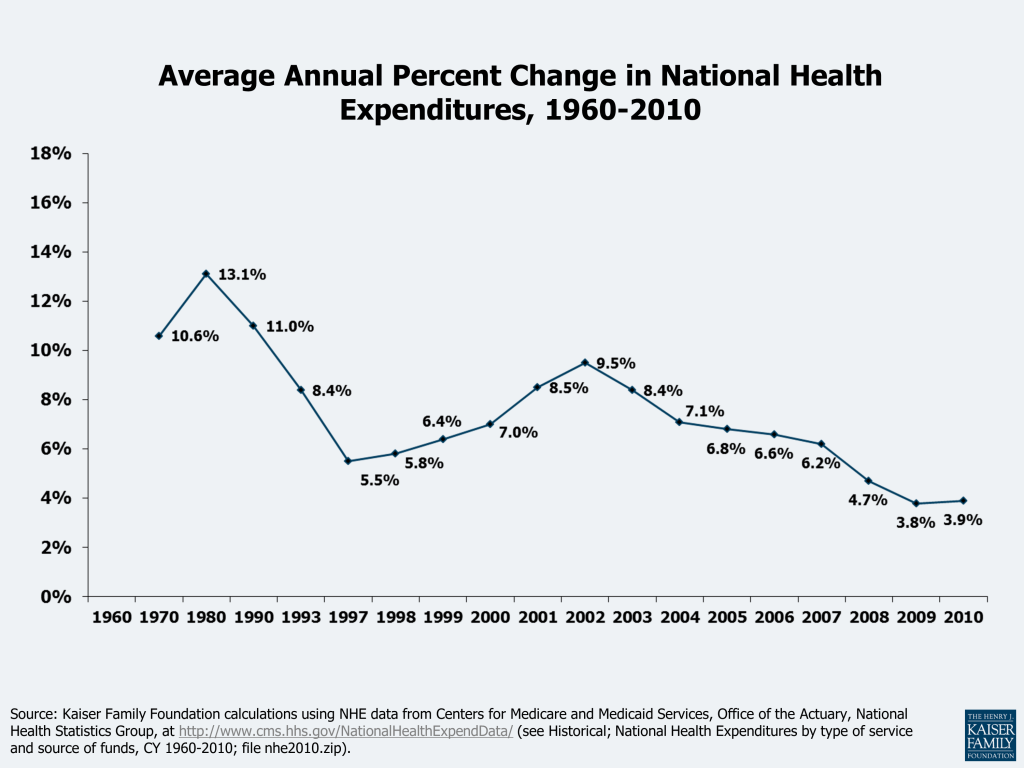
- Since 2002, the rate of increase in national health care spending has fallen from 9.5% to 3.9%.
- Half of health care spending is used to treat just 5% of the population.
- Although only 10% of total health expenditures, spending on prescription drugs has received considerable attention because of its rapid growth (114% from 2000 to 2010).
- In 2008, 27% of the nonelderly with 3+ chronic conditions spent more than 10% of their income on health, compared to 11% of the total nonelderly population.
- Many policy experts believe new technologies and the spread of existing ones account for a large portion of medical spending and its growth.
Health care accounts for a remarkably large slice of the U.S. economic pie. Each year health-related spending grows, virtually always outpacing spending on other goods and services, meaning that the size of that slice increases. These cost increases have a significant effect on households, businesses, and federal, state, and local governments. Among other things, rising health care costs make health insurance less affordable for individuals, families, and businesses; put pressure on businesses that offer insurance coverage to their employees; can be a major financial burden to families, even those that have insurance; and can result in individuals not receiving the health care services they need. For taxpayers, government programs such as Medicare and Medicaid are major parts of federal and state budgets and increasing costs require either additional revenue or reductions in benefits, eligibility, or payment rates.
Concerns about rising health care costs and affordability of health care for families persist despite the enactment of comprehensive health reform legislation in March 2010 (the Affordable Care Act, or ACA).1 The ACA changed the health care landscape considerably by providing significant financial assistance to help people with low and moderate incomes afford coverage and associated cost sharing. The law provides new standards for private health insurance, including identifying minimum benefits for health insurance, placing limits on cost sharing for covered benefits, and establishing new rules for private health insurance that assure access to coverage for people with health problems and limit premium and contribution differences based on health-related factors. Together these provisions will dramatically reduce financial burdens for many people with lower income or significant health care needs.
The ACA also has a number of provisions that address the costs and efficiency of the health care system, including provisions to demonstrate and implement new payment systems for Medicare (e.g., accountable care organizations, or ACOs), provisions to better coordinate care for people dually eligible for Medicare and Medicaid, reductions in Medicare payments, and new rules (e.g., disclosure and transparency) and new institutions (i.e., exchanges) to improve the efficiency of private health insurance.
Despite the many cost-reducing provisions in the ACA, system-wide health care costs are still projected to rise faster than national income for the foreseeable future, and this cost growth has important implications for government and family budgets. Reducing future federal budget deficits is a major focus in national policy debate, and spending on federal health programs is a primary target. Federal health spending is projected to grow from 5.6% of Gross Domestic Product (GDP) in 2011 to about 9.4% of GDP by 2035.2 Proposals to reduce federal health spending range from modest reforms, such as modifying payment systems to better reward efficiency and effectiveness, to fundamental changes, such as transforming Medicaid into a block grant with capped federal spending and replacing the current Medicare entitlement with a defined set of services to a defined contribution toward purchase of a private or public health plan Recent proposals to reduce future budget deficits include various policies to slow federal health spending, including taking steps to constrain overall federal spending to a proscribed rate of growth, such as one percentage point above GDP or GDP per capita.3 The more far-reaching reforms would limit federal costs and potentially expose program beneficiaries to higher out-of-pocket costs and benefit reductions. Many states have experienced severe budget problems during the recent recession, leading them to reduce state spending on Medicaid, which is one of the largest components of state budgets.
The federal budget debate in large part revolves around the overall size of the budget and the mix of program cuts and new revenues necessary to bring federal spending into better balance. Proposals to reduce federal health spending are based on the premise that health programs are growing to unaffordable levels and must be curtailed. Little of the debate, however, considers the amount of health that is currently provided by these programs and how much health the nation wants to support though federal spending in the future. Health spending grows faster than national income in part because the health care system continues to innovate and provide new treatment options to people with serious acute and chronic illnesses. A system that each year can do more of something that people find very valuable – address their health care needs – inevitably will attract a greater share of overall national spending. This does not mean that all current health care spending is necessary or that there are not considerable opportunities to improve the efficiency and quality of care, but even from more efficient levels continuing innovation will push costs higher as the arsenal of health care interventions continues to grow. The key challenge for policymakers will be finding the best mix of policies so that government, corporate, and private health spending is as efficient as possible and best meets the health care needs and desires of the nation.
The challenge is made more difficult by the highly decentralized nature of health care decision-making in the United States. Health care investment and spending are influenced by federal and state programs, with differing payment systems, incentives, and reimbursement levels, by numerous private health insurers, each with their own payment policies and practices, and by direct family payments for services that are covered or not covered by public or private insurance. Decisions by one program may shift costs or affect payment decisions by other payers, usually in an uncoordinated fashion. Provisions in the ACA provide for some additional coordination across programs, such as coordination of care for those dually eligible for Medicare and Medicaid. Private payers also may be able to take advantage of Medicare investments in ACOs and medical homes. Still, the lack of coordination across public and private spending programs makes coordinating efforts to reduce costs and increase efficiency system-wide a challenging proposition.
This primer gives a brief glimpse of available data on health care costs, and summarizes the impact of spending growth on various parts of society. The National Health Expenditure Accounts (NHEA), the source for several of the analyses shown, present the costs of care by type of health service or product (such as hospital care, physician services, or prescription drugs), sources of funds (such as private insurance, Medicare, Medicaid, or out-of-pocket by the individual patient), and types of sponsors (private business, households, and government). Results from both the Kaiser Family Foundation/Health Research and Educational Trust Employer Health Benefits Survey and the Medical Expenditures Panel Survey are also shown to help explain how health costs are distributed among families. Finally, we conclude by discussing some commonly-held explanations for why health care costs grew over time, how they might be addressed, and the effect of the ACA.
Report
How Much Does the U.S. Spend on Health and How Has It Changed?
The U.S. spent $8,402 per person on health care in 2010. Health care spending has consumed an increasing share of economic activity over time. The United States spent $2.6 trillion on health care in 2010. Spread over the population, this amounts to $8,402 per person (Figure 1). This $2.6 trillion represents 17.9% of the nation’s total economic activity, referred to as the gross domestic product, or GDP. While health care expenditures have grown rapidly over time, increases have moderated in recent years.
Health care grows faster than many other sectors of the economy and thus its share of economic activity has increased over time. For example, whereas the education, transportation, and agriculture industries may, on average and over time, grow at rates close to the economy as a whole, health care does not. In 1970, total health care spending was about $75 billion, or only $356 per person (Figure 1). In less than 40 years these costs have grown to $2.6 trillion, or $8,402 per person. As a result, the share of economic activity devoted to health care grew from 7.2% in 1970 to 17.9% in 2010, though this level was unchanged from 2009. By the year 2020, the Centers for Medicare and Medicaid Services (CMS) projects that health spending will be nearly one-fifth of GDP (19.8).4
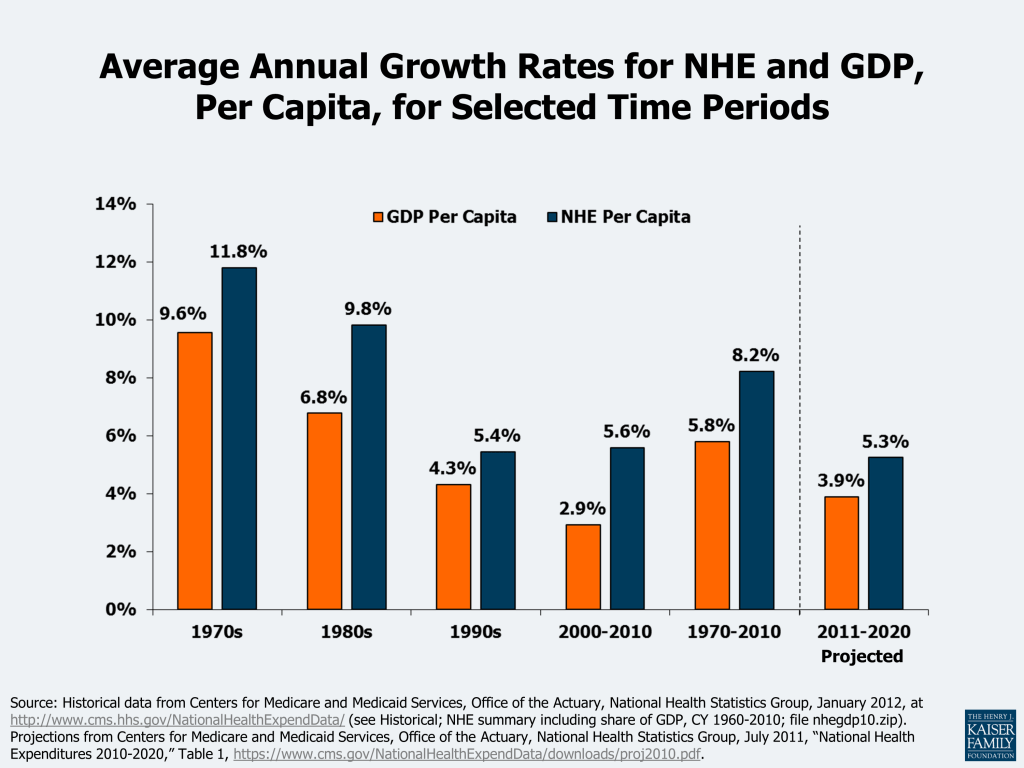
Health care spending has exceeded economic growth in every recent decade. Over the last four decades, the average growth in health spending has exceeded the growth of the economy as a whole by between 1.1 and 3.0 percentage points (Figure 2). Since 1970, health care spending per capita has grown at an average annual rate of 8.2% or 2.4 percentage points faster than nominal GDP. The persistence of this trend suggests systematic differences between health care and other economic sectors where growth rates are typically more in line with the overall economy. A smaller difference is projected over the 2011 to 2020 period, where the average annual growth in per capita health spending (5.3%) is projected to be about 1.2 percentage points higher than the growth in GDP (3.9%).5 The average annual growth rates in per capita national health spending have declined over the decades, from 11.8% in the 1970s to 5.6% in the 2000 to 2010 period.
After years of increases, the rate of increase in national health spending has been declining since 2002. Since 2002, when the rate of increase in national spending was 9.5% over the prior year, the annual spending increases have declined to less than half that amount — 3.9% in 2010 — an amount similar to the 3.8% in 2009 (Figure 3). CMS indicates that these recent rates are lower than in any other years during the 51-year history of the National Health Expenditure Accounts record-keeping.6 CMS attributes the moderation to an “extraordinarily slow growth in the use and intensity of services.” The recession in the US economy, which officially lasted from December 2007 through June 2009, had an impact on utilization of services as people were reluctant to spend money on medical care, including those who lost their jobs and thus their insurance and those who were cautious about, or could not afford, their insurance’s cost sharing. According to CMS, the slowdown in health spending from this recession occurred more quickly than in earlier recessions where the effects were typically lagged, with the largest declines in annual % increases apparent in 2008 (+4.7%), 2009 (+3.8%), and 2010 (+3.9%). An example of the effect of the economy on medical service utilization — physician office visits by privately insured patients — can be seen at http://healthreform.kff.org/notes-on-health-insurance-and-reform/2011/november/the-economy-and-medical-care.aspx.7
How Does U.S. Health Spending Compare with Other Countries?
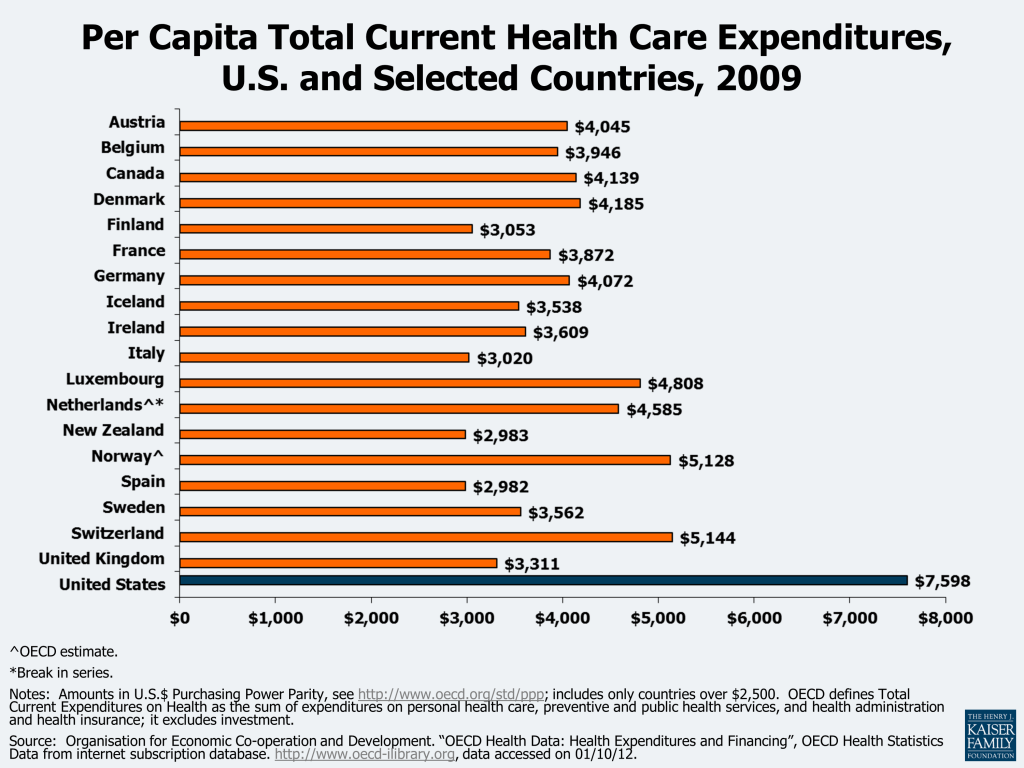
The U.S. spends substantially more on health care than other developed countries. Figure 4 shows per capita health expenditures in 2009 U.S. dollars for the Organisation for Economic Co-operation and Development (OECD) countries with above-average per capita national income. According to OECD data, health spending per capita in the United States was $7,598 in 2009.8 This amount was 48% higher than in the next highest spending country (Switzerland), and about 90% higher than in many other countries that we would consider global competitors. As a share of GDP, health care spending in the US also exceeds spending by other industrialized nations by at least 5 percentage points (not shown).9 Despite this relatively high level of spending, the United States does not appear to achieve substantially better health benchmarks compared to other developed countries.10 A recent study found that U.S. health care spending is higher than that of other countries most likely because of higher prices and perhaps more readily accessible technology and greater obesity, rather than higher income, an older population, or a greater supply or utilization of hospitals and doctors.11
How Does Health Care Spending Vary by Person?
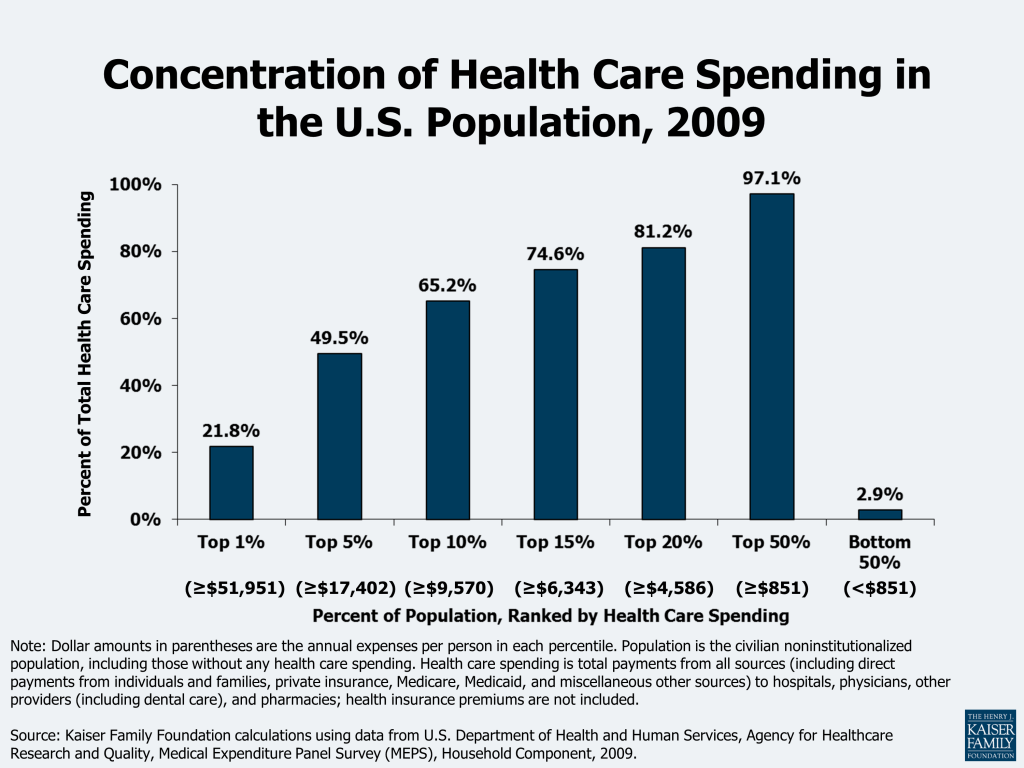
A small share of people accounts for a significant share of expenses in any year. In 2009, almost half of all health care spending was used to treat just 5% of the population, which included individuals with health expenses at or above $17,402 (Figure 5).12 Under a quarter of health spending (21.8%) went towards the treatment of the 1% of the population who had total health expenses above $51,951 in 2009. Because the onset of disease is unpredictable and can require intensive technology and time to treat, the distribution of health spending is highly concentrated.
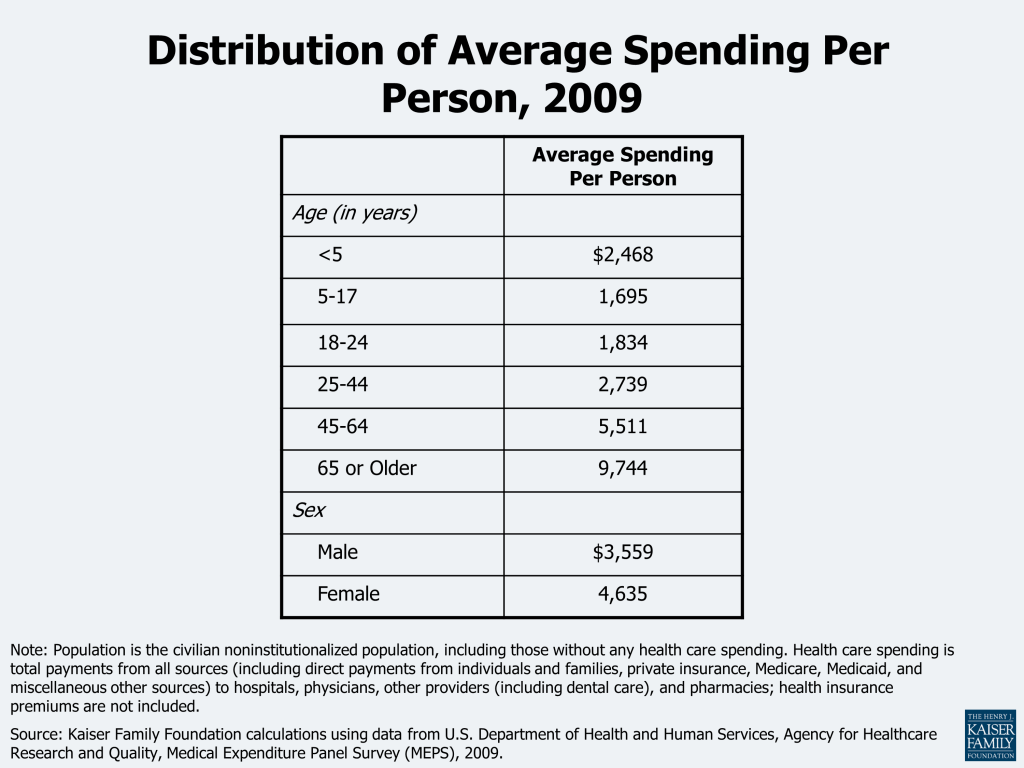
Health care spending also varies by factors such as age and sex. Average health care spending per person increased with age, although spending for children and for young adults (those aged 24 and younger) was roughly the same per person in 2009 (Figure 6). Adults aged 65 and older have the highest health care spending, averaging $9,744 per person in 2009. Women are reported to have higher average spending than men ($4,635 vs. $3,559 respectively).
What Do Health Expenditures Pay For and Who Pays For Them?
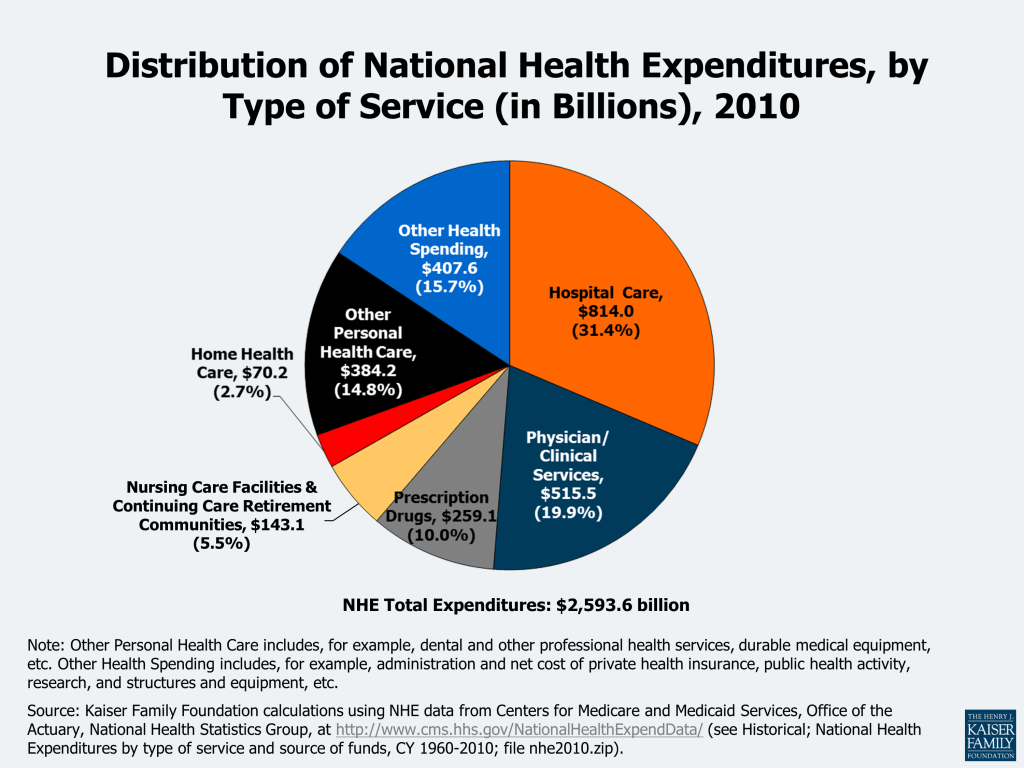
Most health care spending is for care provided by hospitals and physicians. Health care spending encompasses a wide variety of health-related goods and services, from hospital care and prescription drugs to dental services and medical equipment purchases. Figure 7 illustrates spending on health by type of expense in 2010. Spending on hospital care and physician services ($1,329.5 billion combined) makes up just over one-half of health care expenditures (51%). While spending on prescription drugs ($259.1 billion) accounts for only 10% of total health expenditures, its rapid growth has received considerable attention (a 114% increase since 2000, compared to 88% for both hospitals and physician/clinical services combined. However, the 2010 average annual spending growth from 2009 was lower for prescription drugs (1.2%) than for hospitals (4.9%) or physicians/clinical services (2.5%).
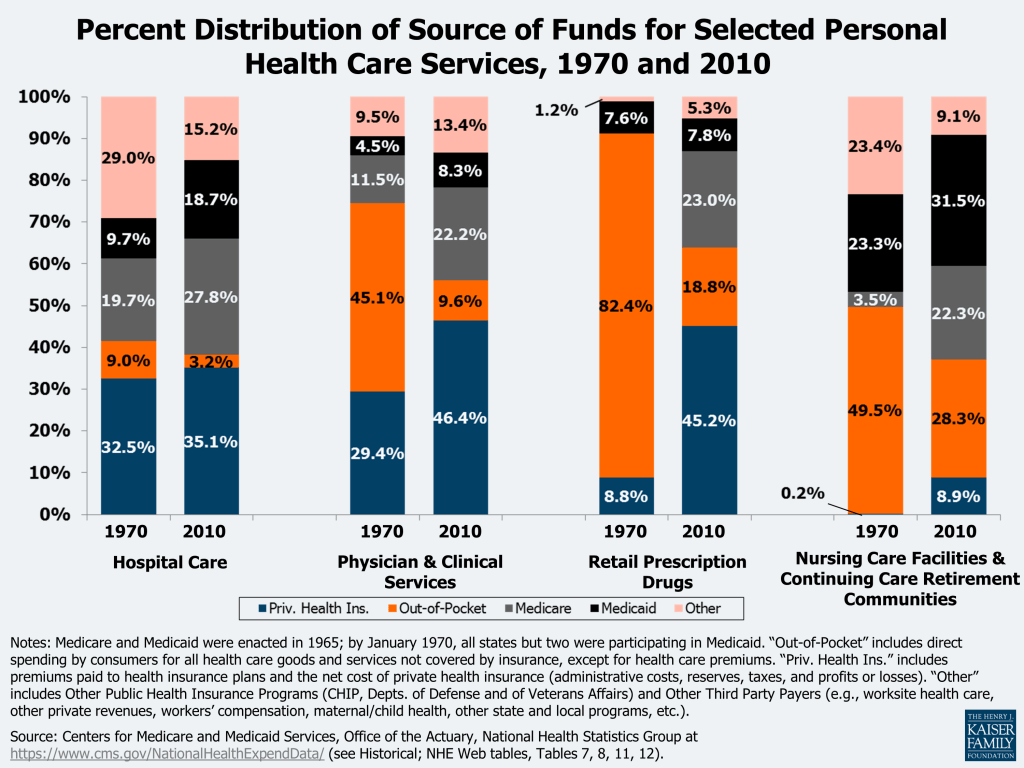
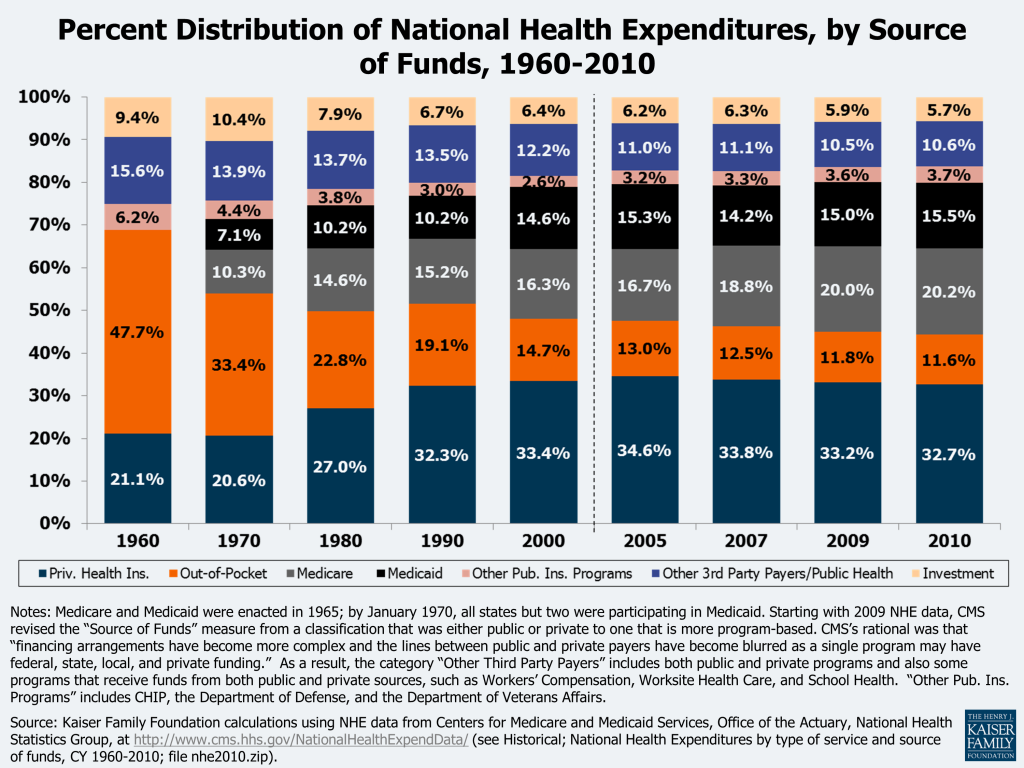
The relative contributions from the different sources of funding for personal health care services and for total national spending have changed considerably over the past decades. Figure 8 shows that, for most services, Medicare and Medicaid’s share of costs has risen (note that these programs were not enacted until 1965; by January 1970, all states but 2 were participating in Medicaid), while the shares from patient out-of-pocket costs have declined. Private health insurance’s portions have increased for physician and clinical services and retail prescription drugs, but decreased for nursing care. The shares of out-of-pocket costs for physician services and retail prescription drugs have declined. Figure 9 shows how the distribution of sources of funding for total national health expenditures has changed over time, with shares of private health insurance, Medicare, and Medicaid increasing, and a decrease in out-of-pocket shares. The shares of most sources have held relatively steady in recent years.
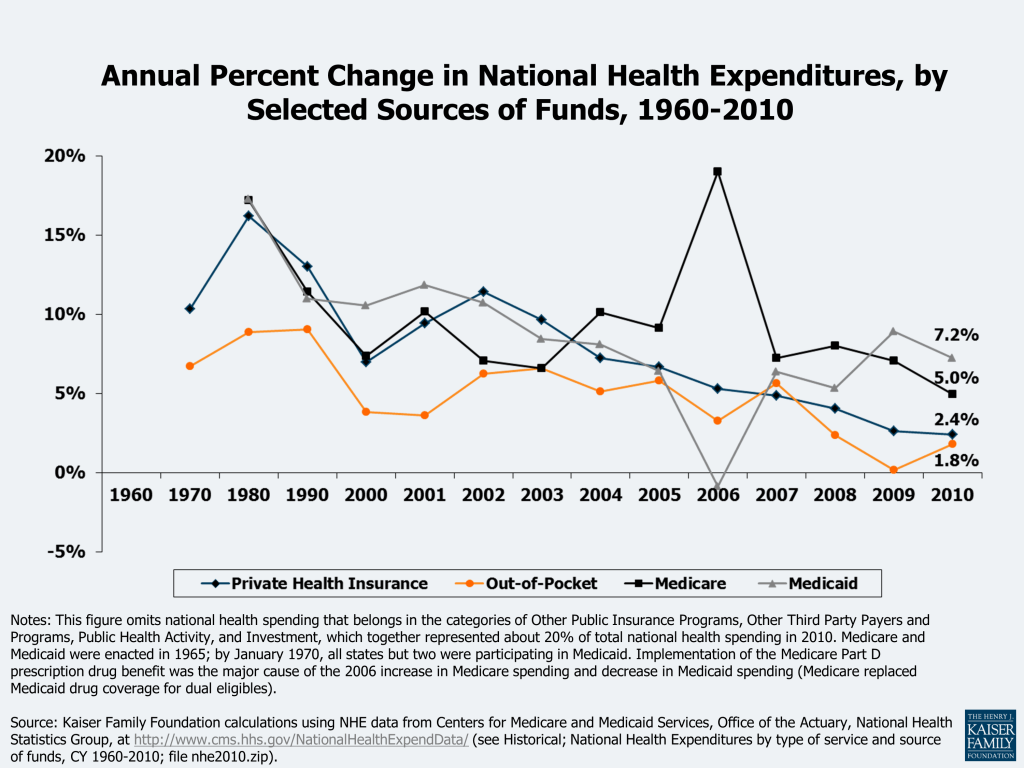
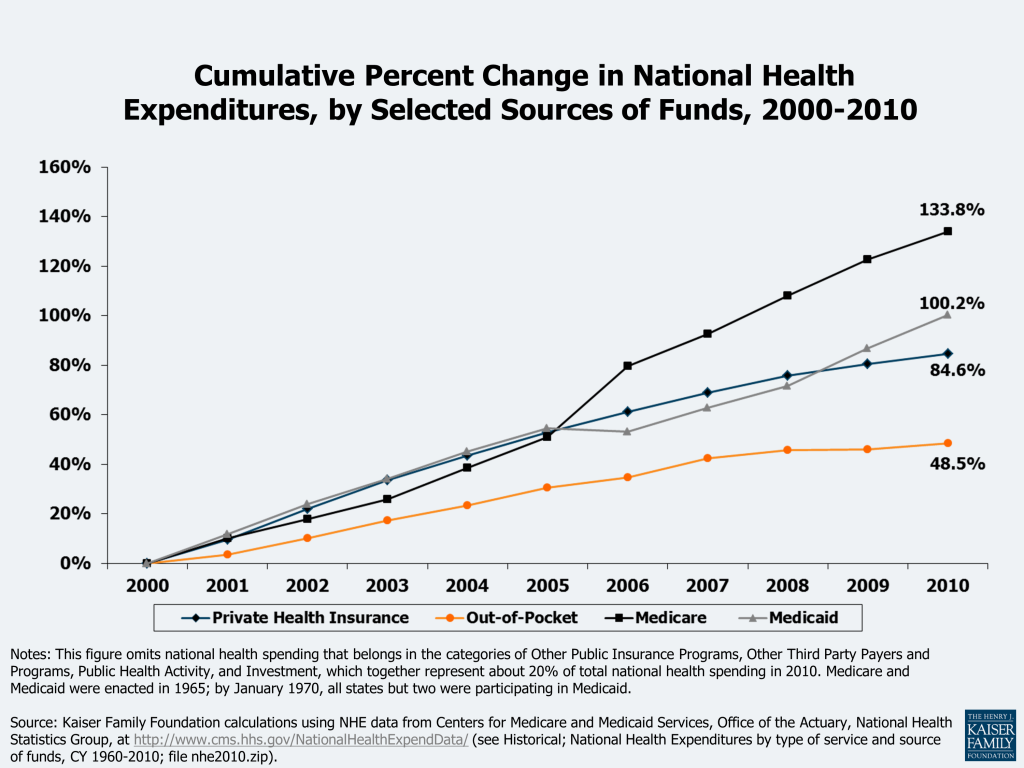
The annual percent increase for all sources of funding except out-of-pocket declined in 2010, although the cumulative increase since 2000 was less for out-of-pocket than for Medicare, Medicaid, and private health insurance. Of the major sources of national health spending, only out-of-pocket spending (which includes direct spending by consumers for all health care goods and services except private health insurance premiums) increased more in 2010 than in 2009 (1.8% vs. 0.2%) (Figure 10). CMS attributes this higher cost-sharing growth in 2010 to higher cost-sharing requirements for some employer plans, consumers’ switching to plans with lower premiums but higher deductibles and/or copayments, and the loss of health insurance coverage.13 However, the cumulative increase in out-of-pocket spending since 2000 is less than for other sources of funding (Figure 11).
Several figures in this primer show the cumulative percent change in private health insurance or health insurance premiums (Figures 11, 15, and 20). These cumulative increases may vary from figure to figure because different years are used, the data sources differ, and what is being measured varies. Figure 11 uses the private health insurance category of the HHS national health expenditure data, which includes both private employer and individual health insurance premiums drawn from a number of sources, the medical portion of accident insurance, and the net cost of private insurance (including administrations costs, additions to reserves, rate credits and dividends, premium taxes, and profits or losses). Figure 15 uses family of four premium data from an annual employer survey of private and public employers conducted by the Kaiser Family Foundation and the Health Research & Educational Trust. Figure 20 uses family of four private sector premium data from the Medical Expenditure Panel Survey conducted by the Agency for Healthcare Research and Quality.
Private funds are the largest sponsor of health care payments (55% in 2010, compared to 45% from government funds), although over time their share has declined. Starting with the 2009 NHE data, CMS expanded their focus on spending by Type of Sponsor, which provides estimates of the individual, business, or tax source that is behind each Source of Funds category – i.e., the entity that is ultimately responsible for financing the health care bill. For example, private health insurance is considered a private source of funding but in the sponsor analysis, it is divided into business, household, and government sponsor categories based on who bears the underlying financial responsibility for the health insurance premiums.
Figure 12 illustrates the distribution of national health expenditures by type of sponsor. The federal government financed the largest share (29% in 2010), an increase from 19% in 2000; households financed a similar share (28%), a decline from 32% in 2000. The share of the total health care bill financed by state and local governments, and private businesses also declined over the same period.
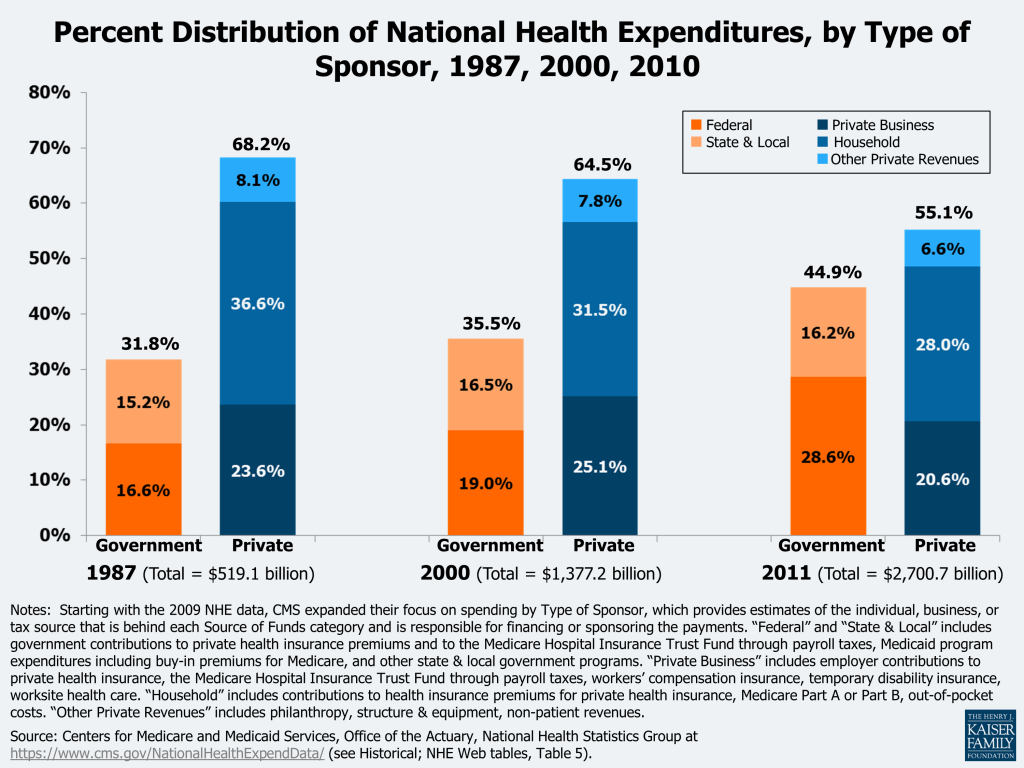
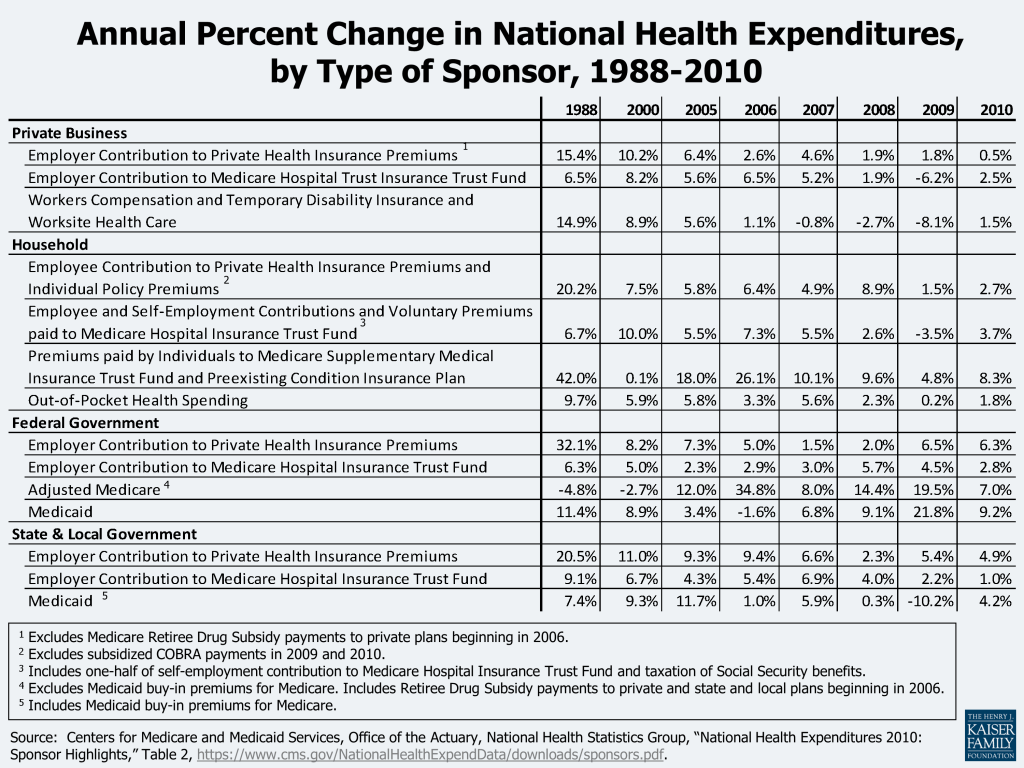
Figure 13 provides detail about the annual percent changes in components of the Type of Sponsors categories. Employer contributions to private health insurance premiums have declined since 1988, increasing only 0.5% in 2010 compared to a 2.7% increase in employee contributions to private and individual health insurance premiums. CMS reports that low growth in private business’ health spending resulted from recession-related job losses together with declines in private health insurance enrollment.14 The household share of spending has declined since 1988, partially explained by the decline in the growth of out-of-pocket costs paid directly by consumers. However, all categories of household spending increased in 2010 at levels greater than in 2009. Federal government health care spending growth declined in 2010 as a result of slowdowns in the rates of growth in Medicare and Medicaid spending, according to CMS, primarily due to a steep deceleration in Medicare Advantage spending and a slower growth in Medicaid enrollment). State and local government spending increased primarily because of Medicaid, which represented 32% of state and local government health spending in 2010.
How Do Health Care Costs Impact Families and Employers?
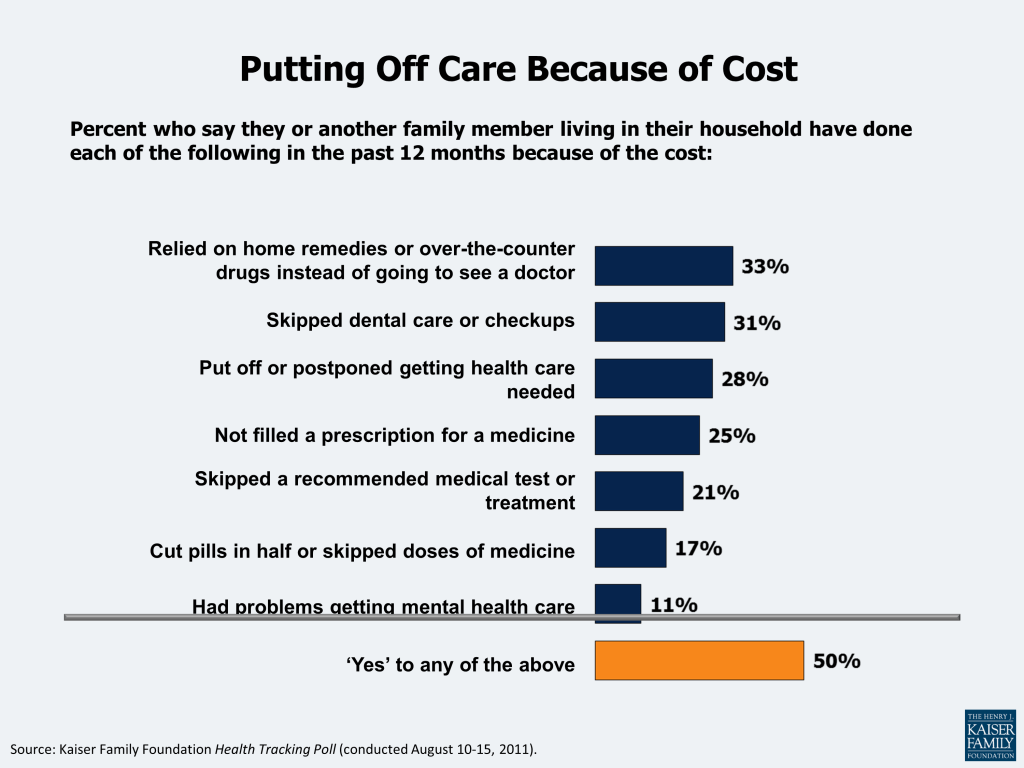
Rising health care costs result in families cutting back on care and facing serious financial problems. A Kaiser Health Tracking Poll found that half (50%) of Americans say their family cut back on medical care in the past 12 months because of cost concerns by, for example, relying on home remedies and over-the-counter drugs rather than visiting a doctor (33%), skipping dental care (31 %), and postponing getting health care they needed (28%)15 (Figure 8). Seventeen percent said they experienced serious financial problems due to family medical bills, with 11% using up all or most of their savings, 11% saying they have been contacted by a collection agency, and 7% reporting being unable to pay for basic necessities like food, heat, or housing.16 Beyond actual financial hardship due to medical care, 4 in 10 Americans (40%) report that they are “very worried” about having to pay more for their health care or health insurance.17
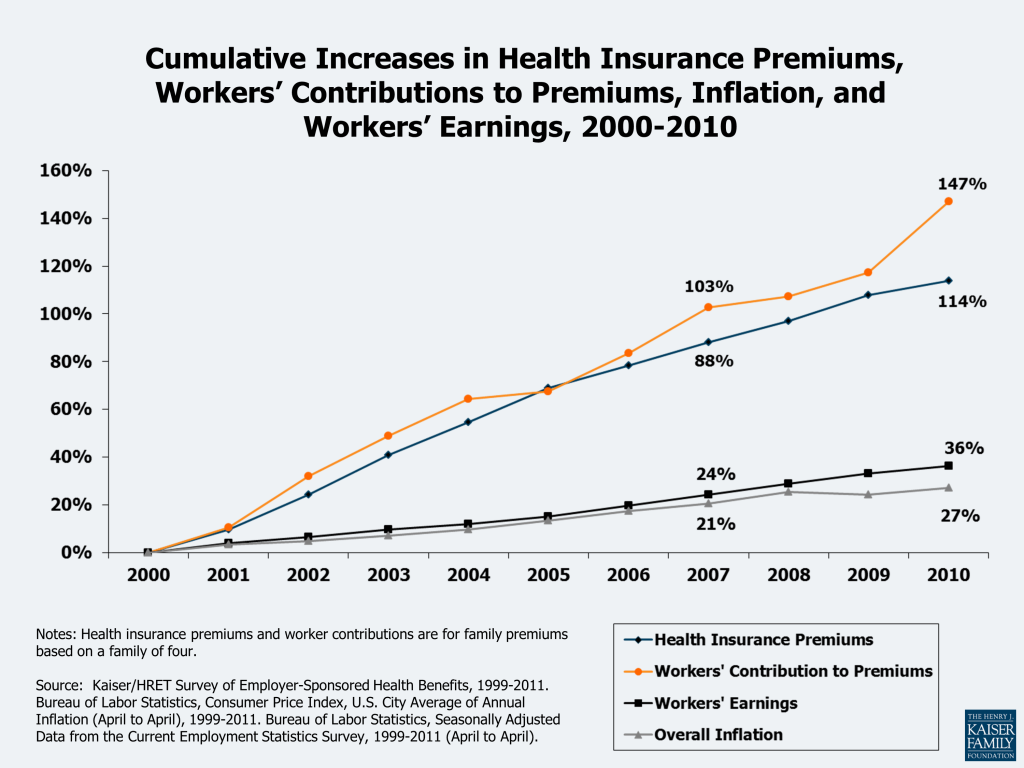
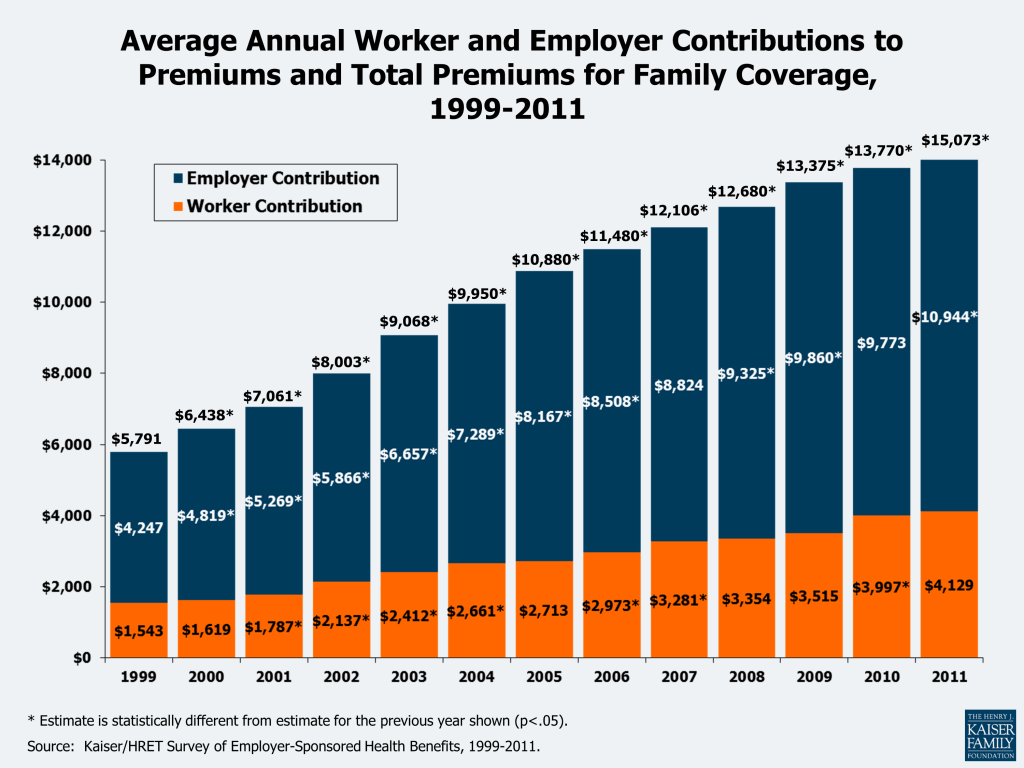
Health insurance premium increases consistently outpace inflation and the growth in workers’ earnings. The growth in health insurance premiums is a straightforward way to measure changes in the cost of private health insurance. As health care costs increase, it becomes increasingly difficult for families and businesses to purchase coverage because the price of coverage (the premium) typically increases. Employers, as purchasers of insurance, may also decide to increase the amount covered workers must pay to visit the doctor or go to the hospital (the cost sharing), which can put pressure on family budgets when family members become ill. Figure 15 compares the annual increase in employer premiums to both worker earnings growth and overall inflation. Premium growth has outpaced the growth in workers’ earnings almost every year. Whereas premium increases have been between 3 and 13% per year since 2000, inflation and changes in workers’ earnings are typically in the 2 to 4% range. This usually means that workers have to spend more of their income each year on health care to maintain coverage. Again, these effects may either be direct – through increased worker contributions for premiums or reduced health benefits – or indirect – such as when employers reduce wages or limit wage increases to offset increases in premiums. Average annual worker and employer contributions to total premiums have increased since 1999, with the worker contribution for family coverage increasing from $1,543 in 1999 to $4,129 in 2011 (Figure 16).
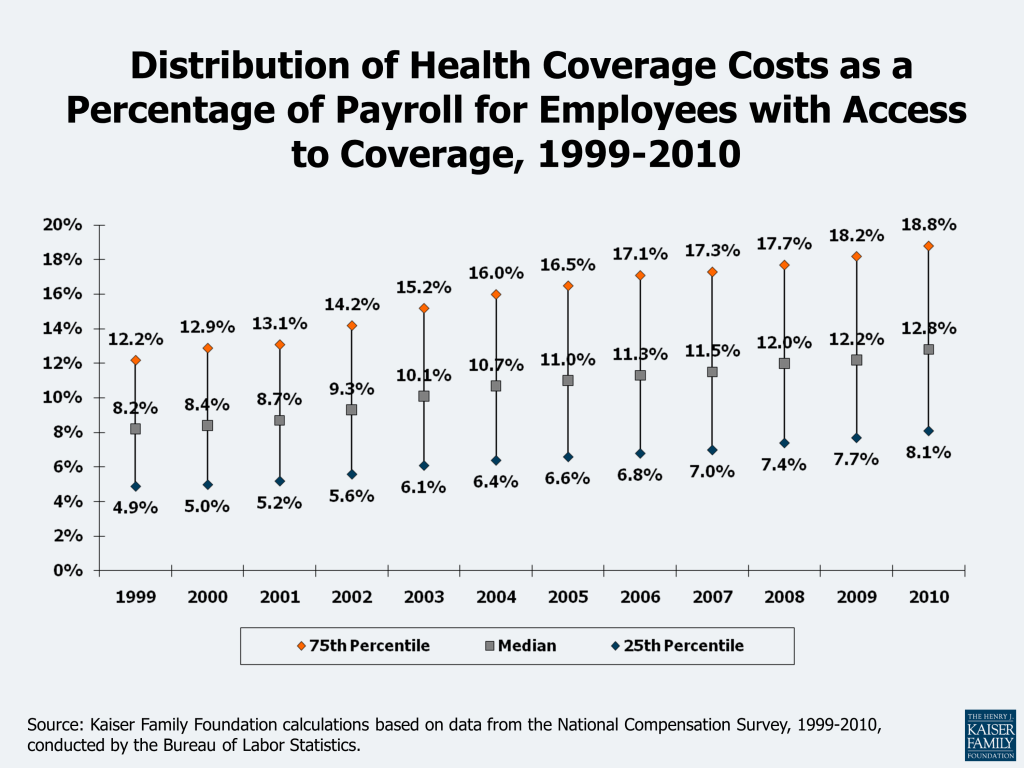
Employer shares of payroll going toward health insurance costs continue to rise. Among workers with access to health insurance at their job, the percentage of payroll paid by employers for health insurance has risen steadily in recent years. The median employer contribution (i.e., it was higher for one-half of workers and lower for the other half of workers) was 12.8% of payroll in 2010, up from 8.2% in 1999 (Figure 11). These percentages reflect contributions by employers for the cost of health insurance and do not include amounts that employees are required to contribute for their share of the premiums. There is significant variation across the workforce in the share of compensation going toward health insurance: 25% of workers with access to health insurance at work had employer costs for health insurance that were equal or less than 8.1% of payroll in 2010, while another 25% had employer costs for health insurance that were equal to or exceeded 18.8% of payroll. Employers contributed higher amounts, measured in cents per hour, for workers in higher-wage occupations than workers in lower-wage occupations. Viewed as a percentage of payroll, however, employer costs for health insurance represent a greater share of compensation for workers in lower-wage occupations than for workers in higher-wage occupations (see http://www.kff.org/insurance/snapshot/Employer-Health-Insurance-Costs-and-Worker-Compensation.cfm).
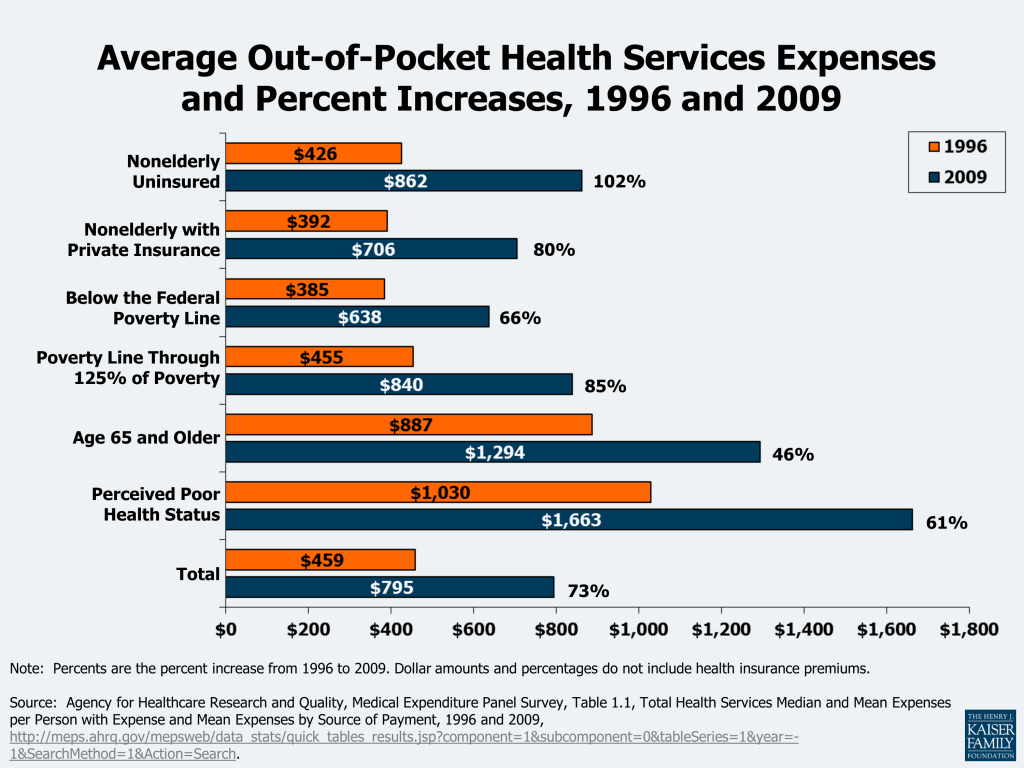
Families also are paying more out-of-pocket for health care. Another way of gauging the burden of rising health costs on households is to look at family medical out-of-pocket payments. These payments include the medical expenses of the uninsured and, for the insured, cost sharing (deductibles, coinsurance, and copayments) for covered services and amounts not paid for by insurance, such as out-of-network balance billing expenses and payments for non-covered services. While out-of-pocket spending as a share of total national health spending has declined (Figure 9) over time, the actual dollar amounts that families spend for medical services continue to rise (the reason that the out-of-pocket share of total spending continues to fall is that the amounts paid by private insurance and government programs have risen faster than the amounts paid out-of-pocket by families). In 2009, the average expenses paid out-of-pocket for medical services were $795, an increase of 73% over the $459 spent in 1996 (Figure 18). Average out-of-pocket expenses were higher for the elderly ($1,294 in 2009) and those who reported being in poor health ($1,663 in 2009). The nonelderly uninsured paid, on average, $862 out-of-pocket in 2009, compared to $706 for those with private insurance. Those whose poverty status was negative or poor (below the Federal poverty line, which was $22,050 in 2009 for a family of 4) paid $638 of their medical expenses out-of-pocket in 2009; for the near poor (over the poverty line through 125% of the poverty line), it was $840.
A recent survey found that more than one in five Americans (21%) were in families reporting problems paying medical bills in 2010, an increase over the 15% in 2003.18 The 2010 proportion (21%) was similar to the 19% in 2007, which the authors indicate may be attributable to a decreased use of medical care by people who lost jobs and health insurance during the 2007-2009 recession and those who reduced their medical care because of uncertain economic conditions. The uninsured were more likely than the insured (32% vs. 20%) and the low income were more likely than those with higher income (29% vs. 9%) to be in families with medical bill problems. Survey respondents reported that some of the financial consequences of their medical bill problems included problems paying for other necessities (66%), contacted by a collection agency (65%), and took money out of savings (65%). One in four (25%) thought about filing for bankruptcy and, of those, 20% did so (i.e., about 5% of all people in families with medical bill problems filed). For those with problems paying medical bills, the average family medical debt was $6,500 in 2010; 33% owed $5,000 or more. More than half (55%) had paid off none or just a little of the debt.
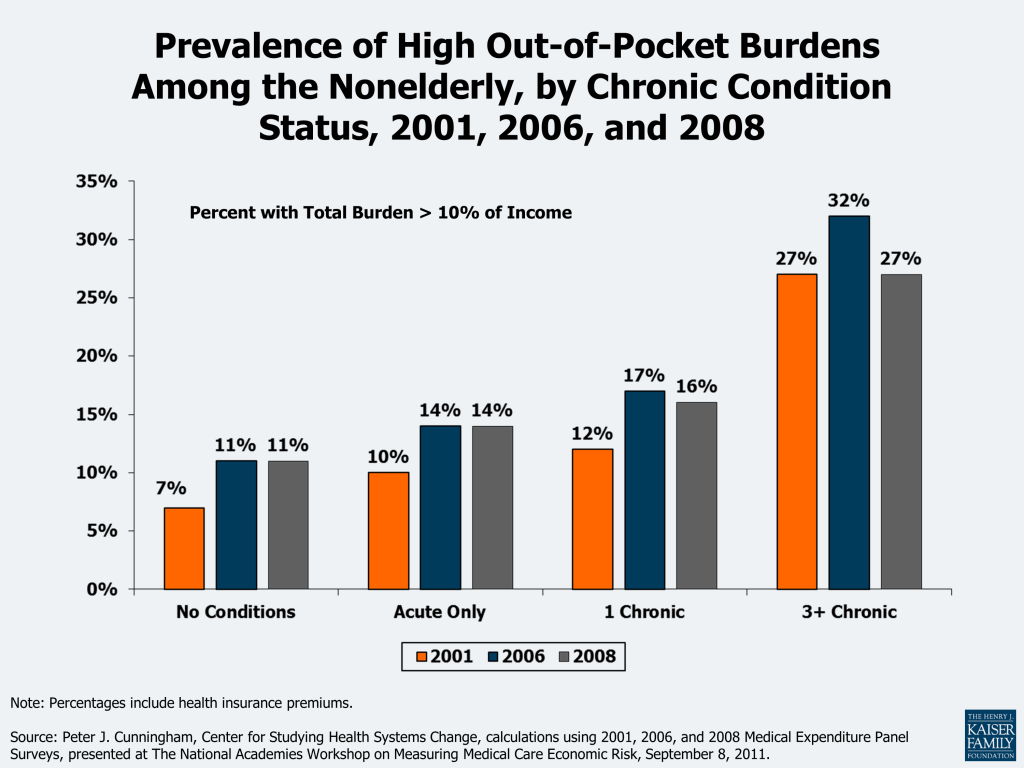
Examining the financial burden of out-of-pocket spending among the nonelderly finds that those with chronic medical conditions experience higher costs relative to their income. In 2008, 27% of those with 3 or more chronic conditions had out-of-pocket medical costs (including family contributions for health insurance premiums) that exceeded 10% of their income, compared to 16% with 1 chronic condition, 14% with acute medical conditions, and 11% with no medical conditions (Figure 19).
Health care costs have a significant impact on people’s income. A recent study found that although a median-income family of four’s monthly income increased by $1,910 from 1999 to 2009, this gain was offset to a great extent by increased spending on health care ($820, or 43% of the income growth), including health insurance premiums, out-of-pocket health spending, and taxes devoted to health care (not adjusted for inflation).19 Ongoing research into measures of poverty has found that health care costs are a significant expenditure for families and individuals. Recent analysis by the Census Bureau found that of the various types of expenses that could be used in the development of a new supplemental measure of poverty, out-of-pocket medical costs has the largest effect, potentially increasing the rate of those in poverty from 12.7% to 16.0% in 2010, a difference of about 10 million people, with the greatest impact for those age 65 and older.20 Research continues on the supplemental poverty measure, including an adjustment for the medical expenses of the uninsured.
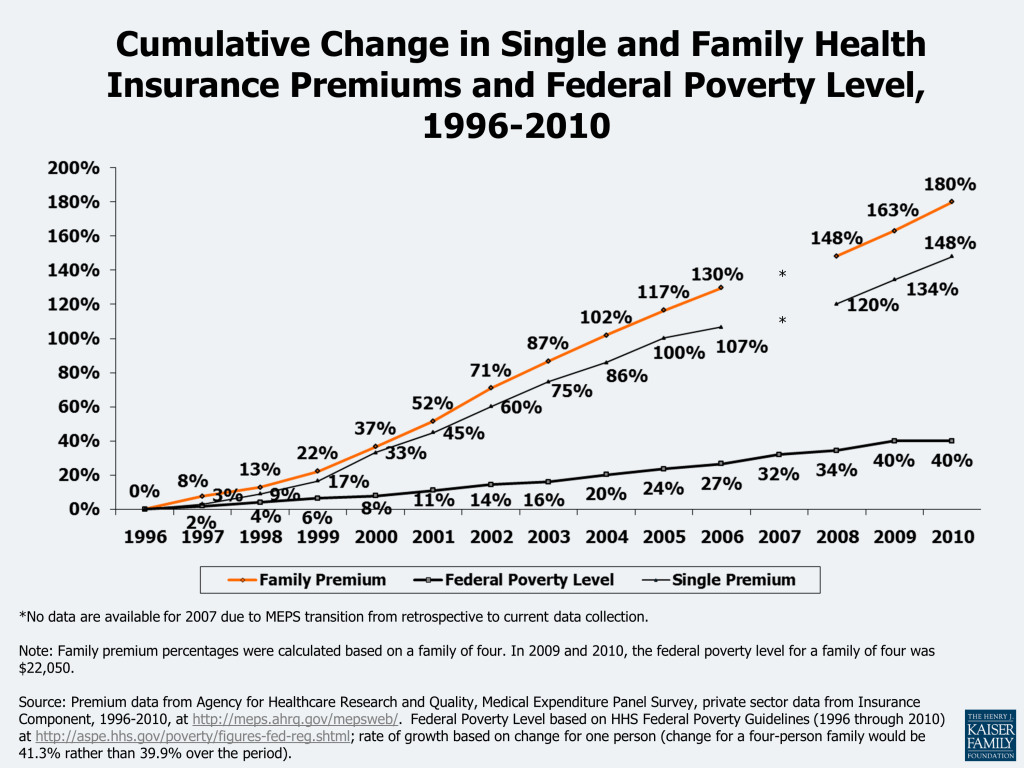
Eligibility standards for public programs such as Medicaid and CHIP do not keep pace with rapid increases in the cost of health coverage. Public programs provide health insurance coverage to people who are considered too poor to afford the full cost of coverage on their own. Medicaid also covers many children and individuals with disabilities who may not be able to afford or find private coverage to meet their needs. Eligibility for these programs is generally restricted to people in families with incomes at or below specific poverty levels (although it varied by state, as of January 2012 the median eligibility threshold at which children qualified for Medicaid or CHIP was 250% of poverty; Medicaid coverage for parents was much lower than for children, with the median eligibility threshold for working parents at 63% of poverty and for jobless parents at 37% of poverty).21 The cost of health insurance, however, has risen substantially faster than the increase in FPL over time (Figure 20). For people whose income just exceeds the eligibility standards for public coverage, the share of family income required to pay for private health insurance increases substantially (see example at http://www.kff.org/insurance/snapshot/chcm021507oth.cfm). Lower and moderate income families will receive assistance in 2014 under the ACA with the implementation of new tax credits that will be available to help them pay for private health insurance.
Why Are Health Care Costs Growing Faster Than the Economy Overall?
As shown in Figure 1, the portion of the economy devoted to health care has risen steadily for at least 50 years, rising from 5.2% of GDP in 1960 to 17.9% of GDP in 2010. CMS estimates that nearly one-fifth (19.8%) of GDP will be devoted to health care by the year 2020.22 Although recent increases in health care spending have declined relative to increases in the GDP, the questions still remains — why does spending on health care grow faster than overall economic growth?23
Wealthier countries can afford to spend more on health care technologies. Studies looking at the United States and other economies have found a strong correlation between wealth and health care spending – as nations become wealthier, they chose to spend more of their wealth on health care.24 Nations can spend more because the health care community continues to learn more every day about human health and health care conditions and, with that knowledge, is constantly expanding the inventory of health care products, techniques, and services that are available to address those conditions. Health care experts point to the development and diffusion of medical technology as primary factors in explaining the persistent difference between health spending and overall economic growth, with some arguing that new medical technology may account for about one-half or more of real long-term spending growth.25
The U.S. population is getting older and disease prevalence has changed. Other factors also influence spending growth. The U.S. population is aging (CBO estimates that the number of people age 65 or older will increase by about one-third between 2012 and 2022), and because older people have more health problems and use more health care than younger people, population aging will have a small but persistent impact on cost growth in the years to come.26 Increases in disease prevalence, particularly chronic diseases such as diabetes, asthma, and heart disease, coupled with the growing ability of the health system to treat the chronically ill, contribute to the high and growing levels of health spending. Rising obesity levels are another factor which may be influencing cost growth, but other trends, such as lower levels of smoking and alcohol consumption, may have a moderating effect.27 A small share of the population accounts for a high proportion of costs (see Figure 5). Developments in medicine and medical technology enable people who otherwise might have died to live longer, though perhaps with chronic conditions such as cancer or HIV/AIDS which require ongoing medical care.
Insurance coverage has increased. Government subsidies for health coverage also affect cost levels and potentially cost growth. Tax subsidies for health insurance and public coverage for certain groups (poor, disabled, and elderly) reduce the cost of health care to individuals, encouraging them to use more of it. Some argue that the high prevalence of health insurance encourages health technology development because those developing new technologies know that insurance will bear a substantial share of any new costs.28
Americans pay a lower share of health expenses than they used to. Another factor that may help explain rising health spending is the falling share of health care expenditures that Americans pay out-of-pocket.29 Between 1970 and 2010, the share of personal health expenditures paid directly out-of-pocket by consumers fell from 40% to 14%. Although consumers faced rising health insurance premiums over the period which affected their budgets, lower cost sharing at the point of service likely enabled consumers to use more health care, leading to expenditure growth.
Unnecessary spending in the US health care system. Some have estimated that 20% or more of total health care expenditures is due to various forms of waste, including overtreatment, failures of care coordination, failures of care delivery, administrative complexity, pricing failures and fraud and abuse.30 Other studies found that from $600 billion to $850 billion in waste could be cut annually from the U.S. health care system, and if waste reduction could be applied over the next 10 years, $3.6 trillion in wasteful spending could be saved, which is 10% of projected health care expenditures over the time period.31 Unnecessary or inappropriate treatments and tests are believed to contribute to the high level of health care costs, most recently addressed by the recent Choosing Wisely campaign, where nine physician groups (more in the future) have identified commonly used tests or procedures they say are often not necessary.32 Inefficiencies in medical care delivery and financing also contribute to health care costs. Wide variation in the use and cost of services across providers and in different geographic areas has called into question the appropriateness and value of the care received. The role of provider payment has also been cited as contributing to increased costs by, for example, encouraging the use of specialists or profitable equipment. The lack of integrated, efficient systems to electronically store and transmit health data is said to contribute to higher costs and limit the data available to study treatment effectiveness.33
Recent slow-down in health spending. The slower growth in health care spending in recent years is attributed to the downturn in the US economy in 2008 and 2009. As unemployment rose during the recession that lasted from December 2007 through June 2009, people lost their jobs and often their health insurance as a result. Even those with insurance used fewer health care goods and services given financial uncertainties. Economic recessions have historically had a lagged impact on health care spending because insurance contracts typically lock-in premiums and benefits for a year, and when consumers lose their jobs, they may maintain their coverage through COBRA, a spouse’s policy, or a public program. But the slowdown in health spending from the most recent recession occurred sooner than in previous recessions because of, according to CMS, “the highest unemployment rate in 27 years, a substantial loss of private health insurance coverage, employers’ increased caution about hiring and investing during the recovery, and the lowest median inflation-adjusted household income since 1996.”34 Others attribute a longer-term slowdown to the moderation of rapid growth following the backlash against managed care in the late 1990s and changes in benefit design to higher enrollee cost sharing.35 As the economy improves, increases in health care spending may return to higher levels.
What Can Be Done To Address Rising Costs?
Finding a way to address high costs and cost growth without unreasonably reducing access to new and needed services is a significant challenge.36 The information presented above shows that the United States faces two issues with health care costs: (1) the amount that is spent in the U.S. per person for health care is high, particularly when compared with the amounts peer nations pay for care (with almost half of U.S. health care spending used to treat just 5% of the population in 2009); and (2) health care expenditures grow rapidly relative to the economy overall, and have consistently done so for decades. Policymakers considering policy interventions related to costs need to distinguish between factors that affect how much health care costs at a point in time and factors that affect long-term cost growth.
Some approaches for dealing with health care costs can make spending more effficient, but will not address some of the key underlying pressures fueling long-term cost growth. Many of the policies under discussion in health policy circles to address costs – such as increasing the use of electronic medical records and other information technology, promoting evidence-based medicine, reducing unnecessary service use, a provider payment reform such as medical homes and accountable care organizations, changing the tax treatment of health benefits, consumer-directed health care, disease prevention and chronic disease management, or eliminating fraud and waste – are all largely aimed at improving the efficiency with which care is delivered. Successfully implementing any of these policies, and none of them are easy, would reduce the amount that we pay on average for care right now, but they are not likely to bring health care spending growth to down to the level of GDP growth.
For example, evidence suggests that medical errors and other quality lapses very likely increase the amount that we pay for health care, but to influence long-term cost growth, the prevalence or severity of errors and poor quality would need to be an increasing share of expenditures each year, which is probably not likely. Policies that reduce medical errors may well reduce the amount that we pay for care (and are important even if they do not). But assuming that errors can be reduced to more optimal levels, costs would likely continue to grow, albeit from a lower level, at rates that exceed economic growth in general. Other interventions intended to make the health system more efficient, such as reducing the use of unnecessary tests or disparities in health care practices across regions and providers, would likely have similar effects. Successful implementation of these initiatives such as these appear to be slowing growth because the level of costs is being rebased, but when more optimal levels are achieved, the growing demand for services (as people get wealthier) and the availability of new or better treatments and services may well push the growth rate for health care costs back up to higher levels.
The amount of unnecessary, inappropriate or wasteful care delivered in the United States is estimated to be quite high, so there is potential for substantial savings if care patterns could be improved. Recent investments in health information technology (e.g., electronic medical records, regional health information organizations) and care integration (e.g., medical homes, accountable care organizations) are among the latest efforts to attempt to address these long-standing problems and have potential to move care delivery toward a more consistent and evidence-based model. The challenge is to make health care decisions more informed and collaborative within a delivery system that is often highly disaggregated and dependent on a multiple public and private payers with varying priorities and payment approaches. A partial answer to this challenge may come from some of the new payment approaches being implemented or demonstrated by Medicare under new authority contained in the ACA (see below). In the past, successful payment strategies adopted by Medicare (such as DRGs for hospital payments and the RBRVS for paying physicians) have been widely adopted by private payers and have become industry standards. Medicare is a substantial payer and is able to exert a significant influence on the delivery system. New attention in Medicare to more integrated and accountable approaches to delivery and payment may establish organizations and systems that can be more widely adopted and reinforced by other public and private payers.
Over the longer run, the ability of the health care system to treat more conditions and deliver more care means that health care costs will grow faster than the economy as a whole. As incomes rise, societies generally spend more of their wealth on health care. Health care is a vital good and through research and innovation the health care system is able to provide new and better services and address previously untreatable conditions. Over the longer run, this continuing innovation increases health, but challenges societies to find ways to pay for the increasing costs. Bringing health spending growth closer to the rate of overall economic growth would likely require finding ways to slow the development, diffusion, and use of new health care technologies and practices. Doing so necessarily restrains spending that may improve health, so policy makers need to be mindful of the difficult tradeoffs involved in such decisions.
One approach that is widely used in other countries and is beginning to be implemented in the United States is developing approaches to explicitly assess and weigh the benefits and costs of new technologies, although such evaluations present serious challenges.37 The sheer volume and pace of medical advances would make it difficult to assess important changes before they are incorporated into medical practice; focusing on the most expensive new treatment options might be more practical and could have a meaningful impact on cost growth.38 Legislation in 2009 and 2010 has provided federal funding for the development and dissemination of comparative effectiveness research. Health technology assessment may also involve difficult decisions about whether a medical benefit is worth the cost and whether it should be covered by a public or private insurance program. For example, the National Institute for Health and Clinical Excellence (NICE), the U.K. authority charged with approving medical treatments, received widespread criticism when it excluded beta interferon to treat multiple sclerosis from the list of publicly-covered treatments.39
Another way to slow technology and innovation growth is increasing patient cost sharing. Higher cost sharing reduces demand (and for people with few resources, may essentially prevent access to some services), which over the longer run will dampen incentives for research and investment. This approach is controversial for many reasons, in large part because it can raise cost barriers to even necessary and appropriate care. There also may be limits to how high cost sharing can go before it is considered too punitive to be acceptable to employers and families purchasing coverage.
Payment and delivery system reforms also could have a moderating effect on the diffusion and use of new technologies in some cases. Payment approaches that bundle payments or otherwise shift risk to groups of providers for the cost or use of services may discourage them from investing in or using new services or technologies where value is not clear or appreciably better than current treatments. Providers that share a fixed or contingent payment for a bundle of services are likely to be critical of investments that incur new costs without corresponding benefits. As of now, very little of overall health spending is made through bundled or at risk payments, so this influence is likely to be small unless new payment approaches become more common and more coordinated delivery arrangements evolve.
Provisions in the health reform law (ACA) that affect health care costs. The ACA makes many changes to the way health coverage and health care will be provided and paid for in the future, both in public and in private settings. The law includes a requirement, with some exceptions, that people obtain health insurance, creates new sources of coverage through health insurance exchanges, provides for premium and cost-sharing subsidies for those with low incomes, significantly expands Medicaid eligibility, makes benefit changes and other changes designed to slow the growth of Medicare spending, restructures the private health insurance market, and includes numerous other health-related provisions. While the expansion of insurance coverage under the ACA will increase the level of health care spending in the short term, the Congressional Budget Office has estimated that after an initial increase, many of the law’s provisions will lower the rate of growth of health care spending over time. (FN) Many of the law’s provisions won’t be implemented until 2014.
The health care cost containment provisions in the ACA include those designed to control costs in both the short-term and long-term.40 Some of the short-term approaches, which aim to reduce the level of health care costs rather than their growth rate, include: reducing payments to providers (e.g., reducing payments to Medicare Advantage plans, reducing the update factor for Medicare hospital payments, increasing the rebates that pharmaceutical companies pay to Medicaid plans); eliminating unnecessary costs such as fraud and abuse in Medicare and Medicaid; simplifying health insurance administration by creating uniform electronic standards and operating rules for all private insurers, Medicare, and Medicaid; implementing hospital value-based purchasing programs; and establishing an approval process for generic biologic agents.
Other ACA provisions are designed to make health system changes that would address rising costs over the long term, primarily by making the delivery of medical services more efficient and less costly. A new Center for Medicare and Medicaid Innovation will create and evaluate experimental models in health care delivery, care coordination, and payment including: the Medicare Shared Savings Program where groups of health care providers known as accountable care organizations will coordinate their services to patients and will be allowed to share in any cost savings; programs to test methods to “bundle” services from different providers so that Medicare and Medicaid beneficiaries receive more coordinated and more efficient care; patient-centered medical homes for patients with chronic illness; contracts to states to develop models to improve the quality and coordination of care for patients eligible for both Medicare and Medicaid (“dual eligibles”). It is hoped that these Medicare and Medicaid models, if successful, could be applied to the total population. Other long-term approaches in the ACA include a new Independent Payment Advisory Board which, in addition to its Medicare responsibilities, is required to develop recommendations to slow the growth in private national health expenditures while preserving or enhancing quality of care. The ACA creates a private Patient-Centered Outcomes Research Institute to identify research priorities and conduct and disseminate research on the comparative effectiveness, risks, and benefits of different treatments and services so that those providing little or no value can be determined. The excise tax on high-cost employer-sponsored health plans is designed to encourage employers to make their plans more efficient and to encourage workers to use fewer services.
CMS estimates that health-spending growth due to the ACA for 2010 (the most recent data available) is estimated to be 0.2 percentage points, largely due to the provisions that affected Medicare spending.41 While estimators have done their best to predict how the ACA would affect future health spending, both federal and in total, there is admittedly significant uncertainty around the estimated costs and impact of the new law.42 The pervasive changes in financing and delivery are unprecedented, and many of the institutions and reforms have not been proven on a large scale or in diverse settings. There are questions about the potential effectiveness of the requirement to purchase coverage, the sufficiency of the premium tax credits and cost-sharing subsidies, the ability of states to implement the changes effectively, the long-term impact of the reductions in Medicare payments on hospitals and other providers, as well as about the potential effectiveness of the delivery system reforms that will take shape and be implemented over the next several years. In particular, there is hope, but as of yet only spotty evidence, that changes in health information capabilities and implementation of new payment approaches that use that information to better align reimbursement with the achievement of better health can change the trajectory of future growth in public and private health programs.
Changing the role of government in health care decisions and payments. The U.S. health care system is a mix of public and private payment and delivery arrangements. Compared to many developed countries, public health insurance plays a relatively small role in covering the population. While the vast majority of the elderly and many of the poor in the United States are covered through public health insurance programs, most of the population is covered by private health insurance, albeit with significant tax financing to help supplement premiums paid by families and their employers. Private health insurers largely mediate the price and use of services for people covered by private health insurance.
To more directly control cost growth, the United States could adopt more direct interventions that are used in some other countries. For example, the government (federal or at the state level) could set targets or caps for spending on health care services; targets could be set legislatively or the government could facilitate negotiations between provider organizations and payers. The government also could establish prices for services or even payment approaches that public and private payers would use. This approach would equalize prices across payers and focus competition on health management and customer service. On the insurance side, the government could constrain premium growth, forcing insurers to negotiate more favorable contracts with their participating providers.
At the other end of the spectrum, the United States could lower health care spending by reducing the role of government in the health care system. Critics of government involvement argue that reducing the government role would result in a leaner, more efficient system that spends less. For example, reducing or eliminating the tax preference for employer-provided insurance would reduce its value to employees (relative to more wages) and would likely result in employers offering less generous coverage which would likely reduce the amount of health care on average that enrollees consume.43 Reducing federal and state regulation of health plans and health benefits would reduce administrative costs and permit insurers to offer leaner benefit packages at lower premiums. Spending for public health programs could also be lowered by paring benefits or requiring larger beneficiary cost sharing, each of which would reduce the amount of care sought by beneficiaries.
Large changes that either expand or reduce the current roles that governments play in the health care system are likely to be very controversial and difficult to accomplish in the current political climate, where there is a deep partisan division over the role of government generally and in health care specifically. Direct government intervention in pricing is uncommon in the United States, and the vigorous opposition to even a public health insurance option in the recently enacted ACA suggests that a broader role for government is unlikely in the foreseeable future. Dramatic deregulation or significant reductions in federal support for health care would also be difficult to sustain politically because they would be viewed as a take away by large numbers of people who would be directly affected. Incremental changes, such as those in the ACA, are more acceptable politically (although the ACA was passed overwhelming on partisan lines), but are unlikely to produce more than modest changes to the cost of health care in the United States.
Improving population health. Studies have shown that a disproportionate share of health spending is used to treat chronic and often preventable diseases such as diabetes, obesity,44 and heart disease.45 Efforts to improve population health could have a long-term effect on disease prevalence and help reduce health care spending. Efforts could include increased spending on public health activities including community efforts, providing insurance and workplace health promotion and disease prevention programs, encouraging adherence to medical guidelines for prescription drugs, and educating patients about the benefits of a healthy life-style and treatment options.
Conclusion
Policymakers face significant challenges, short and longer term, as they think about how the nation will pay for the growing cost of health care. The health reform legislation enacted in 2010 (the ACA) contains provisions designed to achieve health care cost containment. But there are so many facets to health care reform — expanding coverage for the uninsured, reducing health care costs for individuals and employers, controlling entitlement spending for government programs such as Medicare and Medicaid, and reforming the health care delivery system, to name a few — that it is unclear how cost containment provisions will prosper in the dramatically changing health care environment. Successfully improving the efficiency and quality with which care is delivered is an enormous challenge, one that will require substantial investment in research, new information systems, performance incentives, and education, with the hope of transforming how health care is delivered by thousands and thousands of providers dispersed across our largely disaggregated health care system. Coming to terms with the potential of medical technology and its long-run influence on costs is a different type of challenge, but one that is also important. The advances in health care that have occurred over the past half-century have increased how long we live and have reduced the burden of disease for countless people. Developing the philosophical, ethical, and political framework necessary to balance the benefits of future advances with our ability to pay for them is one of the next great challenges for health policy.
Endnotes
- P.L. 111-148, The Patient Protection and Affordable Care Act, as amended by the Health Care and Education Reconciliation Act of 2010 (P.L. 111-152), collectively known as the Affordable Care Act, or the ACA. ↩︎
- Congressional Budget Office, CBO’s 2011 Long-Term Budget Outlook, June 2011, p.ix, http://www.cbo.gov/ftpdocs/122xx/doc12212/06-21-Long-Term_Budget_Outlook.pdf. ↩︎
- See, e.g., A Roadmap for America’s Future, Rep. Paul Ryan, introduced as H.R. 4529, January 27, 2010, http://www.roadmap.republicans.budget.house.gov/; Pew Economic Policy Group, No Silver Bullet, Paths for Reducing the Federal Debt, September 2010, http://www.pewtrusts.org/uploadedFiles/wwwpewtrustsorg/Reports/Economic_Mobility/Pew_DebtReport_Final.pdf?n=626 and The Peterson-Pew Commission on Budget Reform, Getting Back in the Black, November 2010, http://www.pewtrusts.org/uploadedFiles/wwwpewtrustsorg/Reports/Economic_Mobility/Peterson-Pew_report_federal_budget_process_reform.pdf ; and The National Commission on Fiscal Responsibility and Reform, The Moment of Truth, December 2010, http://www.fiscalcommission.gov/sites/fiscalcommission.gov/files/documents/TheMomentofTruth12_1_2010.pdf ; and http://www.fiscalcommission.gov/. ↩︎
- U.S. Department of Health and Human Services, Centers for Medicare and Medicaid Services, “NHE Projections 2010-2020,” August 2011, https://www.cms.gov/NationalHealthExpendData/03_NationalHealthAccountsProjected.asp#TopOfPage. ↩︎
- National Health Expenditure Projections, 2010-2020, https://www.cms.gov/NationalHealthExpendData/downloads/proj2010.pdf. ↩︎
- Anne B. Martin et al., “Growth in US Health Spending Remained Slow in 2010; Health Share of Gross Domestic Product was Unchanged from 2009,” Health Affairs, 31, no.1 (2012), p.1. ↩︎
- Kaiser Family Foundation, “The Economy and Medical Care,” November 15, 2011, http://healthreform.kff.org/notes-on-health-insurance-and-reform/2011/november/the-economy-and-medical-care.aspx. ↩︎
- We report OECD data for the United States where the comparison to other countries is of interest. Note that accounting for national health expenditures used by the OECD and CMS are largely but not entirely in accordance. For example, CMS accounting of national health spending includes the value of health-related research whereas OECD-reported data exclude this amount. Further, OECD accounting makes adjustments for the export and import of health services while CMS does not. For more information, see: Eva Orosz, “The OECD System of Health Accounts and the US National Health Account: Improving Connections through Shared Experiences,” draft paper prepared for the conference “Adapting National Health Expenditure Accounting to a Changing Health Care Environment,” Centers for Medicare & Medicaid Services, April 2005, http://www.cms.hhs.gov/NationalHealthExpendData/downloads/confpaperorosz.pdf. ↩︎
- OECD Health Data: Health expenditure and financing, OECD Health Statistics online subscription database, accessed 1/19/12. ↩︎
- World Health Organization, Global Health Observatory, http://www.who.int/gho/en/; Urban Institute, E. Docteur and R. Berensen, How Does the Quality of US Health Care Compare Internationally? August 2009, http://www.urban.org/uploadedpdf/411947_ushealthcare_quality.pdf; David Squires, Multinational Comparisons of Health Systems Data, 2011, The Commonwealth Fund, December 2011, http://www.commonwealthfund.org/Publications/Chartbooks/2011/Dec/Multinational-Comparisons-of-Health-Data-2011.aspx; 2011 Commonwealth Fund International Health Policy Survey, November 2011, http://www.commonwealthfund.org/Surveys/2011/Nov/2011-International-Survey.aspx; McKinsey Global Institute, “Accounting for the Cost of US Health Care: Pre-reform Trends and the Impact of the Recession,” December 2011, http://healthreform.mckinsey.com/Home/Insights/ Latest_thinking/ Accounting_for_the_cost_of_US_health_care.aspx. ↩︎
- David A. Squires, Explaining High Health Care Spending in the United States: An International Comparison of Supply, Utilization, Prices, and Quality, The Commonwealth Fund, May 3, 2012, http://www.commonwealthfund.org/Publications/Issue-Briefs/2012/May/High-Health-Care-Spending.aspx. ↩︎
- The source for this information is the Medical Expenditure Panel Survey (MEPS), Household Component, conducted by the Agency for Health Care Research and Quality, U.S. Department of Health and Human Services. The survey collects information on the U.S. civilian, noninstitutionalized population. Spending for people in the military or in longer-stay institutions, such as nursing homes, is not included in the totals or the spending distributions calculated from the survey. This means that some of the spending that is measured by the National Health Expenditures Accounts, which is the data source for the national total and per capita spending discussed above, is not accounted for in the tables based on MEPS. ↩︎
- Centers for Medicare and Medicaid Services, Office of the Actuary, National Health Statistics Group, “National Health Expenditures 2010 Highlights,” https://www.cms.gov/NationalHealthExpendData/downloads/highlights.pdf . ↩︎
- Centers for Medicare and Medicaid Services, Office of the Actuary, National Health Statistics Group, “National Health Expenditures 2010: Sponsor Highlights,” https://www.cms.gov/NationalHealthExpendData/downloads/sponsors.pdf. ↩︎
- Kaiser Family Foundation, Kaiser Health Tracking Poll, August 10-15, 2011, pp.16-18, http://modern.kff.org/kaiserpolls/upload/8217-T.pdf. ↩︎
- Kaiser Family Foundation, Kaiser Health Tracking Poll, June 2010, p. 25, http://modern.kff.org/kaiserpolls/upload/8082-T.pdf. ↩︎
- Kaiser Family Foundation, Kaiser Health Tracking Poll, September 2011, p.11, http://modern.kff.org/kaiserpolls/upload/8230-T.pdf. ↩︎
- Anna Sommers and Peter J. Cunningham, Center for Studying Health System Change Tracking Report #28, “Medical Bill Problems Steady for U.S. Families, 2007-2010,” December 2011, http://www.hschange.com/CONTENT/1268/. ↩︎
- David. I.. Auerbach and Arthur L. Kellermann, “A Decade of Health Care Cost Growth has Wiped Out Real Income Gains for an Average US Family, “ Health Affairs, 30:9, pp. 1630-1663, September 2011. ↩︎
- Kathleen Short, U.S. Census Bureau, “The Research Supplemental Poverty Measure: 2010,” November, 2011, http://www.census.gov/hhes/povmeas/methodology/supplemental/research/Short_ResearchSPM2010.pdf. ↩︎
- Kaiser Commission on Medicaid and the Uninsured, Performing Under Pressure: Annual Findings of a 50-State Survey of Eligibility, Enrollment, Renewal, and Cost Sharing Practices in Medicaid and CHIP, 2011-2012, January 2012, p.11, http://modern.kff.org/medicaid/upload/8272.pdf. ↩︎
- U.S. Department of Health and Human Services, Centers for Medicare and Medicaid Services, National Health Expenditure Projections 2010-2020, July 2011, https://www.cms.gov/NationalHealthExpendData/03_NationalHealthAccountsProjected.asp#TopOfPage. ↩︎
- See McKinsey Center for U.S. Health System Reform, Accounting for the cost of U.S. Health Care, December 2011, http://healthreform.mckinsey.com/Home/Insights/Latest_thinking/Accounting_for_the_cost_of_US_health_care.aspx; Anne Martin et al., “Recession Contributes to Slowest Annual Rate of Increase in Health Spending in Five Decades,” Health Affairs, vol. 30, no. 1, January 2011, pp. 11-22; Henry J. Aaron and Paul B. Ginsburg, “Is Health Spending Excessive? If So, What Can We Do About It? Health Affairs, September-October 2009, pp. 1260-1275; Michael E. Chernew et al., “Increased Spending on Health Care: Long-Term Implications for the Nation,” Health Affairs, vo. 28, no. 5, September/October 2009, pp.1253-1255; Paul B. Ginsburg, Robert Wood Johnson Foundation, High and Rising Health Care Costs: Demystifying U.S. Health Care Spending, Research Synthesis Report No. 16, October 2008, http://www.rwjf.org/healthreform/product.jsp?id=35368;. ↩︎
- Joseph P. Newhouse, “Medical Care Costs: How Much Welfare Loss?” The Journal of Economic Perspectives, vol. 6, no. 3, 1992, pp. 3-21; Chris L. Peterson and Rachel Burton, Congressional Research Service, U.S. Health Care Spending: Comparison with Other OECD Countries, September 17, 2007; Chapin White, “Health Care Spending Growth: How Different is the United States from the Rest of the OECD?” Health Affairs, January/February 2007, pp. 154-161. ↩︎
- Ibid. Sheila Smith, Joseph P. Newhouse, Mark S. Freeland, “Income, Insurance, And Technology: Why Does Health Spending Outpace Economic Growth? Health Affairs, September-October 2009, pp. 1276-1284; Richard A. Rettig, “Medical Innovation Duels Cost Containment,” Health Affairs, vol. 13, no. 3, 1994, pp. 7-27; Kaiser Family Foundation, How Changes in Medical Technology Affect Health Care Costs, March 2007, http://modern.kff.org/insurance/snapshot/chcm030807oth.cfm; Congressional Budget Office, Technological Change and the Growth of Health Spending, January 2008, http://www.cbo.gov/doc.cfm?index=8947. ↩︎
- Bradley C. Strunk, Paul B. Ginsburg, and Michelle I. Banker, “The Effect Of Population Aging On Future Hospital Demand,” Health Affairs, vol. 25, no. 3, 2006, pp. w141-w149; Bradley C Strunk and Paul B. Ginsburg, Aging Plays a Limited Role in Health Care Cost Trends, Center for Studying Health System Change Data Bulletin No. 23, September 2002. ↩︎
- Kenneth E. Thorpe et al, “Chronic Conditions Account for Rise in Medicare Spending from 1987 to 2006,” Health Affairs, 29, no. 4, April 2010; Kenneth E. Thorpe et al., “The Rising Prevalence Of Treated Disease: Effects On Private Health Insurance Spending,” Health Affairs, Web Exclusive, June 27, 2005, pp. w5-317 – w5-325; Kenneth E. Thorpe et al., “Trends: The Impact of Obesity on Rising Medical Spending,” Health Affairs, Web Exclusive, October 20, 2004. On trends in mortality rates, see, e.g., David M. Cutler, Edward L. Glaeser, and Allison B. Rosen, “Is the U.S. Population Behaving Healthier?” National Bureau of Economic Research, NBER Working Paper No. 13013, April 2007, http://www.nber.org/papers/w13013 and David M. Cutler, Your Money or your Life: Strong Medicine for America’s Health Care System, (New York: Oxford University Press, 2004). ↩︎
- See, e.g., John F. Cogan, R. Glenn Hubbard, and Daniel Pl. Kessler, Evaluating Effect of Tax Preferences on Health Care Spending and Federal Revenues, National Bureau of Economic Research, NBER Working Paper No. 12733, December 2006, http://www.nber.org/papers/12733.; Newhouse, 1992; and Burton A. Weisbrod, “The Health Care Quadrilemma: An Essay on Technological Change, Insurance, Quality of Care, and Cost Containment,” Journal of Economic Literature, vol. 29, no. 2, 1991, pp. 523-552. ↩︎
- John F. Cogan, R. Glenn Hubbard, and Daniel P. Kessler, “Evaluating Effects of Tax Preferences on Health Care Spending and Federal Revenues,” National Bureau of Economic Research, NBER Working Paper No. 12733, December 2006, http://www.nber.org/papers/w12733. ↩︎
- Donald M. Berwick and Andrew D. Hackbarth, “Eliminating Waste in US Health Care,” JAMA, Online March 14, 2012, pp. E1-E4. ↩︎
- Robert Kelley, “Where Can $700 Billion in Waste be Cut Annually from the U.S. Healthcare System?” Thomson Reuters, October 2009 (http://www.factsforhealthcare.com/whitepaper/HealthcareWaste.pdf) and B. Kelley and R. Fabius, “A Path to Eliminating $3.6 Trillion in Wasteful Healthcare Spending,” Thomson Reuters, 2010 (http://thomsonreuters.com/content/healthcare/pdf/white_papers/path_eliminating_36_trillion ). ↩︎
- Choosing Wisely, ABIM Foundation (American Board of Internal Medicine), April 2012, http://choosingwisely.org/wp-content/uploads/2012/03/033012_Choosing-Wisely-National-Press-Rls-FINAL.pdf. ↩︎
- Ibid, Ginsburg, 2008. ↩︎
- Anne B. Martin et al., “Growth in US Health Spending Remained Slow in 2010; Health Share of Gross Domestic Product was Unchanged from 2009,” Health Affairs, vol. 31, no.1, pp. 208-219, January 2012. ↩︎
- Jesse W. Bradford et al., “Accounting for the Cost of U.S. Health Care,” McKinsey Center for U.S. Health System Reform, December 2011, http://healthreform.mckinsey.com/. ↩︎
- See various cost control options at John Holahan et al., “Containing the Growth of Spending in the U.S. Health System,” Urban Institute, October 2011, http://www.urban.org/uploadedpdf/412419-Containing-the-Growth-of-Spending-in-the-US-Health-System.pdf and Theodore Marmor, Jonathan Oberlander, Joseph White, “The Obama Administration’s Options for Health Care Cost Control: Hope Versus Reality,” Annals of Internal Medicine, April 2009, Vol. 150, No.7. ↩︎
- Congressional Research Service, Comparative Clinical Effectiveness and Cost-Effectiveness Research: Background, History, and Overview, October 15, 2007; Congressional Budget Office, Research on the Comparative Effectiveness of Medical Treatments: Issues and Options for an Expanded Federal Role, December 2007, http://www.cbo.gov/doc.cfm?index=8891; Marcial Velasco Garrido et al., Health Technology Assessment and Health Policy-making in Europe, European Observatory on Health Systems and Policies, 2008, http://www.euro.who.int/Document/E91922.pdf. ↩︎
- Peter R. Orszag, 2008. ↩︎
- NICE argued that, based on models of beta interferon’s potential long-term benefits, about which evidence was not widely available, the high cost of the treatment did not justify its inclusion into the national benefits formula. ↩︎
- See, e.g., Peter R. Orszag and Ezekiel J. Emanuel, “Health Care Reform and Cost Control,” The New England Journal of Medicine, August 12, 2010, pp. 601-603; David Cutler, “How Health Care Reform Must Bend The Cost Curve, “ Health Affairs, June 2010, pp. 1131-1135; Peter R. Orszag, “Following Doctor’s Orders,” Office of Management and Budget Blog Post, April 1, 2010, http://www.whitehouse.gov/omb/blog/10/04/01/Following-DoctorOrders; Office of the Actuary, Centers for Medicare & Medicaid Services, letter from Richard S. Foster, “Estimated Financial Effects of the “Patient Protection and Affordable Care Act,” ” as Amended, April 22, 2010, https://www.cms.gov/ActuarialStudies/Downloads/PPACA_2010-04-22.pdf. ↩︎
- Anne B. Martin et al., Health Affairs, January 2012, p. 211. ↩︎
- In addition to uncertainty about economic projections, CBO states that the ACA “made broad changes to the nation’s health care and health insurance systems. There are great uncertainties surrounding the potential budgetary impacts of those changes because they require assumptions about an array of technical, behavioral, and economic factors.” See pp. 20-21 of The Budget and Economic Outlook: Fiscal Years 2011 to 2021, http://www.cbo.gov/ftpdocs/120xx/doc12039/01-26_FY2011Outlook.pdf. ↩︎
- For criticism of the tax treatment of employer-provided insurance, see John F. Cogan, R. Glenn Hubbard, Daniel P Kessler, Healthy, Wealthy, and Wise, The Hoover Institution Press. 2011, http://www.scribd.com/doc/48910486/Healthy-Wealthy-and-Wise-2nd-Edition-by-Cogan-Hubbard-Kessler and http://www.hoover.org/publications/defining-ideas/article/76796. ↩︎
- “Obesity Accounts for 21 Percent of U.S. Health Care Costs,” Newswise, April 9, 2012, http://www.newswise.com/articles/obesity-accounts-for-21-percent-of-u-s-health-care-costs. ↩︎
- Kenneth E. Thorpe, Lydia L. Ogden, and Katya Galactionova, “Chronic Conditions Account for Rise in Medicare Spending from 1986 to 2006,” Health Affairs, 29, no. 4, published online February 18, 2010, pp. 718-724. ↩︎