Medicare Part D Prescription Drug Plans: The Marketplace in 2013 and Key Trends, 2006-2013
Since 2006, Medicare beneficiaries have had access to prescription drug coverage offered by private plans, either stand-alone prescription drug plans (PDPs) or Medicare Advantage prescription drug plans (MA-PD plans). In 2013, more than 35 million Medicare beneficiaries are enrolled in Medicare drug plans, including 22.5 million in PDPs and 12.8 million in MA-PD plans; about 11 million Part D enrollees are receiving extra help through the Part D Low-Income Subsidy (LIS) program to pay their drug plan premiums and cost sharing. Part D has evolved since its inception in 2006 due to changes in the private plan marketplace and the regulations that govern the program. This report presents findings from an analysis of the Medicare Part D marketplace in 2013 and changes in drug coverage and costs since 2006..
Key Part D Facts in 2013
- Enrollees in Part D have, on average, a choice of 31 PDPs and about 20 MA-PD plans.
- The average PDP enrollee has a monthly Part D premium of $38.54 in 2013, but premiums vary considerably by region and plan sponsor. The least expensive PDP nationally has a $15.00 premium, while the most expensive plan charges $165.40
- Nearly all Part D plans (both PDPs and MA-PD plans) in 2013 use tiered cost sharing; two-thirds have five cost-sharing tiers.
- Most Part D plans use a specialty tier for high-cost medications in 2013, and many Part D enrollees are in plans with a 33 percent coinsurance rate for specialty tier drugs.
- Most plans (69 percent of PDPs) cover no more than is required by law in the benefit’s coverage gap.
- In 2013, the ten largest firms that sponsor Part D plans (both PDPs and MA-PD plans) account for more than three-fourths of all enrollees; three firms account for half of all enrollees; and UnitedHealth alone accounts for more than one in five Part D enrollees.
- The number of Low-Income Subsidy (LIS) benchmark plans varies by region, ranging from 2 in Florida and Nevada and 3 in Florida to 15 in Arkansas.
- One-fourth of PDP enrollees are in plans with lower-than-average ratings, while only 8 percent are in more highly rated plans..
PDP Trends to Watch
- Fewer PDPs are offered in 2013 than in any previous year, and the trend has been downward since 2007.
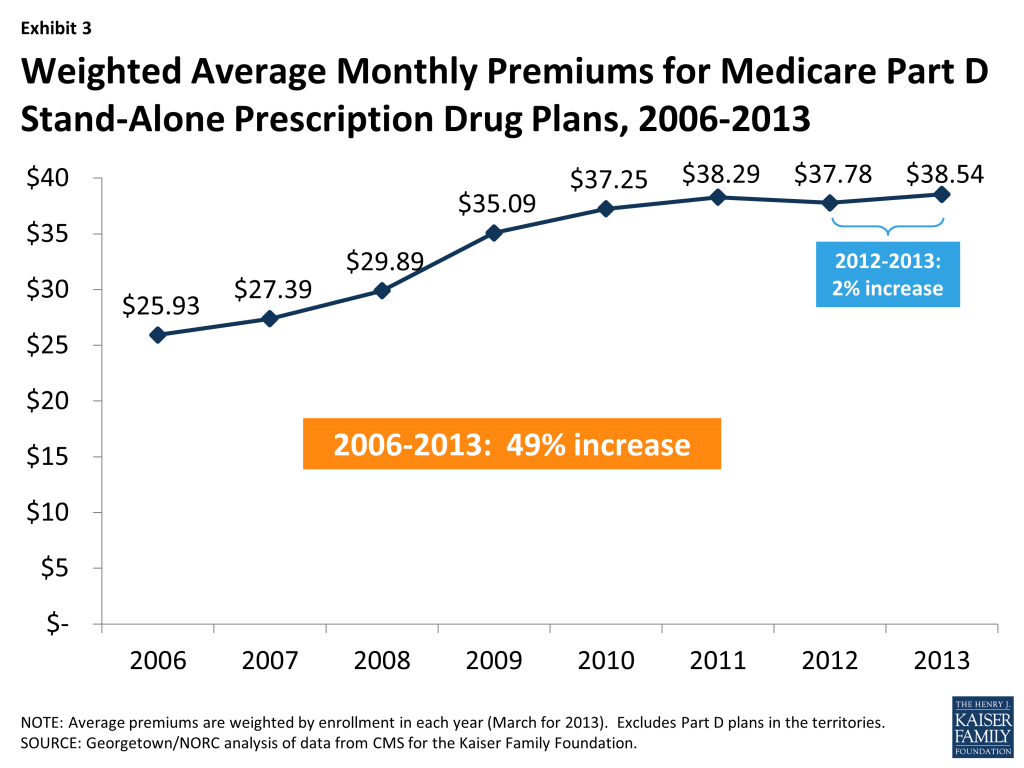
- The average PDP premium, weighted by enrollment, has increased by 49 percent since 2006, but has been nearly unchanged since 2010.
- The share of PDPs using percentage-based coinsurance for non-specialty brand-name drug tiers is on the rise, as is the share of plans with five tiers. Percentage coinsurance for non-preferred brand drugs is usually higher than that for drugs on the specialty tier.
- The median cost sharing for a 30-day supply of non-preferred brand-name drugs in PDPs has increased by 55 percent since 2006, from $55 to $85, while cost sharing for preferred brand drugs increased by 43 percent, from $28 to $40. But cost sharing for generic tiers is lower than in earlier years.
- PDPs have applied utilization management restrictions to an increasing share of on-formulary brand-name drugs over time.
- The Part D marketplace for LIS enrollees has been volatile, with only 15 plans qualifying as benchmark plans in every year from 2006 to the present.
INTRODUCTION
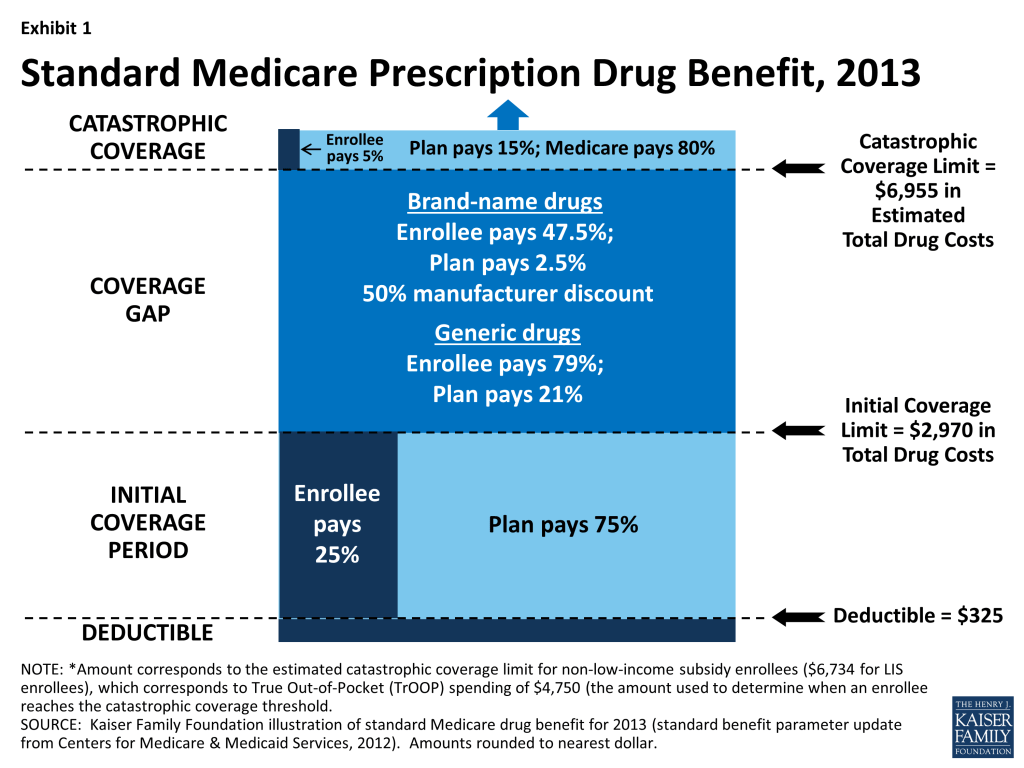
Since 2006, Medicare beneficiaries have had access to prescription drug coverage offered by private plans, either stand-alone prescription drug plans (PDPs) or Medicare Advantage prescription drug plans (MA-PD plans). These Medicare drug plans (also referred to as Part D plans) receive payments from the government to provide Medicare-subsidized drug coverage to enrolled beneficiaries. Part D plans are required to offer a defined standard benefit or one that is equal in value (Exhibit 1). They may also offer an enhanced benefit. Medicare drug plans must meet defined requirements, but may vary in terms of premiums, benefit design, gap coverage, formularies, and utilization management rules.
In 2013, more than 35 million Medicare beneficiaries are enrolled in Medicare drug plans, including 22.5 million in PDPs and 12.8 million in MA-PD plans.1 , 2 About 11 million Part D enrollees are receiving extra help through the Part D Low-Income Subsidy (LIS) program to pay their drug plan premiums and cost sharing. Part D has evolved since its inception in 2006 due to changes in the private plan marketplace and the regulations that govern the program. The ACA is bringing significant improvements to the program, primarily phasing out the coverage gap, or “doughnut hole,” in the drug benefit.3 In addition to a 50 percent manufacturer discount on the price of brand-name drugs in the gap, the law further reduces cost sharing for brand-name and generic drugs in the gap, gradually reducing cost sharing to the level that applies before the gap, thus eliminating the coverage gap in 2020. In addition, the Centers for Medicare & Medicaid Services (CMS) has implemented other statutory and regulatory changes that have resulted in some consolidation of Part D plan offerings, along with a degree of greater standardization, starting in 2011.
This report presents findings from an analysis of the Medicare Part D marketplace in 2013 and changes in drug coverage and costs since 2006.4 It presents key findings related to Medicare drug plan premiums, the subsidy for low-income beneficiaries, the coverage gap, benefit design and cost sharing, formularies, and utilization management, based on data from CMS for all plans participating in Part D. More detail about the methods used in this analysis is provided below.
.
Findings
Plan Availability
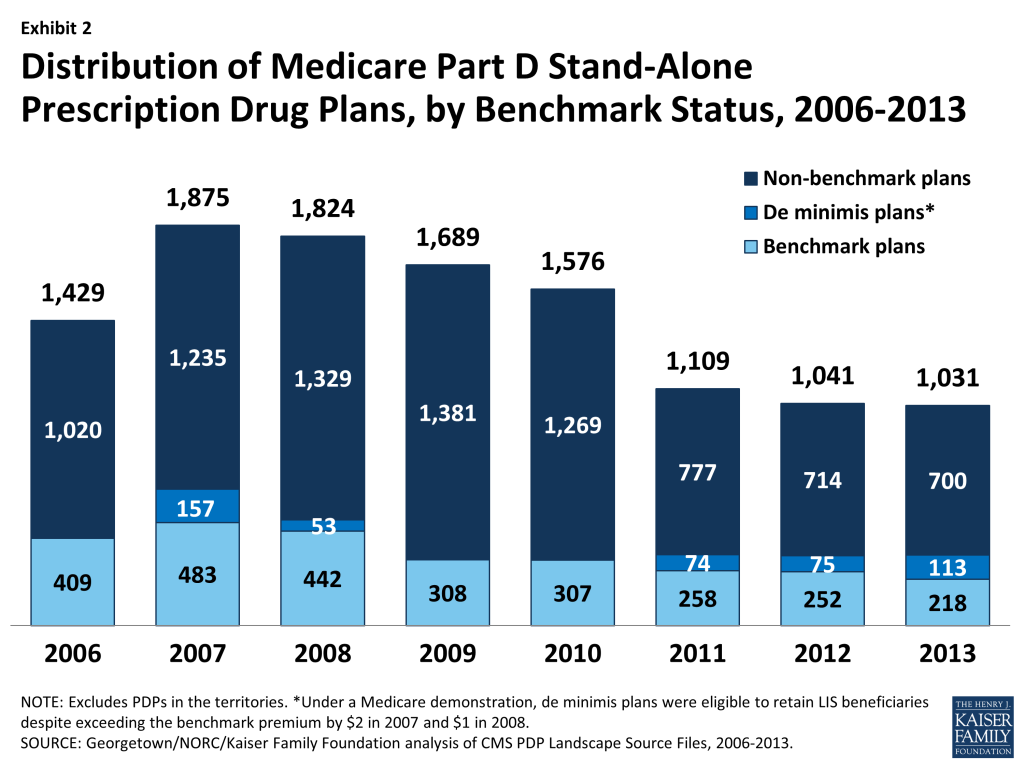
Fewer PDPs are offered in 2013 than in any previous year. There are 1,031 PDPs in 2013, about 1 percent fewer than in 2012 and one-third fewer than in 2010. Even with this decline, at least 25 PDPs are offered in every region this year (excluding plans in the territories). While the number of PDPs rose sharply between 2006 and 2007, the number has decreased each year since then (Exhibit 2). Both marketplace and policy factors have contributed to the decline. The Part D plan market has witnessed several mergers between sponsoring organizations and consolidation of plan offerings by sponsors. Through regulations issued in 2010, CMS started a process to eliminate duplicative plan offerings and plans with low enrollment. For example, most sponsors now offer two plan options (one basic and one enhanced) instead of the three options offered in past years.
The average number of PDPs per region has come down from a high of 56 in 2007 to 31 in 2013 (weighted by regional enrollment). In 2013, virtually all beneficiaries have at least one Medicare Advantage (MA) option as well: 20 on average, the majority of which also offer drug coverage.5 Thus beneficiaries participating in Part D continue to have a wide array of choices.
Current CMS policies suggest that the number of PDPs may continue to decline in future years. Corporate acquisitions completed in 2012 led to further consolidation of the PDPs offered in 2013 in order for sponsors to remain compliant with CMS limits on plan offerings by the same sponsor.6 Some new plan sponsors entered the market in 2013, which kept the total number of offerings roughly the same as in 2012. But PDPs offered by these new sponsors have attracted few enrollees beyond the assignment of some LIS enrollees. The call letter issued by CMS to solicit plan participation for 2014 reiterates the agency’s authority not to renew plans with low enrollment. Currently, 218 PDPs (21 percent of all PDPs in 2013) have fewer than 1,000 enrollees, the level at which CMS urges sponsors to consider withdrawal or consolidation; 65 of these PDPs have fewer than 100 enrollees.7 The low-enrollment PDPs include most of those offered by sponsors entering the program for the first time in 2013.
In 2013, 1,623 Medicare Advantage drug plans are offered. The number of MA-PD plans increased by about 50 percent between 2006 and 2009, from 1,333 plans to 1,991 plans.8 However, the availability of MA-PD plans has fallen since then; the 1,623 MA-PD plans currently offered is about 18 percent fewer than at the peak.
Premiums
Since 2006, the average PDP premium, weighted by enrollment, has increased by 49 percent, and the 2013 average is 2 percent higher than in 2012. Monthly PDP premiums vary widely. The weighted average premium paid by beneficiaries for stand-alone Part D coverage has increased since the start of the program, from $25.93 in 2006 to $38.54 in 2013 (Exhibit 3).9 ,10 After a 1-percent decrease in the average premium between 2011 and 2012, the average PDP enrollee is paying 2 percent more in premiums in 2013.
A key factor driving slow premium growth in recent years is the availability of generic versions of many drugs used for common chronic conditions, which helps to limit growth in total plan costs and hence premiums. In 2010, Lipitor, Zyprexa, Seroquel, Actos, and Plavix – five of the eight drugs with the highest Part D drug costs – represented 13 percent of total Part D drug costs. Generic versions of these drugs entered the market between the fourth quarter of 2011 and the second quarter of 2013, creating the opportunity for substitution of the less costly generic version for the brand-name equivalent. A conservative assumption that the average price of these drugs was reduced by half in 2013, compared to 2010, would suggest a 6 percent reduction in total drug costs from these five drugs alone.11
Enrollment in two of the program’s newer PDPs, offered at below-average premiums, also helped lower the average premium in 2013. In 2013, Coventry’s First Health Part D Value Plus PDP, a new entry in 2012 with an average premium of $29.50 in 2013, had a net increase of 250,000 non-LIS enrollees (likely including many who switched from other First Health PDPs). AARP’s Saver Plus PDP, new in 2013 with a $15.00 premium in 30 regions, attracted 248,000 non-LIS enrollees while also enrolling 307,000 LIS beneficiaries.12
Nationwide, the least expensive PDP has a $15.00 monthly premium, while the most expensive PDP has a $165.40 premium, an 11-fold difference. Although some differences can be explained by the relative generosity of the benefits offered or the relative efficiency across plans, other differences are not so easily explained.
The trend in the Part D premium average, combined across stand-alone PDPs and Medicare Advantage drug plans, has been essentially flat since 2010, hovering around $30.13 This lower average is influenced by lower premiums for the drug benefit offered by MA-PD plans. The average 2013 monthly premium amount attributable to drug benefits in MA-PD plans is $13.30, about $1 higher than in 2012 but virtually identical to the average in 2010.14 The MA-PD average is about $25 below the PDP average, in part because many MA-PD plans reduce or eliminate their premiums by using a portion of rebates from the Medicare Advantage payment system.15 Nearly half of all MA-PD plans charge no premium for their drug benefit. Average monthly premiums for both types of plans have been essentially unchanged since 2010, whereas premiums for MA-PD plans rose considerably more slowly than PDP premium in the program’s earlier years. The overall share of enrollees in MA-PD plans has risen since the start of Part D – from about 23 percent to 34 percent of enrollees not participating through employer group Part D plans.
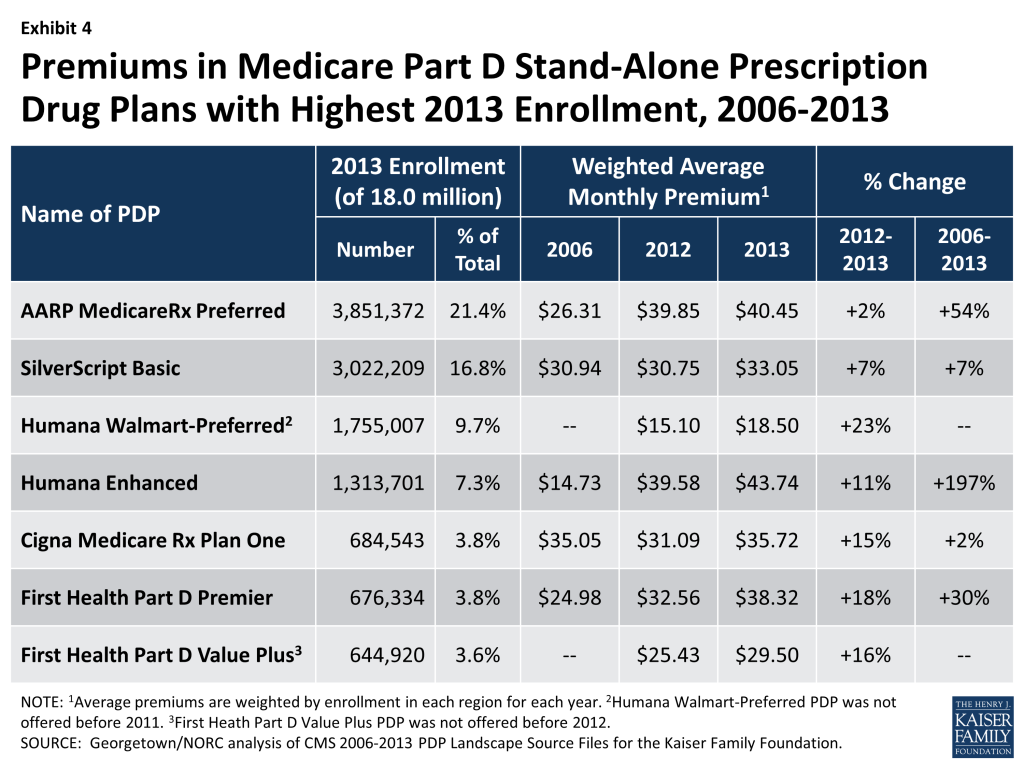
Trends in monthly PDP premiums vary across the different organizations that sponsor PDPs. The modest increase in the average premium across all Part D enrollees hides larger changes at the plan level (Exhibit 4). The seven PDPs with the highest enrollment all charged higher average premiums in 2013 compared to 2012, but the size of the increase varied considerably. The plan with the highest enrollment, UnitedHealth’s AARP MedicareRx Preferred, had the smallest increase of the large plans, 2 percent above its 2012 monthly premium (from $39.85 to $40.45). By contrast, Humana’s Walmart Preferred PDP raised its premium by 23 percent over 2012 after just a 2 percent increase in 2012 (from $15.10 to $18.50). Since 2006, premium increases for some PDPs have been larger than the increase in the national average, in percentage terms. For example, the average monthly premium for Humana’s Enhanced PDP in 2013 is about three times its 2006 average ($43.74 versus $14.73).
Part D premiums vary by geography. Average premiums are considerably higher in certain regions than in others in 2013. These geographic differences generally have persisted from year to year. Beneficiaries enrolled in a basic PDP in New Mexico in 2013 pay an average of $20.67 per month, while those in the New York PDP region pay $41.50 (Exhibit 5), double that in New Mexico.16 Regional differences in premiums have continued over time and grew wider in 2013. The low-premium region experienced a 13 percent drop, while premiums in the highest regions are up.
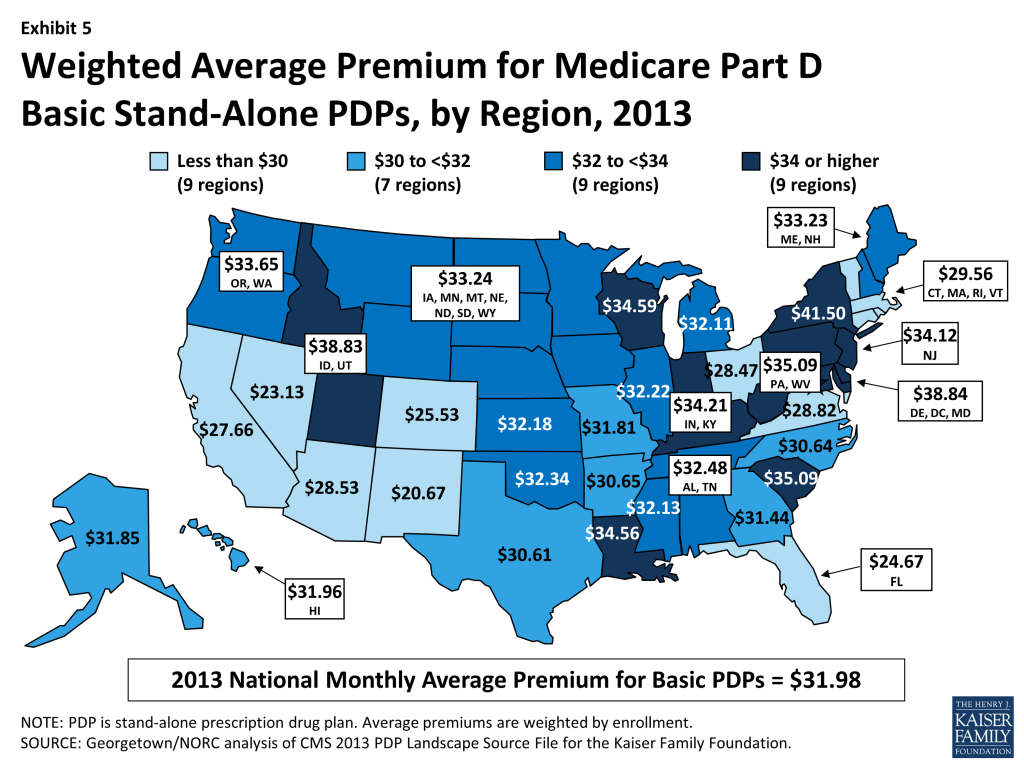
New Mexico and Arizona were among the regions with the lowest average premiums for the last four years. Likewise, Wisconsin, Delaware/DC/Maryland, and Idaho/Utah have been among the most expensive regions for four years. Some regions, however, have seen significant changes in their premiums relative to other regions. New York had an average premium below the national median in 2010, but is now the most expensive region. Conversely, Missouri was one of the five most expensive regions in 2010 but now falls below the national average. Reasons for these changes are not readily apparent, but may be attributable to both shifts in the mix of plan enrollment in these regions and regional differences in the premiums charged by specific plans.
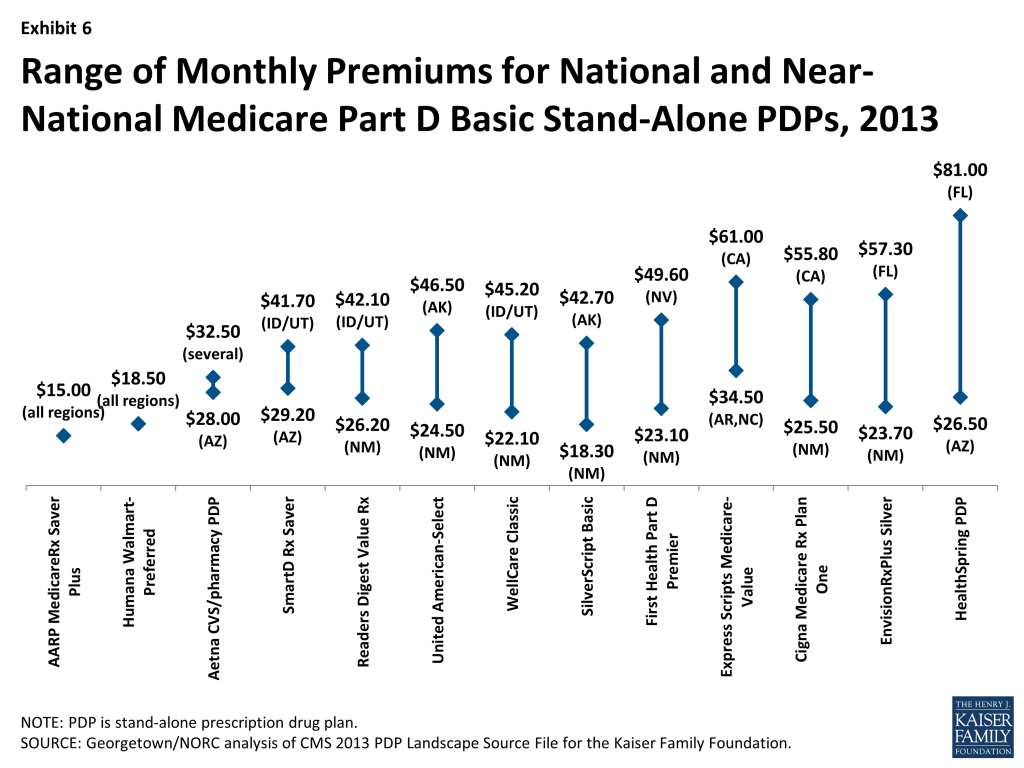
Some plan sponsors charge as much as two or three times more for the identical basic PDP from one region to another. Thirteen plan sponsors offer a basic PDP in at least 27 of the 34 PDP regions. For six of these national or near-national PDPs, premiums for the identical plan design are more than two times greater in one region than in another (Exhibit 6). The largest absolute difference is for the HealthSpring PDP, which charges beneficiaries $26.50 in Arizona and $81.00 in Florida for the same coverage. By contrast, two PDPs have a uniform premium across all regions, and the Aetna/CVS PDP has a difference of only $4.50 between its lowest and highest regions.
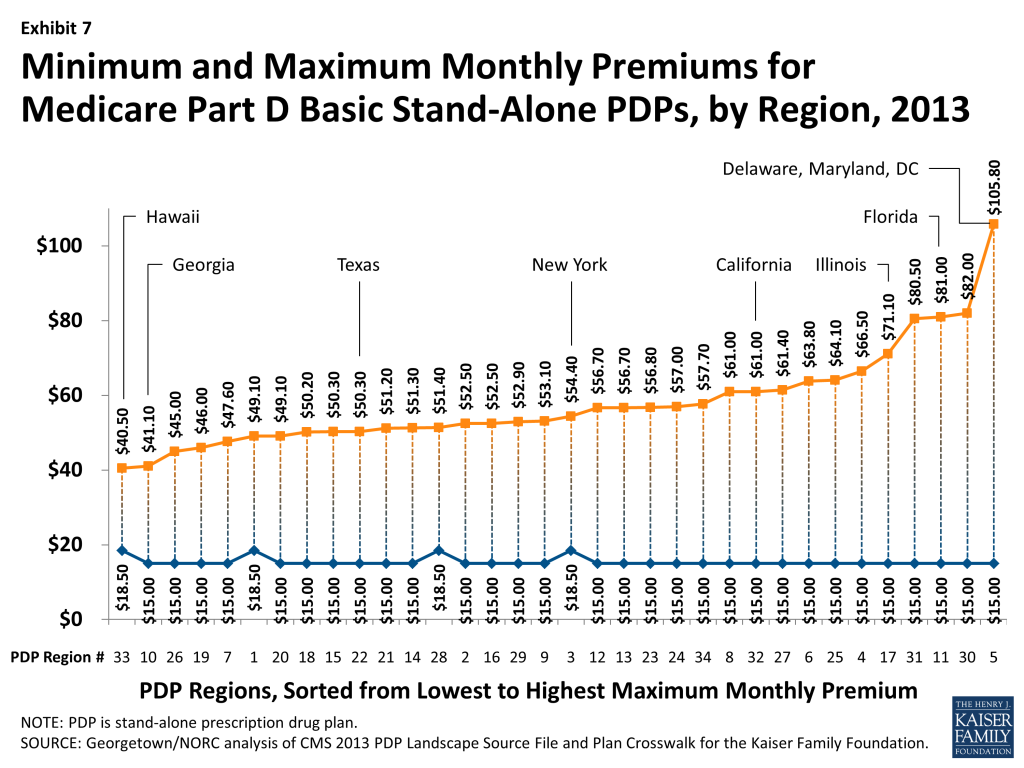
Within each region, some plan sponsors charge more than twice as much as other sponsors for their basic PDPs (Exhibit 7). In Hawaii, the highest premium for a basic PDP is $40.50 for the MedicareRx Rewards Standard PDP, which is a little more than double the $18.50 premium for the Humana Walmart-Preferred PDP. By contrast, the highest premium for a basic PDP in Delaware/Maryland/Washington, DC is $105.80 for the BlueRx Standard plan, seven times the lowest premium in its region ($15.00 for AARP MedicareRx Saver Plus PDP). By law, all basic PDPs provide a benefit with the same actuarial value. There is little reason to suspect that premium differences in the same region are attributable to variations in prescribing patterns from local physicians. Therefore, the observed premium variations most likely result from different utilization patterns by plan enrollees, leading to differences in total plan costs.
Beneficiaries selecting PDPs with an enhanced benefit package pay higher premiums on average for their Part D coverage, even for the part attributable to the basic benefit package. The weighted average monthly premium for PDPs with enhanced benefits is $48.70, compared to $31.98 for PDPs offering the basic benefit package (Exhibit 8). Thus, enrollees pay about 50 percent more to get enhanced benefits. Enhanced plans typically lower or eliminate plan deductibles and may have lower cost sharing for enrollees’ prescriptions. Some enhanced plans also expand the coverage of drugs during the coverage gap beyond the amount included in the basic benefit. But analysis of enhanced PDPs in earlier years sometimes revealed only small benefit differences compared to the same sponsor’s basic PDPs.17
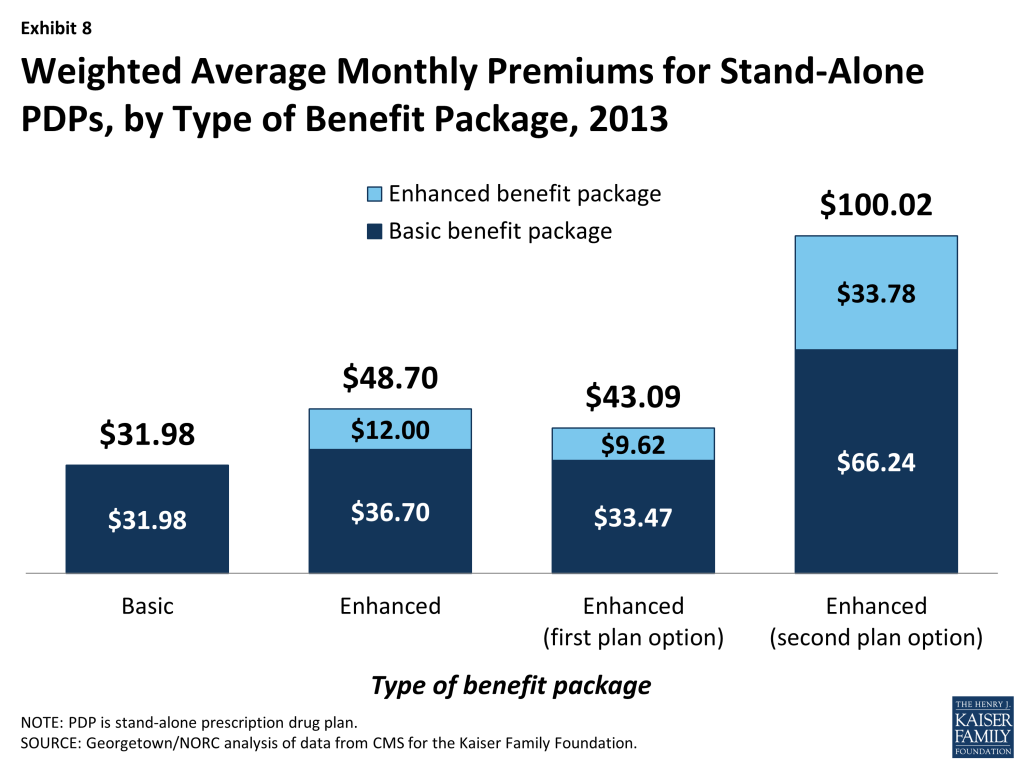
Starting with PDPs offered in 2011, CMS has required sponsors to ensure that benefits in enhanced PDPs are meaningfully different than the basic benefits. In 2013, an enhanced PDP must now have cost-sharing differences that result in $23 lower monthly out-of-pocket costs than the corresponding basic PDP. As a result the spread between premiums for enhanced PDPs and basic PDPs has been higher than in earlier years. Also, as part of the policy for meaningful differences, CMS now allows sponsors to offer a second enhanced PDP only if expected out-of-pockets costs for cost sharing are even lower (by $12 per month) than for the first enhanced PDP and the second enhanced PDP has coverage for at least some brand drugs in the coverage gap. As a result of these stricter requirements, average monthly premiums for enhanced PDPs offered as a second option are considerably higher: $100.02 versus $43.09 for enhanced PDPs not meeting this stricter standard (Exhibit 8).
Higher premiums for enhanced PDPs partly reflect the cost of offering the enhanced benefits. But in addition, the portion of the premium that corresponds to the basic benefit is often considerably different than the premium for the same sponsor’s basic PDP. This may reflect enrollment of beneficiaries with higher drug needs (beyond differences captured by risk adjustment) in the enhanced plans.
As with PDPs, average premiums vary considerably by MA-PD plan sponsor. Plans offered by United Healthcare, with 22 percent of the MA-PD market, have a weighted average premium of $1.72 for the drug benefit (in addition to a premium of $4.37 for the medical benefits under Part C). By contrast, Humana, the second largest company in this market segment (19 percent of MA-PD enrollees) has an average premium of $13.29 (plus $22.63 for Part C). The next two largest MA-PD sponsors are Kaiser Permanente, with a 6 percent market share and a $3.76 average premium (plus $39.96 for Part C), and Anthem Wellpoint, with a 5 percent market share and a $26.27 average premium (plus $4.74 for Part C).
The Coverage Gap
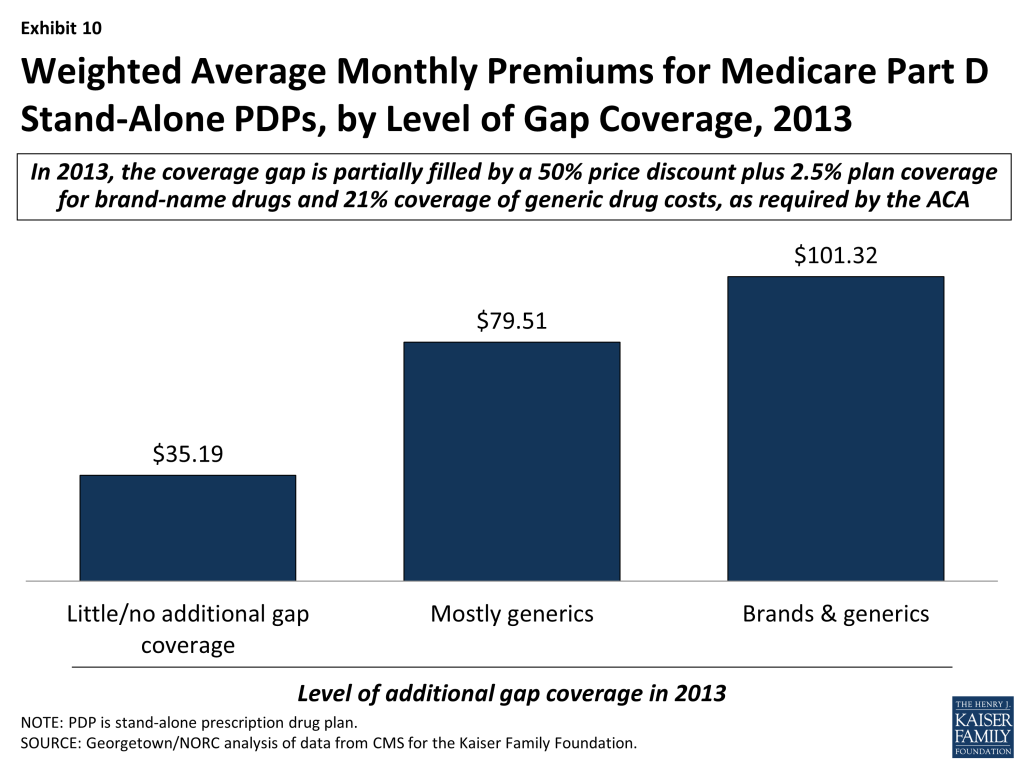
In 2013, most PDPs (69 percent) offer little or no gap coverage beyond what is required by law; PDPs offering extra gap coverage cost more and have attracted fewer enrollees.18 In 2013, beneficiaries reaching the gap pay 47.5 percent of the full price for brand-name drugs in the gap (after a manufacturer price discount of 50 percent and plans paying 2.5 percent), and 79 percent of the cost for generics (plans pay the remaining 21 percent). Under current law, beneficiaries will face average cost sharing of only 25 percent for all drugs in the gap by 2020 – the same as in the initial coverage period – effectively eliminating the coverage gap.
In 2013, 94 percent of all PDP enrollees are in plans without additional gap coverage beyond what is required by law (Exhibit 9). Overall, only 48 percent of PDP enrollees are potentially exposed to the gap in coverage if their spending exceeds the initial coverage limit, because LIS enrollees do not pay the full drug costs when they reach the gap. In 2013, the vast majority of non-LIS Part D enrollees (88 percent) are enrolled in PDPs with no gap coverage beyond what is required by the ACA.

A similar share of MA-PD plans (27 percent) than PDPs (31 percent) offer additional gap coverage in 2013 for more than a “few” drugs, but a much larger share of MA-PD plan enrollees than PDP enrollees are in such plans.19 About one-third (35 percent) of MA-PD plan enrollees have at least some additional gap coverage beyond what the ACA requires, a substantial increase since 2006 in the share with gap coverage (Exhibit 9), but lower than the level of gap coverage in 2012 (38 percent) or 2011 (43 percent).20 The higher level of additional gap coverage among enrollees in MA-PD plans occurs largely because Medicare Advantage plans are able to use payments received from the government for providing benefits covered under Parts A and B to reduce cost sharing and premiums under Part D.21 Furthermore, because Medicare Advantage plans cover hospital and physician services and other Medicare benefits, they have stronger incentives than PDPs to offer at least some gap coverage to forestall the negative health and cost consequences that could arise if enrollees do not take their medications when they reach the gap.
The vast majority of Part D enrollees with gap coverage (beyond that required by law) are in plans that cover only some generic drugs in the gap. In 2013, only about 3 percent of PDP enrollees and less than 1 percent of MA-PD plan enrollees have any significant gap coverage for brand-name drugs beyond the 50 percent discount and 2.5 percent payment that all plans must provide. Furthermore, gap coverage that includes all generic drugs (as opposed to a subset of generic drugs) has declined substantially over time. In 2013, only 2 percent of MA-PD plan enrollees and less than 1 percent of PDP enrollees are in plans that cover all generics in the gap.
Enrollees in stand-alone Part D plans tend to pay substantially higher premiums for plans with gap coverage (beyond that which is required by law) compared to those without such coverage. On average, the weighted monthly premium for a stand-alone PDP offering additional gap coverage for generic drugs is $79.51, about $44 per month above that for plans offering no gap coverage (Exhibit 10).22 Plans with gap coverage for at least some brands are the most expensive, with average premiums of $101.32, which is about $22 per month higher than for plans covering only generics in the gap.
Benefit Design and Cost Sharing
Most Part D plans do not offer the defined standard benefit (with a $325 deductible and 25 percent coinsurance); the vast majority have a tiered cost-sharing structure with incentives for enrollees to use less expensive generic and “preferred” brand-name drugs. The number of plans that offer the defined standard benefit is small; in 2013, only 3 percent of PDPs and 2 percent of MA-PD plans offer the standard benefit that has no formulary tiers (with 3 percent and 1 percent of enrollment, respectively).
In 2013, about two-thirds of all plans (67 percent of both PDPs and MA-PD plans) use five cost-sharing tiers: preferred and non-preferred tiers for generic drugs, preferred and non-preferred tiers for brand drugs, and a tier for specialty drugs. About 62 percent of PDP enrollees and 74 percent of MA-PD enrollees are in these plans. Most of the other Part D enrollees are in plans with four tiers: 1 generic tier, 2 brand tiers, and a specialty tier.23 Prior to 2012, four-tier arrangements were most common; their use started to decline in 2012.
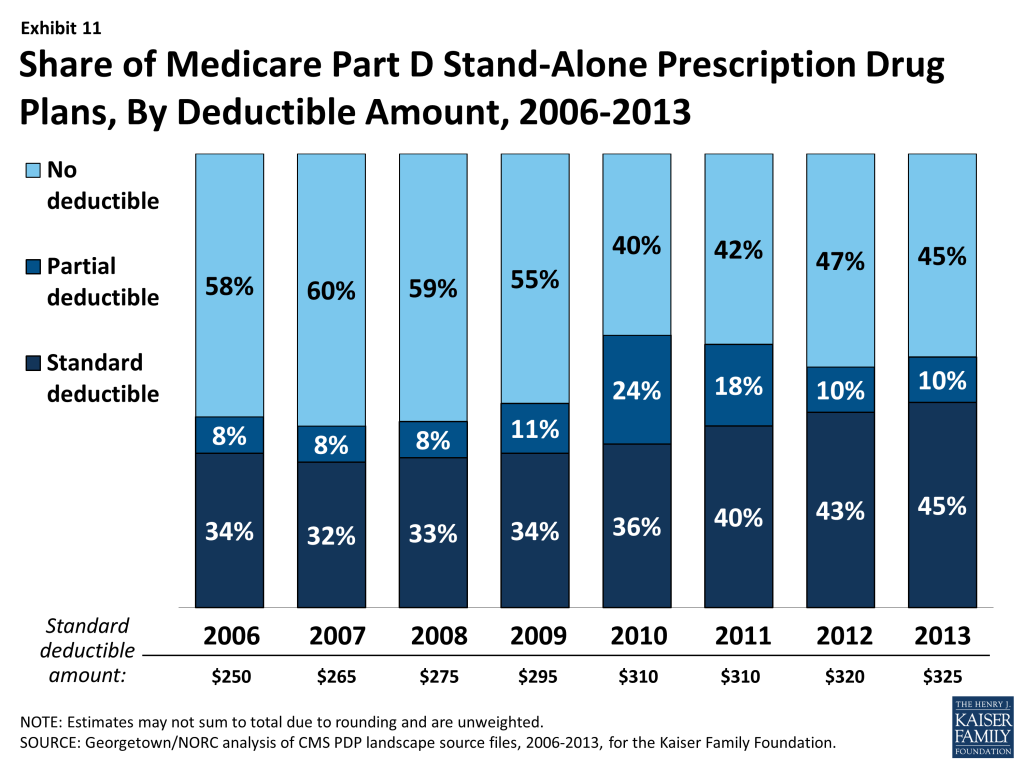
Use of a deductible by stand-alone PDPs is considerably higher in 2013 than in the first few years of the program, but down somewhat since 2010 (Exhibit 11). About 55 percent of PDPs charge a deductible this year, compared to between 40 percent and 45 percent from 2006 and 2009 and 60 percent in 2010. Most PDPs with a deductible use the standard deductible allowed by law ($325 in 2013). A far smaller number of MA-PD plans (13 percent) use a deductible in 2013.
Although copayments in the form of a flat dollar payment amount remain the most common type of cost sharing, the share of PDPs using percentage-based coinsurance for non-specialty brand-name drug tiers has increased since 2006. In 2013, 45 percent of PDPs with a tier for non-preferred brand drugs charge a coinsurance rate for drugs on that tier. Of these plans, nearly all have a mixed pricing design. Typically they use a flat copayment for their generic drug tiers, and many also use a flat copayment for preferred brand drugs. The use of percentage coinsurance for drugs remains uncommon among MA-PD plans.
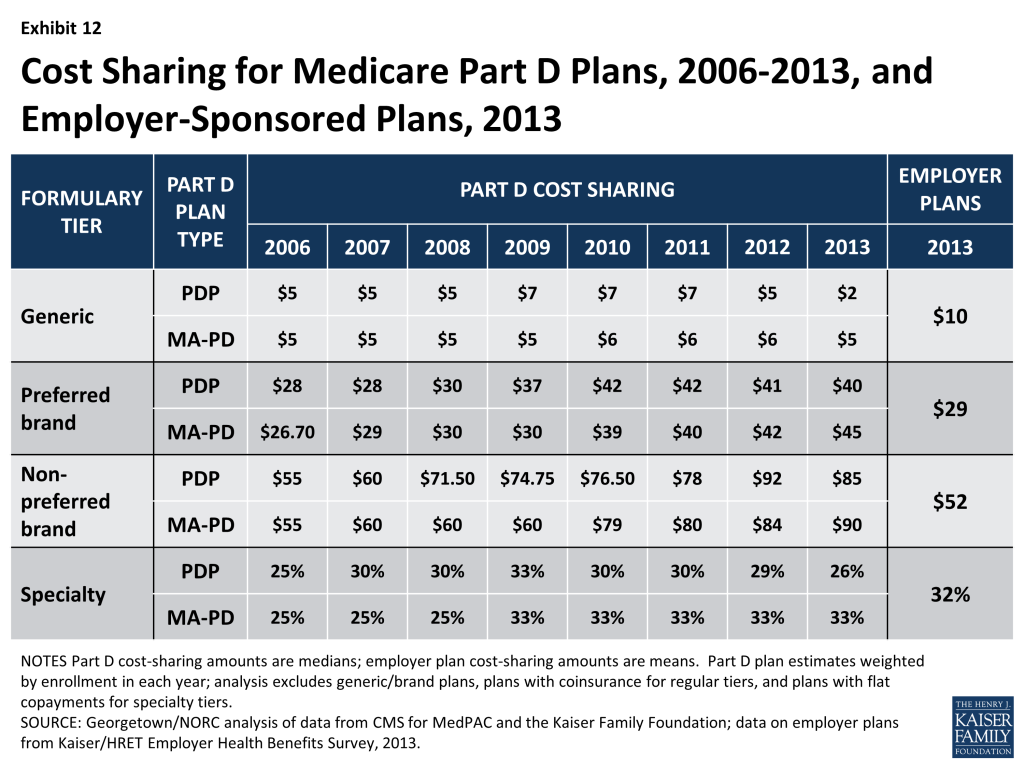
Since 2006, the median cost sharing for a 30-day supply of “non-preferred” brand-name drugs in stand-alone PDPs has increased by 55 percent, from $55 to $85, while cost sharing for “preferred” brand drugs increased by 43 percent, from $28 to $40. From 2011 to 2013, the spread between tiers widened modestly. In 2013, MA-PD plans generally have somewhat higher cost-sharing levels than PDPs. Median cost sharing for generic drugs in PDPs is $2 in 2013, lower than any year since the program began (Exhibit 12). It seems likely that PDPs are trying to capitalize on the increasing availability of generic alternatives. For PDPs with two generic tiers (about two-thirds of all PDPs and PDP enrollment), the median cost sharing was $2 for the preferred generic tier and $5 for the non-preferred tier (both lower than in 2012). By contrast, MA-PD plans with two generic tiers charge $3 and $10. Some PDPs set cost sharing for their non-preferred generic tier as high as $33.
Cost-sharing amounts for commonly used brand-name drugs without generic equivalents vary widely across Part D plans in 2013, as they have in previous years. For preferred brand tiers, PDPs set copayment levels as low as $22 and as high as $45; for non-preferred tiers, the copayments range from $45 to $95. These ranges are less than in some previous years because of CMS guidance that sets maximum allowable copayment levels. Median cost-sharing levels have increased over time.
Meanwhile, for plans that use percentage coinsurance instead of dollar copayments, cost sharing may be higher or lower based on the actual retail price of the drug. The median coinsurance percentage for PDPs in 2013 for the preferred brand tier is 23 percent. For drugs on the non-preferred brand tier, the median coinsurance rate is 43 percent, a substantial share of the drug’s cost. In fact, about 60 PDPs require beneficiaries to pay half the cost of drugs on the non-preferred brand tier (though less than the 75 percent coinsurance applied in some previous years).
Medicare Part D plans generally charge more than private-sector employer plans do for preferred and non-preferred brand drugs, but much less for generics. At the median, PDPs charge $40 per month for a preferred brand in 2013, well above the average $29 charged by employer plans (Exhibit 12).24 Cost-sharing differences are even greater for non-preferred brands ($85 for PDPs vs. $52 for employer plans). By contrast, employers charge much higher copays for generic drugs ($10), compared to $2 for PDPs. Thus the spreads between cost sharing for brands and generics and between preferred and non-preferred brand drugs are greater in Medicare Part D plans – increasing the incentives for plan enrollees to choose generics or preferred brand drugs.
Specialty Tiers
Most Part D plans use a specialty tier for high-cost medications in 2013, and many Part D enrollees are in plans with a 33 percent coinsurance rate for specialty tier drugs. In 2013, among Part D enrollees in plans using tiered cost sharing, 92 percent of PDP enrollees and 99 percent of MA-PD plan enrollees are in plans with a specialty tier. Specialty tiers are commonly used by Medicare drug plans for relatively expensive drugs (at least $600 per month in 2013). Plans typically have higher cost sharing for specialty-tier drugs than they do for preferred or non-preferred drugs, with coinsurance rates ranging from 25 percent to 33 percent. Many of the plans without specialty tiers charge coinsurance for all covered brand-name drugs, including drugs that tend to be placed by other plans on specialty tiers. Thus, cost sharing in these plans may actually be higher than that in plans with specialty tiers.
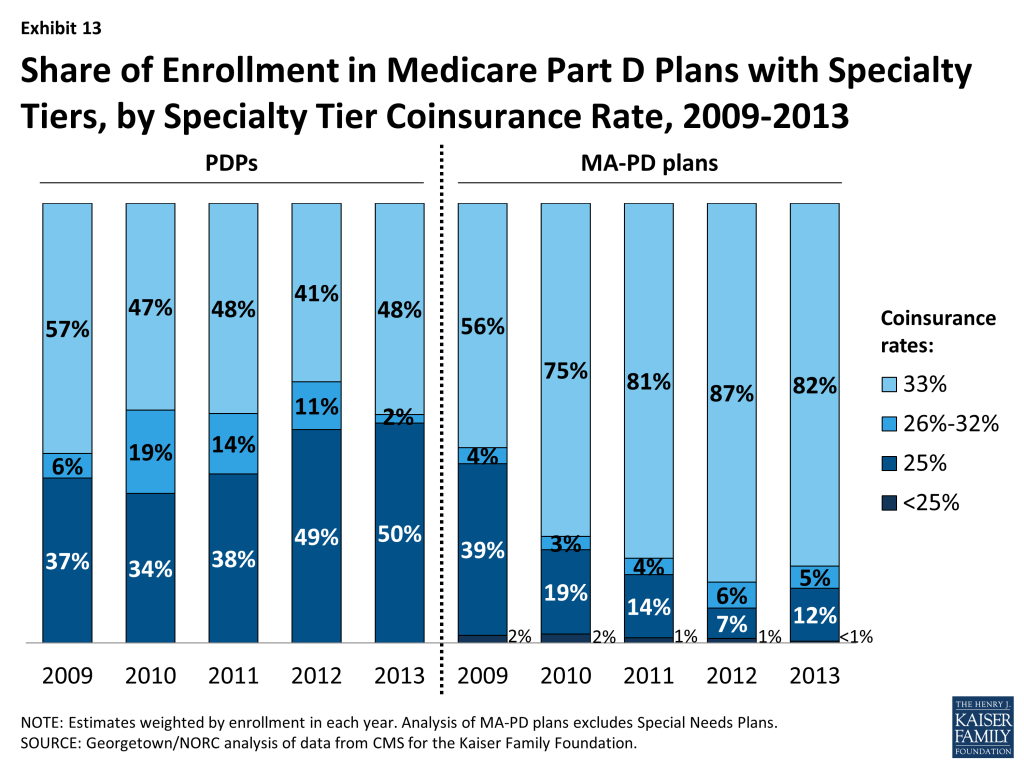
While CMS limits the coinsurance rate for drugs placed on a specialty tier to 25 percent, plans are allowed to impose higher cost sharing (up to 33 percent) for specialty tier drugs if offset by a lower deductible.25 In 2013, about 48 percent of PDP enrollees and 82 percent of MA-PD plan enrollees are in plans charging 33 percent coinsurance for specialty drugs in the initial coverage period (Exhibit 13). Compared to 2009, this share is down modestly for PDPs, but up substantially for MA-PD plans. By contrast, only four of the 35 national or near-national PDPs charged a 33 percent coinsurance rate for specialty tier drugs in 2006.
The one national PDP (Humana Walmart-Preferred) without a specialty tier in 2012 added one in 2013, effectively lowering the cost sharing for drugs placed on this new specialty tier instead of a non-preferred brand tier from 35 percent to 25 percent, provided the drugs are purchased at the plan’s preferred pharmacies. However, three other national (or near-national) PDPs still place most specialty drugs on a non-preferred brand tier with coinsurance as high as 50 percent on that tier, much higher than the maximum coinsurance permitted for a specialty tier.
Placing a drug on the specialty tier or on a non-preferred brand tier with high coinsurance can have serious cost implications for plan enrollees. A specialty drug priced at the $600 threshold will cost the beneficiary between $150 and $200 per month during the initial coverage period prior to the coverage gap. But monthly cost sharing for other common specialty drugs, such as Copaxone (for multiple sclerosis), Enbrel (for rheumatoid arthritis), Gleevec (for certain cancers), and Truvada (for HIV) can range from $300 to $2,000, before a beneficiary reaches the coverage gap or qualifies for catastrophic coverage.
Formularies and Utilization Management
The scope of formulary coverage continues to vary widely across PDPs in 2013. Part D plan formularies typically include more drugs than CMS standards require, but formulary coverage varies considerably across plans.26 Some plans list all drugs from the CMS drug reference file on their formularies, while other plans list as few as 62 percent of these drugs.27 The five largest PDPs range in formulary coverage from 77 percent to 92 percent of drugs in the reference file. In 2013, the average PDP enrollee is in a plan where the formulary lists 83 percent of the drugs in the CMS drug reference file, slightly below the average in recent years. The average enrollee in MA-PD plans is in a plan with slightly more drugs (89 percent) on formulary than PDPs. Beneficiaries retain the option of requesting an exception to have the plan cover an off-formulary drug or can purchase the drug by paying out of pocket.
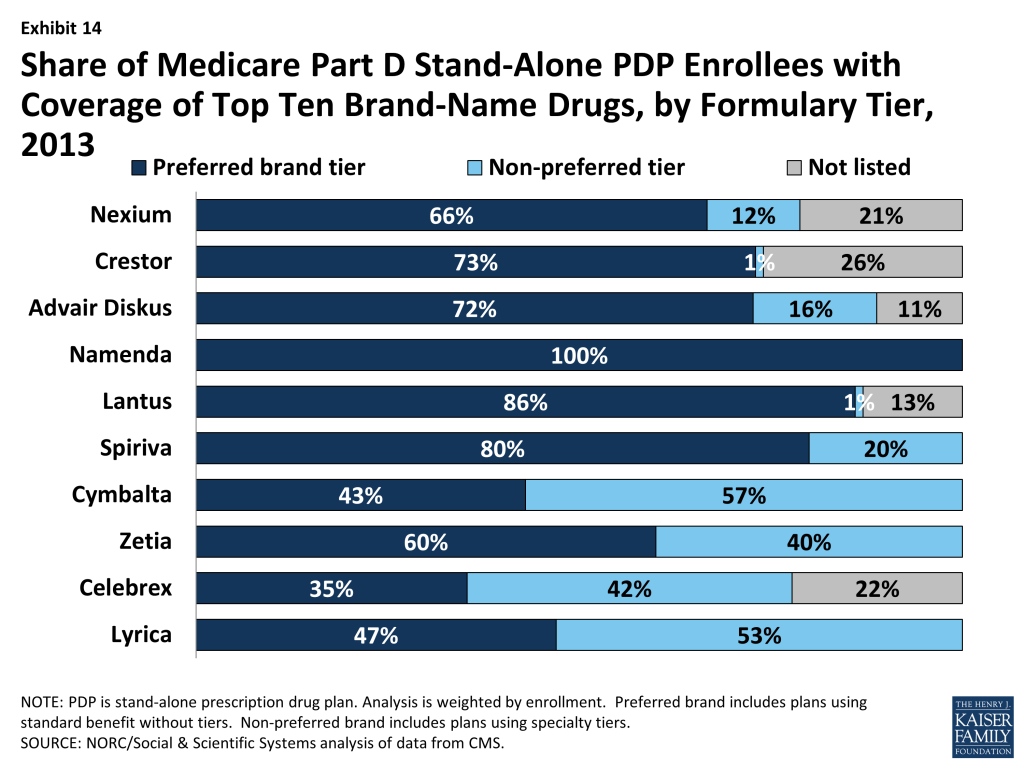
Examining coverage of the top ten brand-name drugs commonly used by Medicare beneficiaries illustrates the variation in formulary coverage (Exhibit 14).28 In 2013, five of the top ten brand drugs are off formulary for at least 5 percent of all PDP enrollees. Seven of the top ten brands are on a preferred cost-sharing tier for a majority of PDP enrollees (compared to all ten in 2013). The three drugs from this list least likely to be available on a preferred tier are Celebrex, Cymbalta, and Lyrica, all of which are prescribed for pain relief (Cymbalta also is used to treat depression). Celebrex is off formulary for nearly one-fourth of PDP enrollees, who will pay the full price (about $325 per month, depending on dosage) to obtain the drug. Cymbalta and Lyrica are on a non-preferred tier for over half of PDP enrollees.
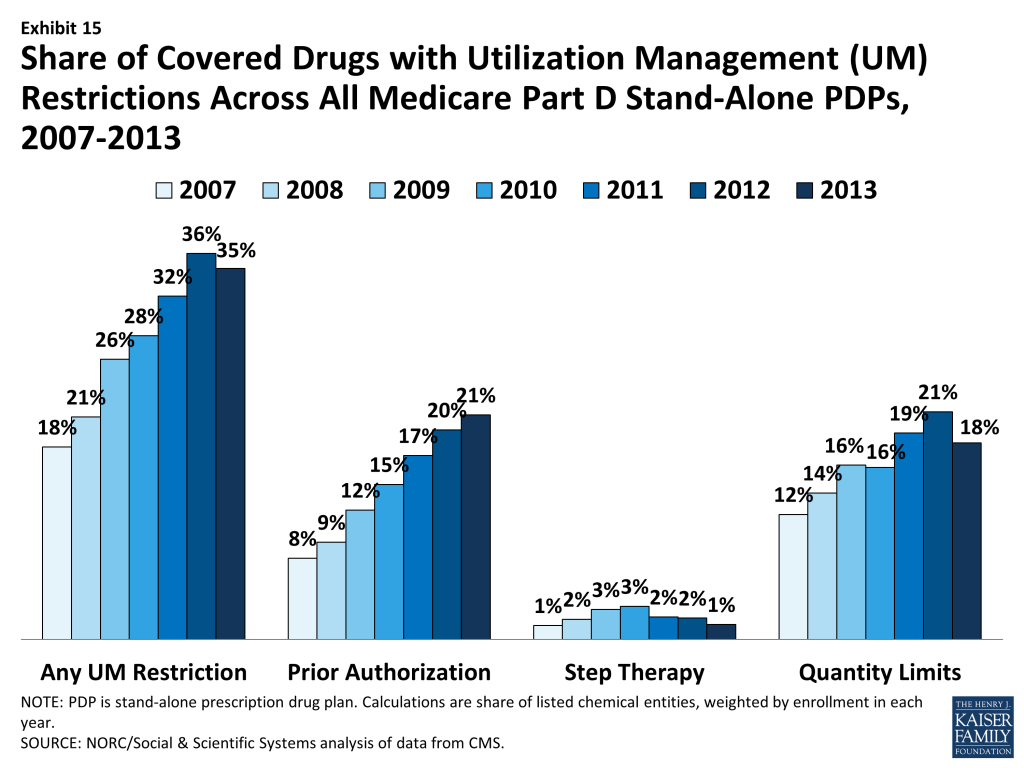
Since 2007, PDPs have applied utilization management (UM) restrictions to an increasing share of on-formulary brand-name drugs. Even if a drug is listed on a plan’s formulary, utilization management rules, including step therapy, prior authorization and quality limits, may restrict a beneficiary’s access to the drug.29 The presence of such rules has increased since 2007, with 35 percent of drugs subject to some utilization management in 2013, up from 18 percent in 2007 although down marginally compared to 2012 (Exhibit 15). Quantity limits (e.g., limiting a prescription to 30 pills for 30 days) are applied to 18 percent of drugs in 2013, prior authorization is applied to 21 percent of drugs, and step therapy to 1 percent of drugs, on average across all PDPs (weighted for enrollment). MA-PD plans tend to apply UM restrictions to a somewhat smaller share of drugs; in particular they are less likely to apply quantity limits.
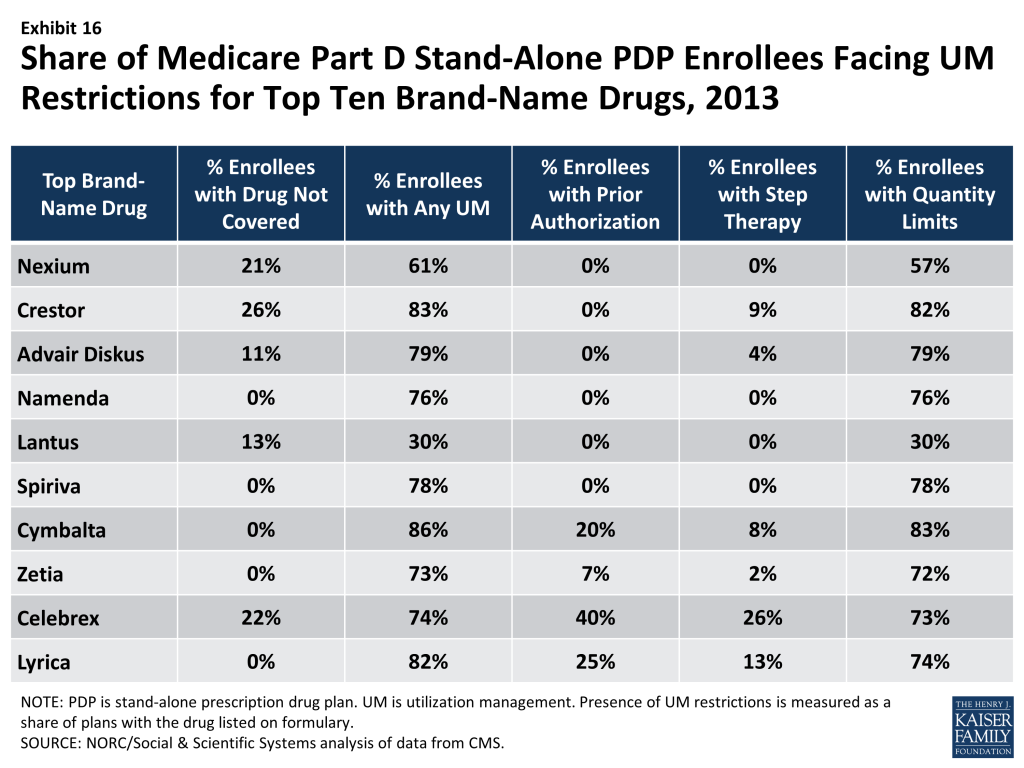
The top ten brand-name drugs illustrate the variations in utilization management (Exhibit 16). At least 70 percent of PDP enrollees face UM restrictions for eight of the top ten brand-name drugs. Most restrictions are quantity limits that create limited concerns for most enrollees. Three of the top drugs (Celebrex, Cymbalta, and Lyrica) have prior authorization required for at least 20 percent of PDP enrollees for whom the drug is on formulary. Two of these three drugs (Celebrex and Lyrica) have step therapy requirements for at least 20 percent of PDP enrollees. These are the same drugs that are most likely to be off formulary or on a non-preferred tier, meaning that PDPs are using a variety of tools to manage their use.
Low-Income Subsidy Plan Availability and Enrollment Dynamics
The number of “benchmark” plans – those available to beneficiaries receiving Part D Low-Income Subsidies for no monthly premium – has been essentially unchanged between 2011 and 2013, even as the total number of PDPs has declined modestly. The total number of benchmark plans for Part D Low-Income Subsidy (LIS) enrollees nationwide is 331 in 2013, just 4 plans above the number in 2012 (Exhibit 2). Several policies in place since 2011, including the “de minimis” policy that allows plans to waive a premium amount of up to $2 in order to retain their LIS enrollees, has kept the number of benchmark plans from dropping. The number of LIS benchmark plans varies by region, ranging from 2 in Florida and Nevada and 3 in Florida to 15 in Arkansas.
The benchmark plan market remains volatile, however. The benchmark plan market has changed considerably over the program’s eight years, which has generated significant instability for low-income enrollees. Of the 409 benchmark plans offered in 2006, only 15 plans have qualified as benchmark plans in every year since then. For a number of other plans, mergers interrupted continuous benchmark status, but the acquiring plan sponsor had a benchmark plan into which enrollees were transferred.30 Of the 327 benchmark plans available to LIS recipients for zero premium at the start of 2012, 38 lost benchmark status for 2013, fewer than between 2011 and 2012.31
As of the open enrollment period for the 2013 plan year (October 15 to December 7, 2012), about 2.7 million people – one of every four LIS beneficiaries – were enrolled in benchmark PDPs in 2012 that failed to qualify as benchmark plans in 2013. To address this issue, CMS reassigned about 900,000 beneficiaries (including some in MA-PDs that exited the market) to new PDPs for the 2013 benefit year. But another 1.8 million beneficiaries were not eligible for automatic reassignment by CMS because at some point they had switched plans on their own.
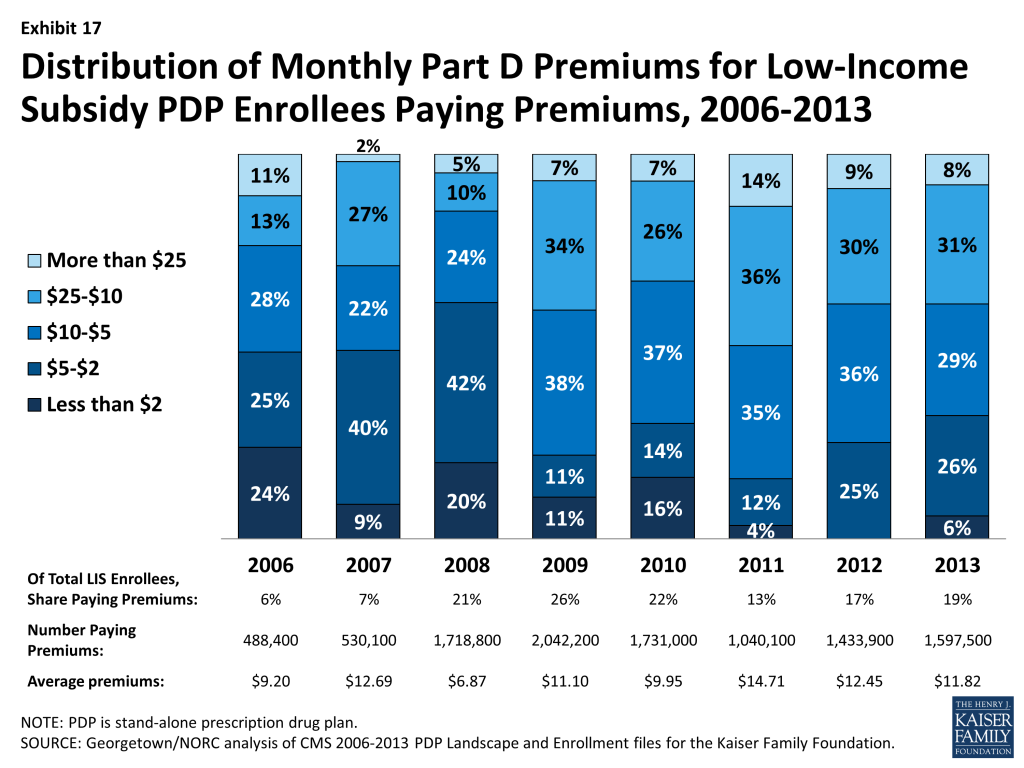
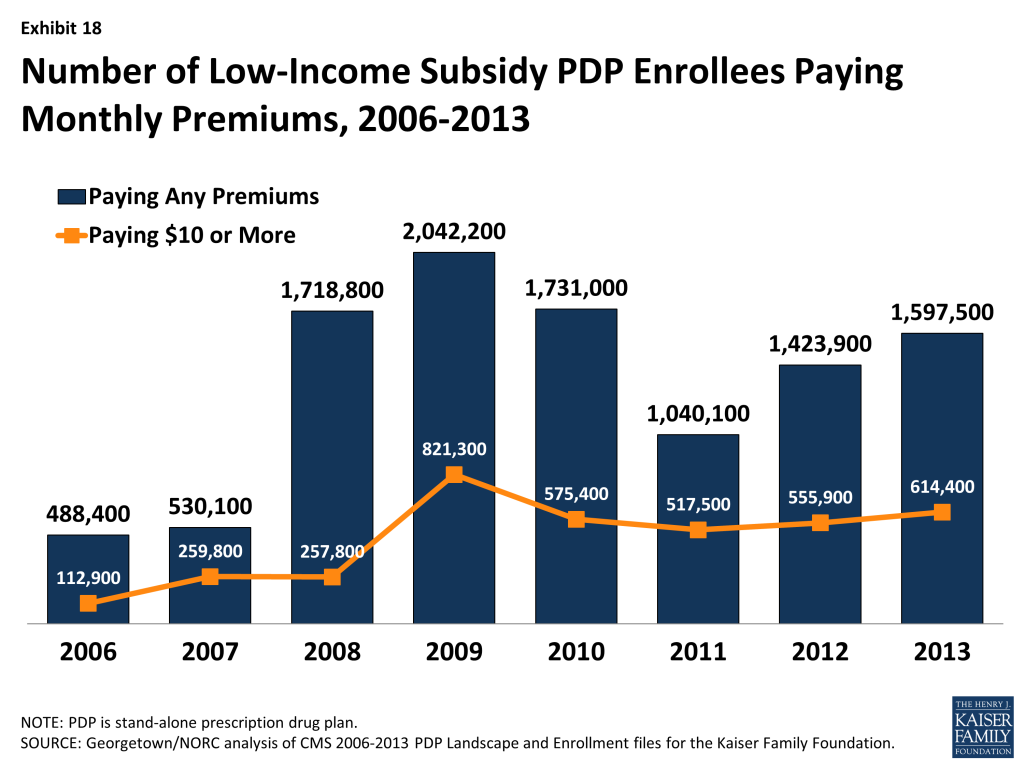
About 1.6 million LIS beneficiaries (19 percent of all LIS enrollees in PDPs) remain in non-benchmark PDPs in 2013 and are paying premiums for Part D coverage this year, a number that is lower than the peak in 2009, but which has grown since 2011. Another 204,000 LIS beneficiaries enrolled in MA-PD plans also pay a Part D premium for their plans. The proportion of LIS beneficiaries in PDPs paying premiums rose from 6 percent in 2006 to 26 percent in 2009, declined to 13 percent in 2011, but was back up to 19 percent in 2013 (Exhibit 17). Without the de minimis premium waiver, about 2.2 million LIS beneficiaries in these PDPs (about one-fourth of LIS enrollment) would either pay a small premium or would have been reassigned to different PDPs to avoid a premium.
Nearly half of the LIS beneficiaries paying premiums in 2013 are enrolled in PDPs offered by UnitedHealth, mostly in the MedicareRx Preferred PDP, which lost benchmark status in all regions over the past two years. Depending on the region, these 737,000 enrollees are paying from $1.60 to $19.90 per month. This offers further evidence that beneficiaries may not be reevaluating their plan options each year, even when it could save them money.
About 614,000 LIS beneficiaries are paying monthly premiums of $10 or more in 2013, representing nearly 40 percent of the 1.6 million LIS beneficiaries who pay any premium (Exhibit 18). It is possible that the LIS enrollees who pay a premium to enroll in these plans do so because of formulary or other individual considerations; another possibility, however, is that these enrollees do not know that there are zero-premium plans available to them or have been unable to navigate the process of switching plans to avoid paying a premium.
Part D Performance Ratings
More than two thirds (68 percent) of all PDP enrollees are in plans with average ratings (3 and 3.5 of 5 stars), and another 8 percent are in plans with higher ratings, but nearly one-fourth (24 percent) of PDP enrollees are in plans with below-average ratings. CMS has reported performance ratings for Part D plans since the fall of 2006 and has used a five-star scale since the fall of 2008. In 2013, the Part D ratings are based on 18 measures in 4 categories. CMS has moved toward more use of outcome and patient experience measures, rather than process measures (such as call center performance). This year’s ratings include five measures of patient safety or medication adherence. In contrast to the ratings for Medicare Advantage plans, however, CMS does not use quality ratings for Part D plans to determine bonus payments to these plans or to make plan assignments for LIS beneficiaries.
Overall ratings in 2013 are up somewhat from 2012, but remain lower than in 2011. About 39 percent of PDPs have ratings of 3.5 stars or higher in 2013, compared to 18 percent of PDPs in 2012 and 56 percent of PDPs in 2011. It is unclear the degree to which differences reflect changing performance by the PDPs or modifications of the rating measures used by CMS. Ratings in 2013 for MA-PD plans are considerably higher than for PDPs. About 70 percent of MA-PD plans have drug plan ratings of 3.5 stars or higher in 2013, compared to 39 percent of PDPs. About 17 percent of MA-PD plans received 4.5 or 5.0 stars, compared to just 1 percent of PDPs.
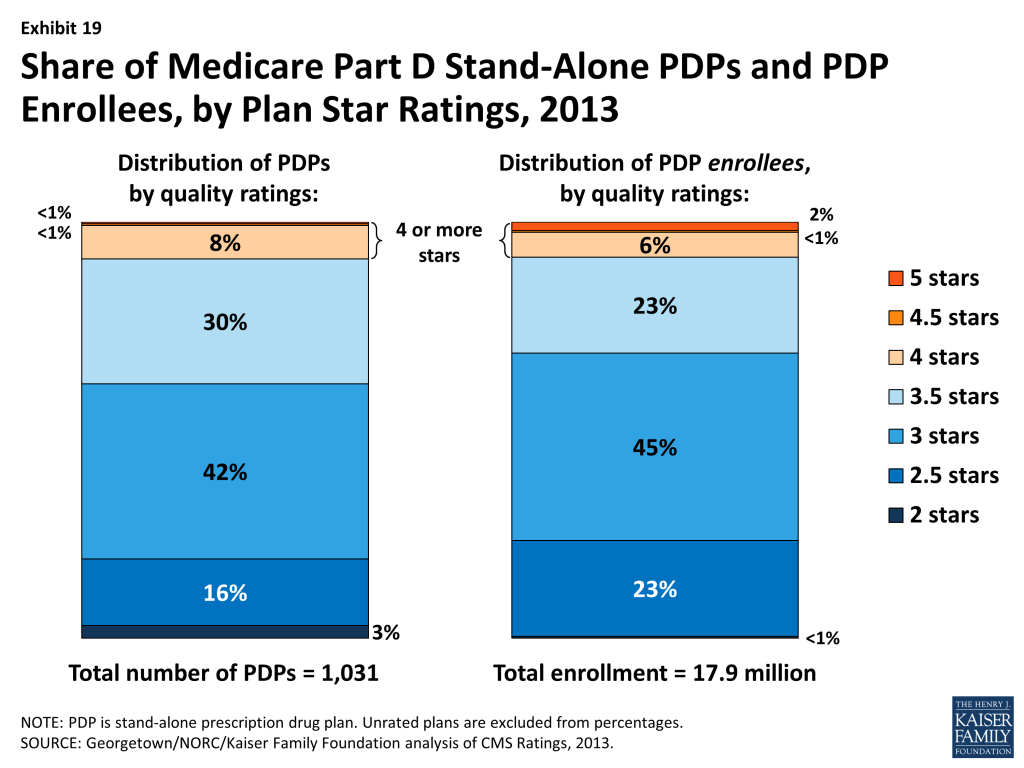
Based on the pattern of enrollment by plan ratings, there is little evidence to suggest that beneficiaries use ratings to guide their enrollment decisions. In 2013, the share of PDP enrollees (32 percent) in plans with relatively high ratings (3.5 stars or more) is somewhat lower than the share of PDPs (39 percent) with those ratings (Exhibit 19). An analysis of plan switching between 2009 and 2010 shows that enrollees in plans with at least 4 stars were actually more likely to switch than those in lower rated plans (16 percent versus 10 percent). It also shows that those who did switch plans were only slightly more likely to end up in a higher-rated plan (29 percent versus 20 percent).32 More research is needed to determine the relative importance of premiums, overall drugs costs, and performance ratings on individual beneficiary choices.
Under current CMS policy, plans with ratings of less than three stars for three years in a row are subject to a special “low performance” flag on the Medicare Plan Finder website and may have their contracts terminated. Only one PDP contract currently has this designation (plus 2 contracts in Puerto Rico): the MedicareRx Rewards Standard and Plus PDPs, both operated by Wellpoint, with about 59,000 enrollees in 24 regions, have a rating of 2 stars.
Starting in 2012, beneficiaries are eligible at any time outside the regular open enrollment period to switch from their current drug plan to a PDP with a five-star rating (or a MA-PD plan with an overall five-star rating). In 2013, only three PDPs with about 275,000 enrollees have five-star ratings: two offered by Blue Cross Blue Shield in the seven-state upper Midwest region and one offered by Excellus, a New York Blue Cross Blue Shield plan. Among MA-PD plans, 63 plans with about 700,000 enrollees earned five stars. They include Kaiser Permanente plans in most regions it serves and several smaller plans. Information is not available on how many people have used this special enrollment period, but aggregate monthly enrollment numbers suggest that Part D enrollees are not aware of or have not acted on this option.
Trends in The Part D Marketplace, 2006-2013
The total number of Part D enrollees—more than 35 million in 2013—is up about 12 percent from 2012, a higher increase than in previous years. Part of the higher increase is attributable to the first “baby boomers” aging into Medicare and enrolling in Part D. In addition, some employers have shifted their retirees to Part D plans, especially to employer-only plans,33 as a result of a provision in the Affordable Care Act of 2010 (ACA) that eliminated, effective in 2013, the tax deductibility of the 28 percent federal retiree drug subsidy for employers who provide creditable prescription drug coverage to Medicare beneficiaries. Over the two years from 2011 to 2013, total enrollment in employer-only plans has doubled from 2.9 million to 5.9 million beneficiaries, with nearly all the increase in employer-only PDPs.
Over the program’s first eight years, the Part D marketplace has been somewhat concentrated; in 2013, the ten largest sponsors of Part D plans account for more than three-fourths of all enrollees, three firms account for half of all enrollees, and UnitedHealth alone accounts for more than one in five Part D enrollees. The ten largest Part D plan sponsors in 2013 have enrolled 27.7 million beneficiaries in either a stand-alone PDP or an MA-PD plan (Exhibit 20).34 Their share of enrollment (78 percent) is higher than in 2006 (72 percent). Seven of these ten firms sponsor both stand-alone PDPs and MA-PD plans. The exceptions are Kaiser Permanente, which offers only MA-PD plans, and CVS Caremark, Express Scripts, and Envision, which offer only PDPs. Other than Kaiser Permanente, at least 40 percent of each of the top firms’ enrollment is in PDPs.
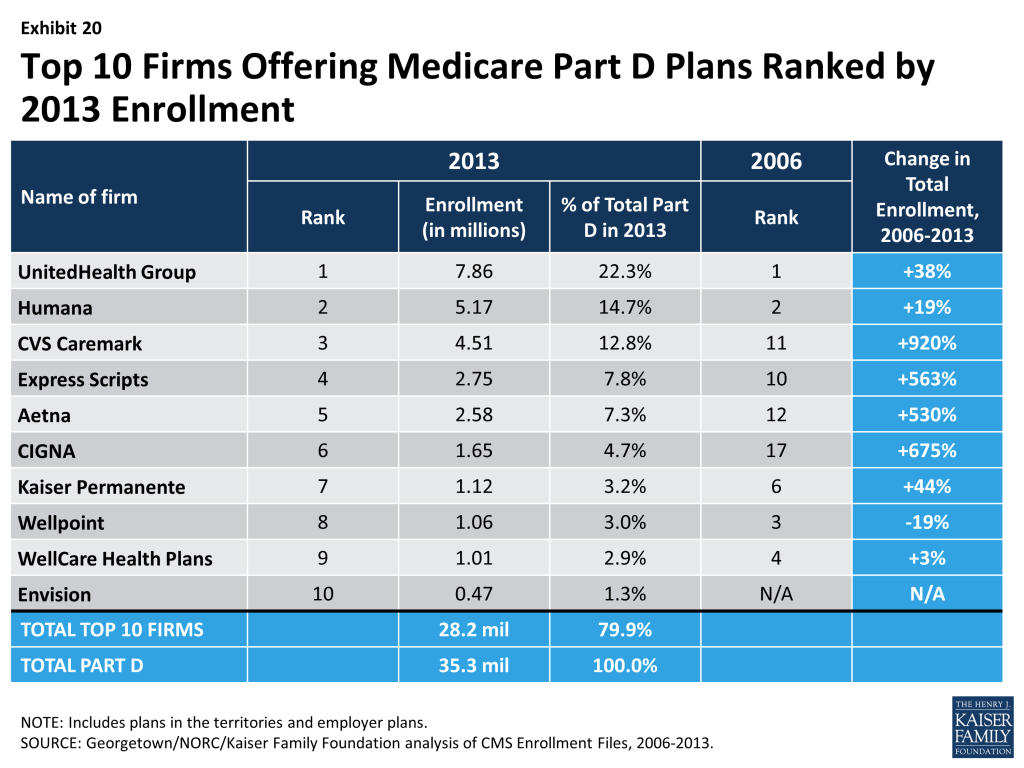
Enrollment growth since 2006 for CVS Caremark, CIGNA, Express Scripts, and Aetna is due largely to acquisitions of other plan sponsors. CVS Caremark has used an acquisitions strategy to become the third largest sponsor in the Part D marketplace. The parent company now includes 5 of the 18 firms with the most enrollees in the program’s first year. CIGNA and Aetna have grown their Part D market shares through similar acquisitions strategies.
Express Scripts has grown both through its recent acquisition of Medco, but also through the increased number of employer-only plans available in 2013. Because the ACA eliminated the tax deduction available to employers for the retiree drug subsidy, effective in 2013, some employers have shifted retirees to employer-only PDPs and MA-PD plans. Four of the top plan sponsors dominate this segment of the market, with nearly three-fourths of all enrollees in employer-only Part D plans: Express Scripts (40 percent), CVS Caremark (16 percent), UnitedHeath (10 percent), and Kaiser Permanente (8 percent).
UnitedHealth and Humana have been the two largest plan sponsors from the start of the program, but their combined share of enrollment has dropped from 45 percent in 2006 to 37 percent in 2013. UnitedHealth, likely due in part to its successful marketing relationship with AARP, has maintained its top position for five years and has seen its enrollment grow by about 38 percent since 2006. Humana has maintained a strong Part D presence, likely due in part to offering the lowest PDP premiums in 2006 and retaining many of those enrollees over time despite premium increases for its older plans. Higher-than-average premium increases and a loss of LIS benchmark status in most regions contributed to a 26 percent drop in Humana’s Part D enrollment between 2006 and 2010. But Humana’s introduction of the Walmart-Preferred PDP in 2011 reversed this decline with a 60 percent increase in the firm’s Part D enrollment from 2010 to 2013, resulting in a net enrollment gain of 19 percent over the 2006-2013 period.
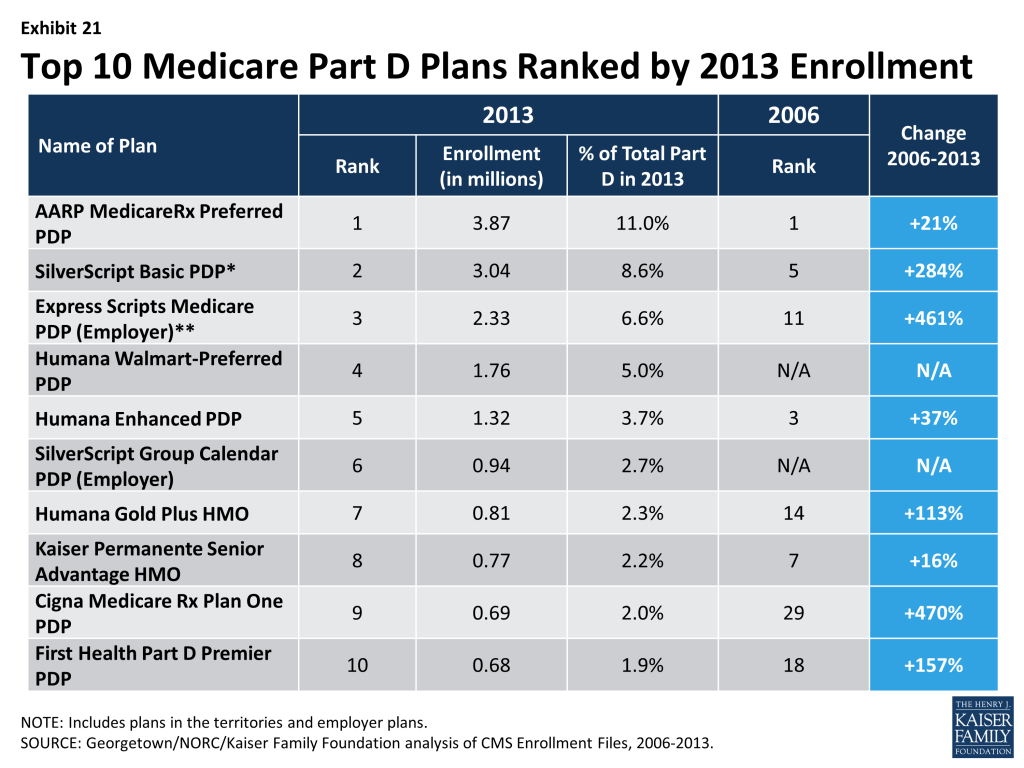
There has been more change at the level of specific plan offerings than plan sponsors. Only four of the top ten PDPs or MA-PD plans by enrollment in 2013 were among the top ten in 2006. Within many plan sponsors’ offerings, there have been significant changes in enrollment, with changes partly due to sponsors adding, dropping, or consolidating plans. Among the top ten plans in 2006, UnitedHealth’s AARP MedicareRx Preferred PDP, Humana’s Enhanced PDP, CVS Caremark’s SilverScript Basic PDP, and Kaiser Permanente’s Senior Advantage HMO have retained their top-ten ranks as of 2013 (Exhibit 21). Two of the top plans in 2013 are new entrants since 2006. The Humana Walmart-Preferred PDP was a new offering in 2011, ultimately replacing another Humana plan that was among the top plans in 2006. SilverScript’s Group Calendar PDP includes offerings of various employers for their retirees. Its growth reflects the increased interest in this model in 2013.
Overall, enrollment shifts among the top plans and plan sponsors have been accelerated by automatic re-assignment of LIS beneficiaries. If a plan loses its designation as a benchmark plan, CMS reassigns beneficiaries to a benchmark plan offered by the same sponsor if one is available; otherwise they are switched at random to a benchmark plan offered by another sponsor.
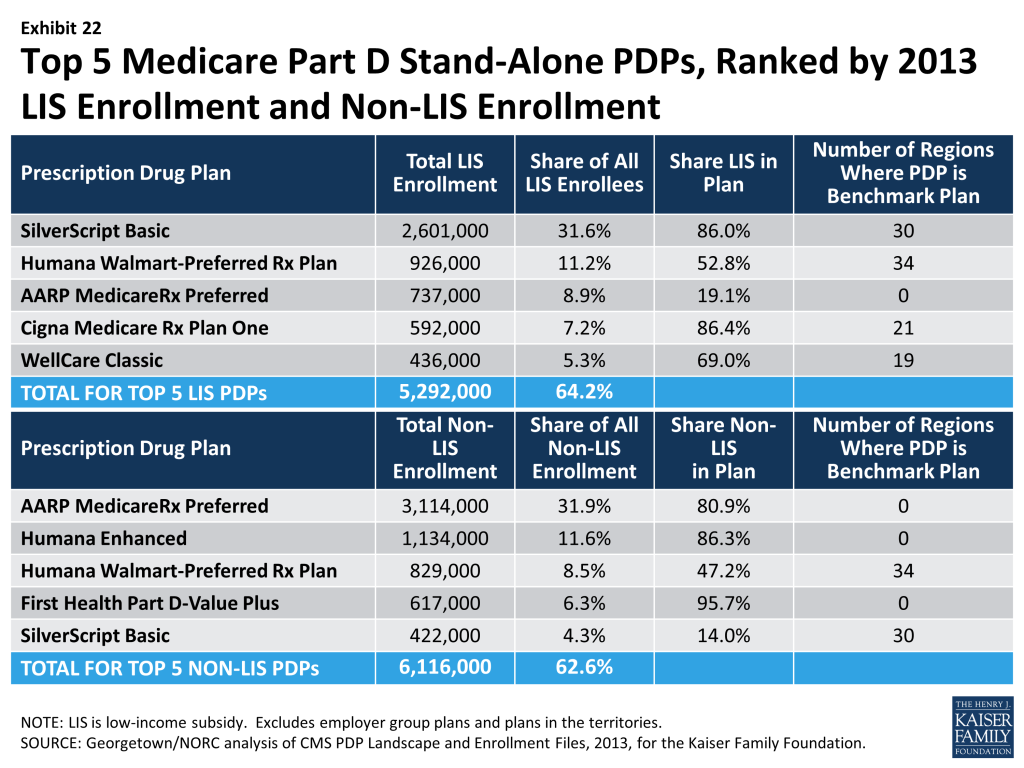
The most popular plans differ considerably for non-LIS and LIS beneficiaries. Overall, the PDP market varies by region.35 For 2013, AARP MedicareRx Preferred PDP (offered by UnitedHealth) is the largest PDP in 22 regions, SilverScript Basic PDP is the largest in 9 regions, Humana Walmart-Preferred PDP leads in 2 regions, and MedicareBlue Rx Standard PDP has the largest share of enrollment in one region. In addition to being the largest plan overall, AARP MedicareRx Preferred PDP has enrolled nearly one-third of all non-LIS enrollees nationally and has the most non-LIS enrollees in 30 of 34 PDP regions (Exhibit 22). With the help of its acquisition strategy, CVS Caremark’s SilverScript Basic PDP dominates the LIS market with about one-third of national LIS enrollment and the highest share of LIS enrollees in 28 regions. Like many PDPs with high LIS enrollment, SilverScript Basic PDP has attracted only a small share (14 percent) of non-LIS enrollees. By contrast, Humana’s Walmart-Preferred PDP has attracted enrollment in nearly equal shares from both non-LIS and LIS beneficiaries, and is among the top five plans by enrollment in each category.
Concentration of enrollment among PDPs, nationally, in 2013, as measured by a statistical measure of market competition, is down slightly from 2012 and down further from 2011.36 This partially reflects enrollment growth in some of the newly offered PDPs. But concentration is greater within regions than at the national level. Furthermore, if non-LIS and LIS beneficiaries are treated as separate markets, both are more concentrated – especially within regions.37 The most concentrated regions tend to be in the northeastern and southwestern states.
Conclusion
Medicare Part D plans are an important source of prescription drug coverage for more than 35 million Medicare beneficiaries in 2013. The program grew more than usual in the last year, as a result of some employers shifting retirees from employer-operated coverage into employer-only Part D plans along with the addition of more baby boomers aging on to Medicare as they reach age 65.
Program improvements, such as closing the benefit’s coverage gap, are occurring because of changes specified in the 2010 health reform law. CMS has estimated that in 2012, about 3.5 million beneficiaries benefited from lower out-of-pocket costs on both brand-name and generic drugs in the gap.38 Because almost no plans provide additional gap coverage for brand-name drugs, the discounts offer valuable financial protection to Part D enrollees who reach the gap.
Ongoing efforts by CMS to streamline the program have led to a smaller and better-defined set of plan options for Part D enrollees. The number of PDPs is down by nearly one-half since the peak level of offerings in 2007. The program still guarantees considerable choice, with an average of 31 PDPs and about 20 MA options. Mergers among plan sponsors and regulatory guidance from CMS have contributed to the decline, simplifying choices for Part D enrollees. And yet, the Part D marketplace remains volatile, as mergers continue to reshape the market and as premiums vary across plans. Plan consolidations that result from acquisitions lead to enrollment shifts, but evidence is lacking for a clear linkage between enrollment shifts and either premium changes or plan performance ratings.
Growth in average premiums has essentially flattened since 2010 after rising about 10 percent annually before then. Rising use of generic drugs, triggered by patent expirations for many popular brand-name drugs, has been a major factor in slowing premium growth – paralleling slower growth in the broader health system.39 The result has been savings for both the government and Part D plan enrollees. But it remains unclear whether slower growth will continue as the rate of patent expirations slows. And although premiums have been flat in recent years, enrollees have faced increases in cost sharing for individual drugs purchased over the program’s seven years, especially for brand-name drugs. In the last two years, many plans have lowered cost sharing for generic drugs, thus increasing incentives to select generics.40
The Low-Income Subsidy program continues to represent a significant source of savings for qualifying beneficiaries. But the continuing volatility of the PDP offerings available without a premium to LIS beneficiaries remains a concern. CMS assigned about 900,000 LIS beneficiaries to new plans in 2013, thus protecting their full benefits but potentially resulting in disruptions in coverage. But 1.6 million LIS enrollees are paying premiums when they could be in zero-premium plans, including more than 600,000 LIS beneficiaries paying premiums of at least $10 per month in 2013.
CMS has strengthened its system of plan performance ratings over a period of several years, but there is little evidence that ratings play a significant role in plan selection. Nearly one-fourth of PDP enrollees are in PDPs with fewer than 3 stars – a level considered low performance. Fewer than one in ten are in PDPs with at least 4 stars.
One key measure of success of the Part D program is that it has increased the availability of needed drugs to Medicare beneficiaries at a lower out-of-pocket cost than without a drug benefit. This has occurred as program spending has come in considerably below the government’s original expectations. But a benefit delivered exclusively through private plans has experienced disruptions that result from volatility in the marketplace. LIS beneficiaries have been especially vulnerable to this volatility. Based on experience in the program’s first five years, only a small share (13 percent) of all Medicare Part D enrollees voluntarily switch plans during the annual enrollment period.41 As CMS continues its efforts to ensure that available plans offer real differences and to improve the performance ratings of competing plans, it will be important to understand whether a better defined market encourages more enrollees to compare plans and make informed decisions annually.
MethodsThis report presents an analysis of the Medicare Part D 2013 marketplace, prepared by Jack Hoadley and Laura Summer (Health Policy Institute, Georgetown University), Elizabeth Hargrave (NORC at the University of Chicago), and Juliette Cubanski (Kaiser Family Foundation). Data on plan availability and premiums were collected primarily from a set of files published by CMS on a regular basis:
Results on plan benefits and formularies were supplemented with results from analysis funded by the Medicare Payment Advisory Commission (MedPAC) and performed by Elizabeth Hargrave and Katie Merrell (Social & Scientific Systems, Inc.). This analysis used plan benefit and formulary files released by CMS, in addition to the plan landscape and enrollment files. An important element of this analysis is that a drug is defined as a unique chemical entity. Thus, a plan is counted as listing a drug on its formulary if it lists any brand or generic version or any form or strength of the chemical entity. Portions of this analysis are published in MedPAC’s annual reports to Congress and databooks. We appreciate the cooperation of Katie Merrell and the MedPAC staff in making information available for this report. |
- Centers for Medicare & Medicaid Services, Medicare Advantage, Cost, PACE, Demo, and Prescription Drug Plan Contract Report – Monthly Summary Report (Data as of March 2013) (accessed at http://www.cms.gov/MCRAdvPartDEnrolData/MCESR/list.asp). ↩︎
- Part D allows employer or union group health plan sponsors to enroll Part D eligible individuals in PDPs or MA-PD plans that are designed and open only to individuals affiliated with these sponsors. CMS publishes enrollment numbers for these employer-only plans, but does not release benefit design characteristics. As a result, employer-only plans are excluded from much of the analysis in this report. ↩︎
- Patient Protection and Affordable Care Act (PPACA) and the Health Care and Education Reconciliation Act of 2010 (HCERA) ↩︎
- All Medicare Part D Data Spotlights are available at https://modern.kff.org/medicare/resources-on-the-medicare-prescription-drug-benefit-2/. These Spotlights also build on two previous reports prepared for the Kaiser Family Foundation that provided an in-depth look at Medicare drug plans in 2006 and 2007. See Jack Hoadley et al., “An In-Depth Examination of Formularies and Other Features of Medicare Drug Plans,” April 2006, available at https://modern.kff.org/medicare/report/an-in-depth-examination-of-formularies-and/; and Jack Hoadley et al., “Benefit Design and Formularies of Medicare Drug Plans: A Comparison of 2006 and 2007 Offerings,” November 2006, available at https://modern.kff.org/medicaid/report/benefit-design-and-formularies-of-medicare-drug/. This report also incorporates analysis of Part D data prepared by Elizabeth Hargrave and Katie Merrell (Social & Scientific Systems) for the Medicare Payment Advisory Commission (MedPAC). See methods note. ↩︎
- Marsha Gold et al., “Medicare Advantage 2013 Spotlight: Plan Availability and Premiums,” Kaiser Family Foundation, November 2012 https://modern.kff.org/medicare/report/medicare-advantage-2013-plan-availability-and-premiums/. About 82 percent of plans offered include drug coverage, so the average number of MA plans with drug coverage per beneficiary may be closer to 16. ↩︎
- In February 2012, CIGNA completed its acquisition of HealthSpring, including its Bravo Health subsidiary. In April 2012, Express completed its acquisition of Medco, and CVS Caremark completed its acquisition of Health Net’s Part D business. In addition, Aetna completed the acquisition of Coventry Health in May 2013. ↩︎
- Although many of these PDPs are regional offerings of plans offered nationally, the enhanced PDP offered by one national sponsor averages about 192 per region. The basic PDPs offered by two new sponsored average 112 and 303 enrollees. ↩︎
- This count excludes drug plans offered by Special Needs Plans, a type of Medicare Advantage Plan that limits membership to beneficiaries with specific diseases or characteristics. In 2013, 644 SNPs are offered; see Marsha Gold et al., “Medicare Advantage 2013 Spotlight: Plan Availability and Premiums,” Kaiser Family Foundation, November 2012 https://modern.kff.org/medicare/report/medicare-advantage-2013-plan-availability-and-premiums/. ↩︎
- The 2013 average reported here ($38.54) is lower than the amount reported in the 2012 “First Look” spotlight ($40.18) because the new average is weighted by actual 2013 enrollment. Jack Hoadley et al., “Medicare Part D: A First Look at Part D Plan Offerings in 2013,” November 2012, https://modern.kff.org/medicare/report/medicare-part-d-first-look-at-2013-plan-offerings/. The average amount is lower because net switches in plan enrollment in the fall open enrollment season (including LIS beneficiaries reassigned to new plans by CMS) were to lower-premium plans. Averages for some previous years differ by small amounts because different months are used for comparability. ↩︎
- This increase is similar to the 48 percent increase in the monthly premium between 2006 and 2012 for a single person enrolled in FEHB BC/BS (from $125.82/month in 2006 to $186.14/month in 2013). ↩︎
- For additional discussion of factors involved in the slow growth in costs, see Jack Hoadley, “Medicare Part D Spending Trends: Understanding Key Drivers and the Role of Competition,” May 2012, available at https://modern.kff.org/health-costs/issue-brief/medicare-part-d-spending-trends-understanding-key/. ↩︎
- As new plans, First Health Part D Value Plus PDP and AARP MedicareRx Saver Plus PDP are not yet subject to the requirement that plan premiums reflect the actual use of enrollees. ↩︎
- The combined average monthly Part D premium in 2013 is $29.95. ↩︎
- The average premium excludes Special Needs Plans. The overall premium in 2013 for MA plans that include drug coverage is $35 per month, down 20 percent from 2010; see Marsha Gold et al., “Medicare Advantage 2013 Spotlight: Enrollment Market Update,” June 2013, https://modern.kff.org/medicare/issue-brief/medicare-advantage-2013-spotlight-enrollment-market-update/. ↩︎
- In 2013, CMS (personal communication) calculated that the average MA-PD premium prior to rebates was $9.50 per month lower than those for PDPs. Thus, the average plan applies a rebate amount of about $15.50 to lower the premium. ↩︎
- Like the national averages, other averages presented here are weighted based on April 2013 enrollment. ↩︎
- Jack Hoadley et al., “Medicare Part D 2010 Data Spotlight: A Comparison of PDPs Offering Basic and Enhanced Benefits,” December 2009, https://modern.kff.org/medicare/report/medicare-part-d-2010-data-spotlight-a/. ↩︎
- We classify plans labeled by CMS as covering few brands or few generics (defined as less than 10 percent of drugs in a particular category) as having “little or no coverage.” We have not analyzed information on which drugs are included in the “few” drugs covered by these plans. Similarly our category “mostly generics only” includes plans that add just a “few” brand drugs to their coverage of generics. ↩︎
- Another 23 percent of MA-PD plans have gap coverage for a “few” drugs in the gap, but these plans are excluded from our definition of gap coverage. ↩︎
- This estimate excludes enrollees in plans covering only a “few” drugs in the gap. ↩︎
- Medicare Payment Advisory Commission, Report to the Congress: Medicare Payment Policy, Chapter 3, March 2009. ↩︎
- PDPs offering an enhanced benefit, but no gap coverage, have a modestly higher average premium ($41.60) than the average for PDPs with little or no coverage in the gap. ↩︎
- In the program’s first two years, a small subset of enrollees were in PDPs with one tier each for brand and generic drugs, but use of this model had nearly disappeared by 2012. ↩︎
- For 2013 estimates for employers, see Kaiser Family Foundation/HRET Survey of Employer-sponsored Health Benefits, available at https://modern.kff.org/private-insurance/report/2013-employer-health-benefits/. ↩︎
- CMS, “Medicare Part D Manual, Chapter 6, Part D Drugs and Formulary Requirements,” March 9, 2007. ↩︎
- Plans must list at least two drugs in every drug category and class, as well as most or all drugs in six protected classes. See CMS, Chapter 6, “Part D Drugs and Formulary Requirements” in the Medicare Part D Manual, available at http://www.cms.hhs.gov. ↩︎
- These results are from analysis for MedPAC, conducted by Elizabeth Hargrave and Katie Merrell (see note 4). For that analysis, the universe of drugs includes all unique chemical entities in the CMS reference file. For example, plans are considered to cover a drug if they cover any version of drug, for example if they cover a generic version but not the brand version or if they omit certain forms or strengths of the drug. ↩︎
- Brand-name drugs are based on counts of drugs by number of fills for all beneficiaries in Part D plans in 2010, as reported by CMS (the most recent report available). For purposes of this analysis, we excluded all drugs for which a generic drug will be available by the mid-2013. ↩︎
- These results are also from the analysis for MedPAC (see note 4). That analysis classifies a drug as having a particular type of utilization management if that characteristic applies to any form or strength of the drug that is on the lowest possible tier used by that plan for that drug. ↩︎
- For example, for 2013 enrollees in Community CCRx Basic PDPs in 19 regions were transferred into the SilverScript Basic PDPs as a result of the acquisition of Universal American by CVS Caremark in 2011. ↩︎
- This excludes 18 plans where enrollment could be transferred to other benchmark plans offered by the same sponsor as a result of mergers; for example, the BravoRx and HealthSpring PDPs were acquired by CIGNA. ↩︎
- See Jack Hoadley et al., “To Switch or Not to Switch: Are Medicare Beneficiaries Switching Drug Plans To Save Money?” October 2013, available at https://modern.kff.org/report-section/to-switch-or-not-to-switch-issue-brief/, for the data and methods used for this finding. ↩︎
- Part D allows employer or union group health plan sponsors to enroll Part D eligible individuals in PDPs or MA-PD plans that are designed and open only to individuals affiliated with these sponsors. CMS publishes enrollment numbers for these employer-only plans, but does not release benefit design characteristics. As a result, employer-only plans are excluded from much of the analysis in this report. ↩︎
- The marketplace analysis in this section, unlike other parts of the analysis, incorporates both PDPs and MA-PD plans and includes plans in the territories and plans offered exclusively to retirees from a particular employer. ↩︎
- Most MA-PD plans are not offered on a regional basis, so this analysis is based only on PDP offerings. ↩︎
- Market competition among PDPs, as measured by the Herfindahl index, averages 1262 across the 34 regions for overall enrollment, similar to the 2012 level but down from the 2011 level of 1474, but above the 2010 level of 909. The comparable index value computed nationally for 2013 is 986. According to current guidelines used by the Department of Justice and the Federal Trade Commission, markets in which the index is between 1500 and 2500 points are considered to be moderately concentrated, and those in which the index is in excess of 2500 points are considered to be highly concentrated. Overall, 7 of 34 regions qualify as moderately concentrated, while the other 27 and not concentrated. ↩︎
- In 2013, the non-LIS population reaches the level considered moderately concentrated in 12 of 34 regions and highly concentrated in another 6 regions. Comparable numbers for the LIS population are 16 moderately concentrated regions and 5 highly concentrated regions. ↩︎
- CMS, “The Affordable Care Act: A Stronger Medicare Program,” February 2013, available at http://www.cms.gov/apps/files/Medicarereport2012.pdf. ↩︎
- Jack Hoadley, “Medicare Part D Spending Trends: Understanding Key Drivers and the Role of Competition,” May 2012, available at https://modern.kff.org/health-costs/issue-brief/medicare-part-d-spending-trends-understanding-key/. ↩︎
- Jack Hoadley, Katie Merrell, Elizabeth Hargrave, and Laura Summer, “In Medicare Part D Plans, Low or Zero Copays and Other Features to Encourage the Use of Generic Statins Work, Could Save Billions,” Health Affairs 31(10): 2266-2275, October 2012. ↩︎
- Jack Hoadley et al., “To Switch or Not to Switch: Are Medicare Beneficiaries Switching Drug Plans To Save Money?” October 2013, available at https://modern.kff.org/report-section/to-switch-or-not-to-switch-issue-brief/. ↩︎