Data Note: What if Per Enrollee Medicaid Spending Growth Had Been Limited to CPI-M from 2001-2011?
Data Note
Congress is currently debating the American Health Care Act (AHCA), which would repeal and replace the Affordable Care Act (ACA) and also make substantial changes to the structure and financing of Medicaid. The AHCA as released on March 6, 2017 would use a per capita cap policy to cap federal funds to states for Medicaid. Growth in per enrollee amounts would be tied to growth in the medical care component of the CPI (CPI-M). On March 20, the AHCA added provisions to allow states to elect a block grant for certain populations and increase the per enrollee amounts for the elderly and people with disabilities to CPI-M plus one percentage point. This data note examines what the implications of tying per enrollee growth to CPI-M would have been for the 2001-2011 period for federal spending nationally and state-by-state by major enrollment group. This analysis is meant to illustrate how actual spending compares to spending limits that would have been in place if growth rates had been limited to CPI-M, similar to the limits proposed by the AHCA; however, the analysis does not examine the specific policy provisions of the AHCA, and, unlike assessments of the AHCA by the Congressional Budget Office (CBO), does not include the impact of repealing the ACA Medicaid expansion or other responses that states might adopt in response to federal funding limits. An overview of the methods underlying the analysis is provided in the “Methods” box below.
Key Takeaways
This data note illustrates how Medicaid spending would have differed from FFY 2001-2011 if spending growth per enrollee had been limited to CPI-M for each enrollment group. It finds:
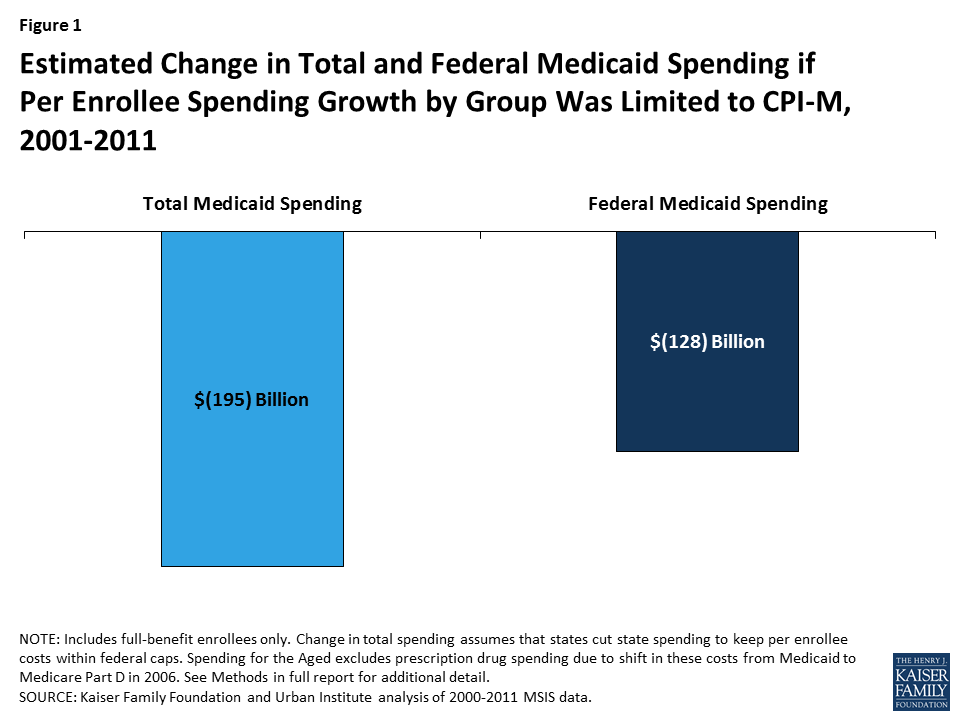
- Total Medicaid spending would have been $195 billion lower over the period on net across all groups (about 6.5% lower), and federal spending would have been $128 billion lower (about 7.0% lower).
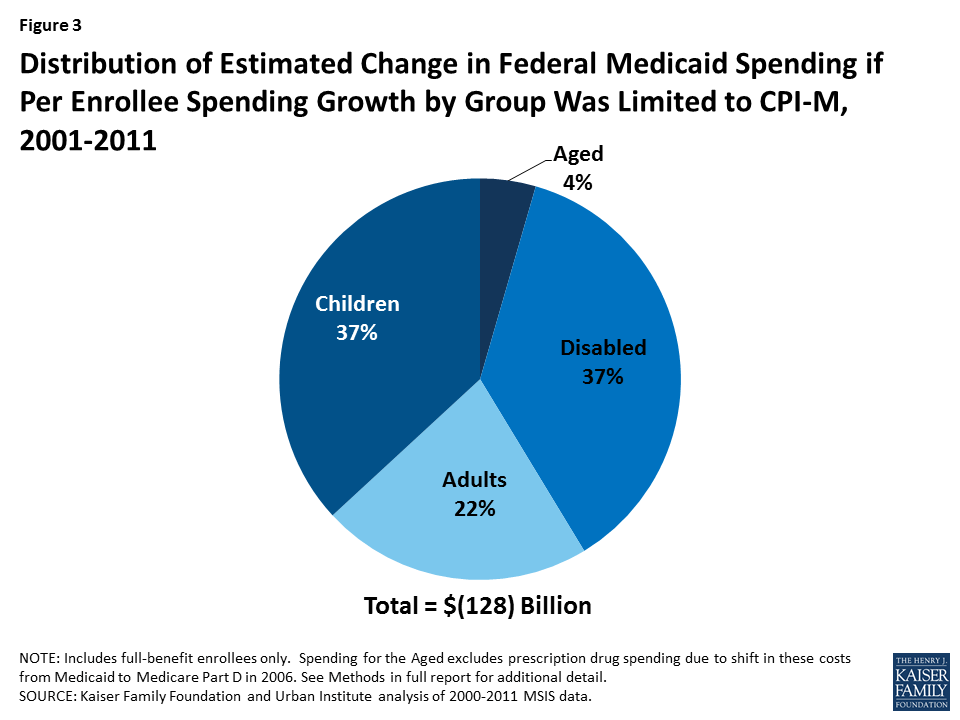
- Because spending growth and enrollment growth varied by eligibility group over the period, outcomes differ by eligibility group. Of the decline in federal dollars over the 2001-2011 period, nearly three quarters would have been for spending for children and people with disabilities (each account for 37% of the change), with declines in spending for adults accounting for 22% of the change and declines for the aged accounting for 4% of the change.
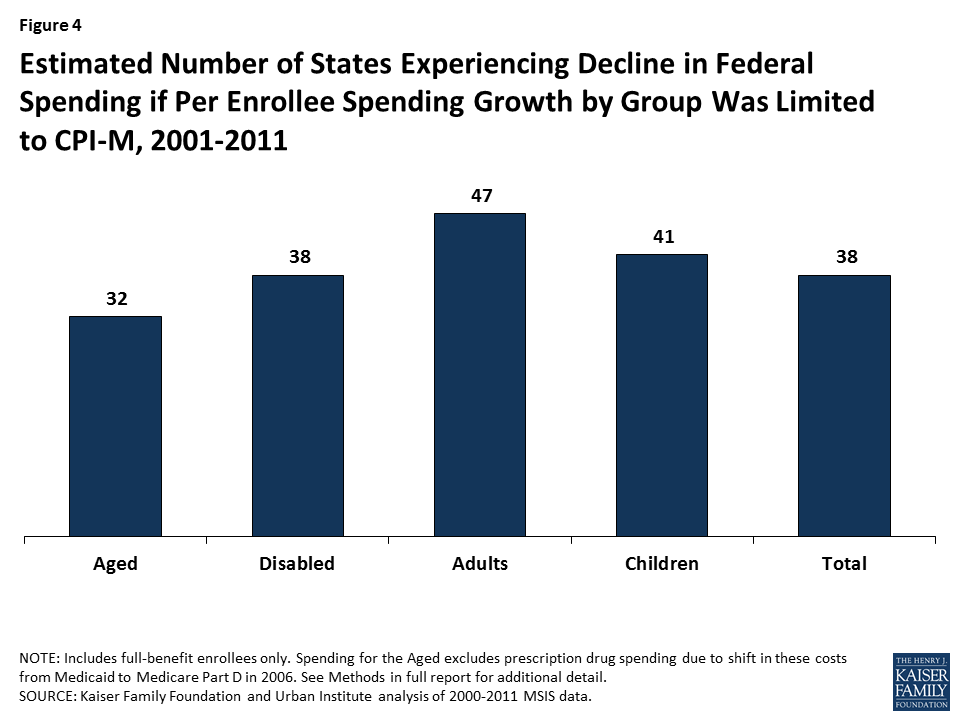
- States varied widely in their actual per enrollee growth rates and enrollment from 2000-2011, leading to state variation in changes in federal spending under the per enrollee cap that limits all states to the same growth rate. Over the 2001-2011 period, most states (38) would have experienced a reduction in federal funds in total, and more than half the states (26) would have seen a drop in federal Medicaid funds of 10% or more. About half of states (25) would have experienced at decline for each enrollee group. For children, Arizona would have faced a 38% drop in federal funds but Colorado a 24% gain; for adults, Pennsylvania would have seen a 45% loss versus a gain of 10% in Iowa; for people with disabilities, New Mexico would have lost 22% of federal funds versus +20% in Rhode Island; and among the aged, Alaska would have seen a 31% loss compared to a similar size gain in Michigan.
National Changes in Medicaid Spending
Our analysis estimates that if 2000 per enrollee spending for full-benefit beneficiaries each enrollment group were limited to growth in CPI-M for the 2001-2011 period, total Medicaid spending would have been $195 billion lower over the period on net across all groups (about 6.5% lower), and federal spending would have been $128 billion lower (about 7.0% lower) than actual total spending (Figure 1).
Changes in Spending by Eligibility Group
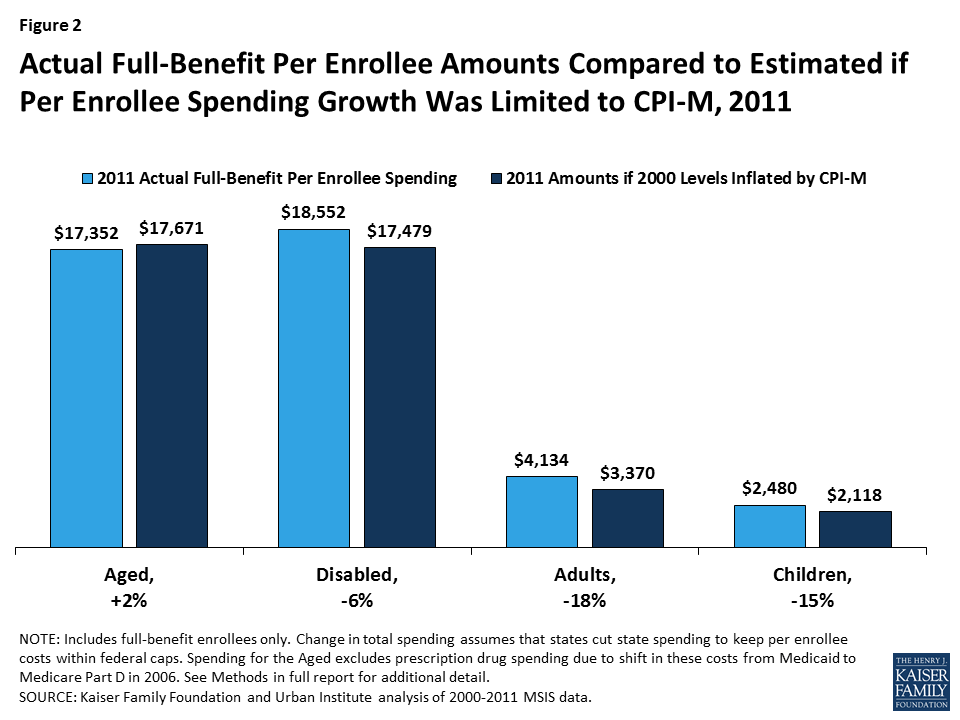
Because spending growth varied by eligibility group over the period, outcomes differ by eligibility group. Generally, spending growth per enrollee for the aged and people with disabilities was low over this period, relative to spending growth per enrollee for adults and children. Limiting growth to CPI-M for each group would have resulted in a slight increase in per enrollee spending for the aged (2%) and a slight decline for the disabled (-6%), but much larger declines for adults (-18%) and children (-15%) in 2011 (Figure 2).
Reflecting these differences in growth rates by eligibility group, as well as differences in enrollment across groups, the total decline in Medicaid spending over the 2001-2011 period is not evenly distributed across groups. Of the estimated $128 billion decline in federal dollars over the 2001-2011 period, nearly three quarters would have been for spending for children and people with disabilities (each account for 37% of the change), with declines in spending for adults accounting for 22% of the change and declines for the aged accounting for 4% of the change (Figure 3).
Limiting federal Medicaid spending to a per enrollee cap set at the sum of per enrollee spending by group yields different results than setting an overall per enrollee spending cap. Our analysis finds that, using the overall per enrollee spending cap, Medicaid spending would have increased by approximately $19 billion over the period (a 0.6% increase) and federal spending would have increased by approximately $8 billion (a 0.4% increase) (data not shown). This different outcome occurs because the overall per enrollee spending amount reflects the weighted average of spending for relatively costly groups (aged and people with disabilities) as well as relatively inexpensive groups (children and adults without disabilities). Since total Medicaid enrollment is made up mostly of the less costly groups, states overall would have fared better under a cap set at the overall per enrollee amount. However, some states (11 states) would have fared worse under an overall cap. Use of an overall cap does not adjust for changes in case mix within a state over time.
Variation by State
States varied widely in their actual per enrollee growth rates and enrollment from 2000-2011, leading to state variation in changes in federal spending under the per enrollee cap. Over the 2001-2011 period, most states (38) would have experienced a reduction in federal funds in total (Figure 4 and Table 1). Nearly all states (47) would have experienced a reduction in the adult group.
Depending on the structure of a federal per capita cap, states could possibly shift funds from a group whose expenses were below the cap to one whose expenses were above it. Based on the analysis of data from 2000-2011, about half of states (25) would have experienced declines in federal Medicaid spending for all four eligibility groups, so they would not have had savings from one group to transfer to another. Further, as evidenced by the fact that most states (38) still had a net decline in federal dollars, many states that had savings for one group would not have experienced sufficient savings to offset losses.
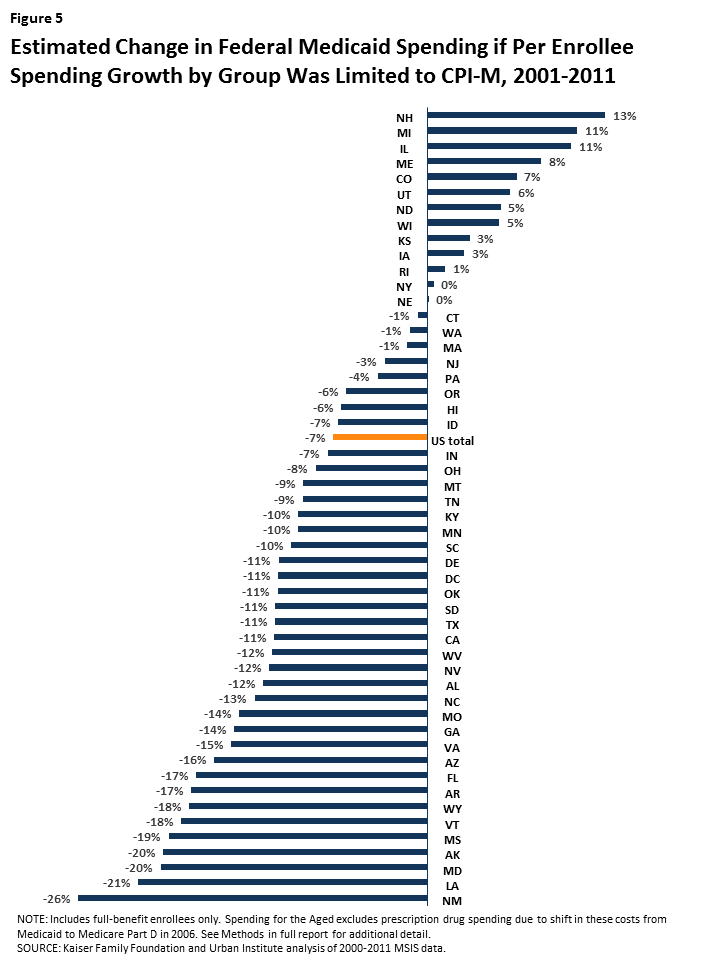
The magnitude of the change in federal Medicaid funds varies significantly by state (Table 2 and Figure 5). More than half the states (26) would have seen an overall drop in federal Medicaid funds of more than 10%. Across all eligibility groups, New Mexico, Louisiana, and Maryland would have experienced a reduction in federal funds of 26%, 21%, and 20%, respectively, while New Hampshire, Michigan, and Illinois would have received 13%, 11%, and 11% more federal dollars, respectively. Limiting federal Medicaid spending increases to a uniform rate across states would not account for differences in states’ cost of care for Medicaid beneficiaries.
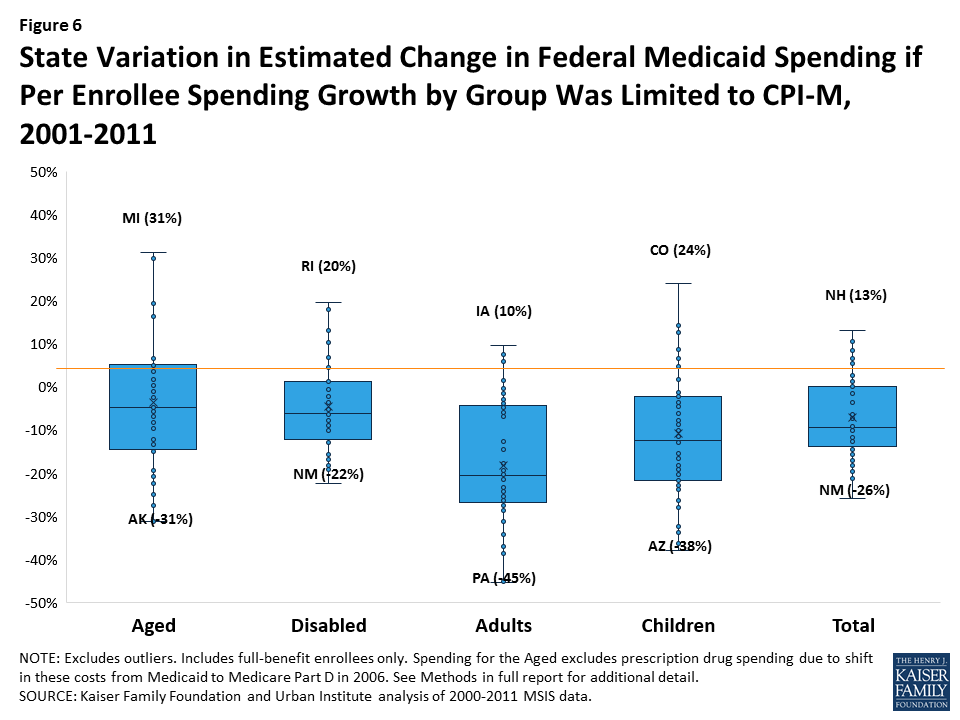
The variation by group is even larger (Figure 6). For the aged, Alaska would have experienced a 31% loss in federal funding compared to a 31% increase in Michigan; New Mexico would have experienced a 22% loss in federal funds for people with disabilities compared to a 20% gain in Rhode Island; Pennsylvania would have experienced a 45% reduction in federal funds for adults compared to a 10% increase in Iowa; and Arizona would have experienced a reduction of 38% for children compared to an increase of 24% in Colorado. Notably, actual per enrollee spending amounts by eligibility group vary by year for some states due to data anomalies in the administrative data. While our analysis corrected for clear errors in the data (see Methods for more details), it is not always clear whether states experiencing year-to-year shifts experienced actual changes or faced data issues. These data anomalies highlight the challenge of finding timely, accurate data to serve as the basis for per enrollee spending rules.
Looking Ahead
Changes to Medicaid financing proposed under the AHCA would be a major restructuring of the Medicaid program. Currently, federal Medicaid matching funds are provided on an open-ended basis and grow with both enrollment increases and changes in per enrollee spending; federal Medicaid funds also account for variation in changes to the cost of care across states. This structure has allowed Medicaid spending growth per enrollee to vary over time, accounting for changes in medical technology (e.g., new prescription drug treatments), new treatment patterns (e.g., the shift to community-based long-term care), or emerging illnesses (e.g., HIV/AIDS). It also allows spending growth to vary across states, based on variation in health care markets, the needs of residents and state policy choices. A federal per enrollee cap on Medicaid spending would grow with enrollment, but it would not account for this variation in per enrollee spending growth over time and across states. As illustrated by looking at spending per enrollee from 2001 to 2011, states would face very different outcomes if federal per enrollee growth were limited to CPI-M, and most states would have experienced a net decrease in federal Medicaid funds. Policies imposed going forward (instead of looking back) could result in federal savings, but could have significantly different implications across enrollment groups and across states. In response to limited federal funding for Medicaid, states would need to either offset those federal reductions or cut back on their Medicaid programs.
Methods
This analysis is based on data prepared by the Kaiser Family Foundation and the Urban Institute from the Medicaid Statistical Information System (MSIS) for FFY 2000-2011. We calculated Medicaid enrollment, total spending, and spending per enrollee for full-benefit enrollees in each year, both by eligibility group and for all eligibility groups combined. For aged enrollees, we excluded spending for prescription drugs to account for these costs being largely shifted to the Medicare Part D program starting in 2006. To estimate federal Medicaid spending, we apply each state’s effective Federal Medical Assistance Percentage (FMAP) for that year to total spending. FMAPs include adjustments to the federal share of Medicaid costs from April 2003-June 2004 and from October 1, 2008 through June 30, 2011.
To account for data anomalies, we made some adjustments to particular state-years in the data. Specifically, New Mexico’s spending data for FFY 2009-2011 is missing data for individuals enrolled in the state’s CoLTS program. To account for this issue, we applied nationwide annual growth rates by eligibility group to New Mexico’s 2008 per enrollee spending to calculate spending levels in subsequent years. In addition, to account for anomalies in baseline (FFY 2000) data for Tennessee (for aged) and Hawaii (for disabled), we imputed per enrollee spending for FFY 2000 for these states/groups using overall FFY 2000-2001 growth rates for the state for that year. Due to additional data quality issues, we imputed spending and enrollment in Georgia and New Mexico in FFY 2002, Maryland and West Virginia in FFY 2003, Tennessee and West Virginia in FFY 2004, and Idaho in FFY 2010. We used FFY 2010 data to estimate missing data for Florida, Kansas, Maine, Maryland, Montana, New Mexico, New Jersey, Oklahoma, Texas, and Utah in 2011. While other states may have data anomalies in the MSIS data over time, we did not adjust for all potential issues, as other anomalies were on a scale that it was difficult to determine if they were data issues or reflected real annual changes in spending or enrollment.
We then estimated per enrollee spending for FFY 2001-2011 if spending growth starting in FFY 2001 had been limited to the medical care component of the CPI (CPI-M). For each year and for the entire period, we compare actual per enrollee and total spending amounts for each eligibility group and for all eligibility groups combined to what it would have been with per enrollee growth limited to CPI-M. We assume that states cut state spending to keep per enrollee costs within federal caps.
This analysis is meant to illustrate how actual spending compares to spending limits that would have been in place if growth rates had been limited to CPI-M, similar to the limits proposed by the AHCA; however, the analysis does not examine the specific policy provisions of the AHCA (i.e. adjusting for non-supplemental DSH payments). Further, unlike assessments of the AHCA by the Congressional Budget Office (CBO), this analysis does not project future changes to Medicaid spending or include the impact of repealing the ACA Medicaid expansion.
Tables
| Table 1: Estimated Change in Federal Medicaid Spending under Federal Per Capita Cap, 2001-2011 ($ in millions) | |||||
| State | Aged | People with Disabilities | Adults | Children | Total |
| US Total | $(5,712) | $(47,194) | $(27,839) | $(46,983) | $(127,730) |
| Alabama | $(466) | $(514) | $(134) | $(1,824) | $(2,939) |
| Alaska | $(302) | $(339) | $(122) | $(420) | $(1,183) |
| Arizona | $1,639 | $(2,287) | $(1,446) | $(4,654) | $(6,747) |
| Arkansas | $(1,601) | $(1,264) | $(349) | $(638) | $(3,853) |
| California | $(7,188) | $(10,335) | $(913) | $(2,827) | $(21,263) |
| Colorado | $90 | $114 | $(23) | $903 | $1,085 |
| Connecticut | $271 | $(220) | $(174) | $(51) | $(174) |
| Delaware | $(198) | $(4) | $(298) | $(106) | $(607) |
| DC | $(253) | $(505) | $(246) | $(101) | $(1,105) |
| Florida | $(3,836) | $(5,386) | $(1,557) | $(2,504) | $(13,283) |
| Georgia | $(2,308) | $(1,665) | $(1,815) | $(761) | $(6,549) |
| Hawaii | $(86) | $(407) | $(290) | $344 | $(439) |
| Idaho | $93 | $(140) | $(109) | $(367) | $(523) |
| Illinois | $4,605 | $2,995 | $(28) | $(765) | $6,807 |
| Indiana | $(427) | $(899) | $(473) | $(642) | $(2,440) |
| Iowa | $218 | $150 | $158 | $(51) | $476 |
| Kansas | $55 | $867 | $(31) | $(466) | $425 |
| Kentucky | $(137) | $(1,185) | $(917) | $(943) | $(3,182) |
| Louisiana | $(1,577) | $(3,545) | $(466) | $(1,662) | $(7,250) |
| Maine | $(78) | $1,214 | $23 | $48 | $1,207 |
| Maryland | $(967) | $(2,575) | $(1,046) | $(1,108) | $(5,696) |
| Massachusetts | $(1,120) | $4,516 | $(1,217) | $(2,961) | $(782) |
| Michigan | $4,263 | $(178) | $538 | $1,563 | $6,185 |
| Minnesota | $411 | $(1,491) | $(987) | $(1,370) | $(3,437) |
| Mississippi | $(1,913) | $(2,178) | $(83) | $(484) | $(4,658) |
| Missouri | $24 | $(1,186) | $(1,671) | $(2,958) | $(5,791) |
| Montana | $(132) | $(122) | $(60) | $(160) | $(474) |
| Nebraska | $507 | $50 | $(115) | $(434) | $7 |
| Nevada | $(167) | $(511) | $(26) | $(42) | $(747) |
| New Hampshire | $(5) | $649 | $(8) | $90 | $727 |
| New Jersey | $627 | $(772) | $(487) | $(506) | $(1,138) |
| New Mexico | $(635) | $(1,764) | $(911) | $(1,809) | $(5,119) |
| New York | $3,440 | $(6,524) | $1,724 | $2,357 | $996 |
| North Carolina | $(177) | $(2,148) | $(1,125) | $(3,400) | $(6,850) |
| North Dakota | $(32) | $218 | $(2) | $28 | $212 |
| Ohio | $(212) | $(2,635) | $(2,154) | $(1,429) | $(6,430) |
| Oklahoma | $(424) | $(457) | $(805) | $(875) | $(2,562) |
| Oregon | $(313) | $(615) | $(539) | $286 | $(1,181) |
| Pennsylvania | $4,410 | $(3,952) | $(3,020) | $(531) | $(3,092) |
| Rhode Island | $109 | $848 | $(242) | $(608) | $107 |
| South Carolina | $(433) | $(357) | $(811) | $(1,228) | $(2,829) |
| South Dakota | $(67) | $(147) | $(92) | $(181) | $(486) |
| Tennessee | $(3,220) | $2,109 | $(2,266) | $(1,179) | $(4,557) |
| Texas | $(1,670) | $(1,676) | $(210) | $(9,914) | $(13,469) |
| Utah | $58 | $208 | $(21) | $378 | $623 |
| Vermont | $(266) | $(212) | $(280) | $(275) | $(1,032) |
| Virginia | $38 | $(1,139) | $(784) | $(1,876) | $(3,760) |
| Washington | $2,504 | $(2,197) | $(153) | $(541) | $(386) |
| West Virginia | $(528) | $(414) | $(271) | $(708) | $(1,921) |
| Wisconsin | $1,736 | $998 | $(1,456) | $515 | $1,793 |
| Wyoming | $(73) | $(185) | $(48) | $(139) | $(445) |
| SOURCE: Kaiser Family Foundation and Urban Institute analysis of FFY 2000-2011 MSIS data. | |||||
| Table 2: Estimated Percent Change in Federal Medicaid Spending under Federal Per Capita Cap, 2001-2011 | |||||
| State | Aged | People with Disabilities | Adults | Children | Total |
| US Total | -1% | -6% | -14% | -12% | -7% |
| Alabama | -7% | -5% | -20% | -26% | -12% |
| Alaska | -31% | -15% | -14% | -22% | -20% |
| Arizona | 30% | -17% | -13% | -38% | -16% |
| Arkansas | -28% | -13% | -39% | -12% | -17% |
| California | -15% | -12% | -6% | -8% | -11% |
| Colorado | 2% | 2% | -1% | 24% | 7% |
| Connecticut | 3% | -2% | -7% | -1% | -1% |
| Delaware | -19% | 0% | -21% | -10% | -11% |
| DC | -12% | -10% | -20% | -6% | -11% |
| Florida | -19% | -15% | -23% | -16% | -17% |
| Georgia | -24% | -10% | -28% | -6% | -14% |
| Hawaii | -5% | -18% | -18% | 28% | -6% |
| Idaho | 7% | -3% | -21% | -21% | -7% |
| Illinois | 42% | 11% | 0% | -5% | 11% |
| Indiana | -5% | -6% | -18% | -9% | -7% |
| Iowa | 5% | 2% | 10% | -2% | 3% |
| Kansas | 2% | 13% | -3% | -17% | 3% |
| Kentucky | -2% | -8% | -25% | -12% | -10% |
| Louisiana | -25% | -19% | -25% | -23% | -21% |
| Maine | -2% | 18% | 1% | 2% | 8% |
| Maryland | -15% | -18% | -38% | -19% | -20% |
| Massachusetts | -8% | 19% | -24% | -34% | -1% |
| Michigan | 31% | -1% | 8% | 14% | 11% |
| Minnesota | 5% | -9% | -25% | -20% | -10% |
| Mississippi | -31% | -19% | -5% | -9% | -19% |
| Missouri | 0% | -6% | -45% | -28% | -14% |
| Montana | -8% | -6% | -26% | -13% | -9% |
| Nebraska | 20% | 1% | -14% | -18% | 0% |
| Nevada | -15% | -18% | -4% | -2% | -12% |
| New Hampshire | 0% | 28% | -2% | 7% | 13% |
| New Jersey | 5% | -5% | -19% | -8% | -3% |
| New Mexico | -21% | -22% | -45% | -26% | -26% |
| New York | 5% | -6% | 6% | 9% | 0% |
| North Carolina | -2% | -8% | -23% | -26% | -13% |
| North Dakota | -2% | 13% | 0% | 5% | 5% |
| Ohio | -1% | -7% | -23% | -13% | -8% |
| Oklahoma | -10% | -5% | -37% | -13% | -11% |
| Oregon | -6% | -8% | -21% | 7% | -6% |
| Pennsylvania | 19% | -10% | -45% | -4% | -4% |
| Rhode Island | 7% | 20% | -31% | -36% | 1% |
| South Carolina | -7% | -3% | -29% | -18% | -10% |
| South Dakota | -7% | -8% | -24% | -16% | -11% |
| Tennessee | -46% | 10% | -21% | -11% | -9% |
| Texas | -8% | -4% | -2% | -24% | -11% |
| Utah | 5% | 4% | -2% | 13% | 6% |
| Vermont | -22% | -9% | -34% | -20% | -18% |
| Virginia | 1% | -10% | -34% | -32% | -15% |
| Washington | 37% | -18% | -4% | -8% | -1% |
| West Virginia | -15% | -5% | -19% | -22% | -12% |
| Wisconsin | 16% | 7% | -34% | 13% | 5% |
| Wyoming | -13% | -16% | -27% | -23% | -18% |
| SOURCE: Kaiser Family Foundation and Urban Institute analysis of FFY 2000-2011 MSIS data. | |||||