Kaiser Health Tracking Poll: June 2013
As the country gears up for implementation of the major provisions of the Affordable Care Act (ACA), this month’s Kaiser Health Tracking Poll takes a step back and examines views on health insurance more broadly among some key subgroups, including young adults, the uninsured, and those with pre-existing conditions. The poll finds that the large majority of Americans want and value health insurance. More than seven in ten young adults – a special focus of outreach and enrollment efforts – say it is very important to them personally to have insurance. Cost remains the biggest barrier for the uninsured, with four in ten citing the expense of coverage as the main reason they don’t have it. Roughly half of those under age 65 believe they or a household member has what would be considered a pre-existing condition, and a quarter of them say they have either been denied insurance or had their premium increased as a result. With the expected marketing effort for the ACA’s health exchanges still not in full swing, negative views of the law continue to outpace positive views, with 43 percent unfavorable and 35 percent favorable. However, unfavorable views are a mix of those who feel the law goes “too far” in changing the health care system (33 percent) and those who feel it “doesn’t go far enough” (8 percent). The poll also shows that differences in how the law is branded may make a difference in how it is perceived by the public. When asked how they feel about “Obamacare” rather than the “health reform law,” higher shares express both favorable (42 percent) and unfavorable (47 percent) views, and Democrats are more enthusiastic.
Young Adults Want and Value Health Insurance
One of the major goals of the ACA is to expand coverage to more people, and the June poll finds that health insurance is something the large majority of Americans want and value. Among the public overall, 87 percent say it is “very important” to them personally to have health insurance, 88 percent describe health insurance as “something I need,” and two-thirds (68 percent) say insurance is worth the money it costs.
Even among younger adults – a group that many have speculated may be resistant to getting coverage under the ACA – more than seven in ten rate having health insurance as “very important,” and similar shares feel it is something they need and that it is worth the money. Overall, just a quarter of those ages 18-30 feel they are healthy enough to go without insurance.
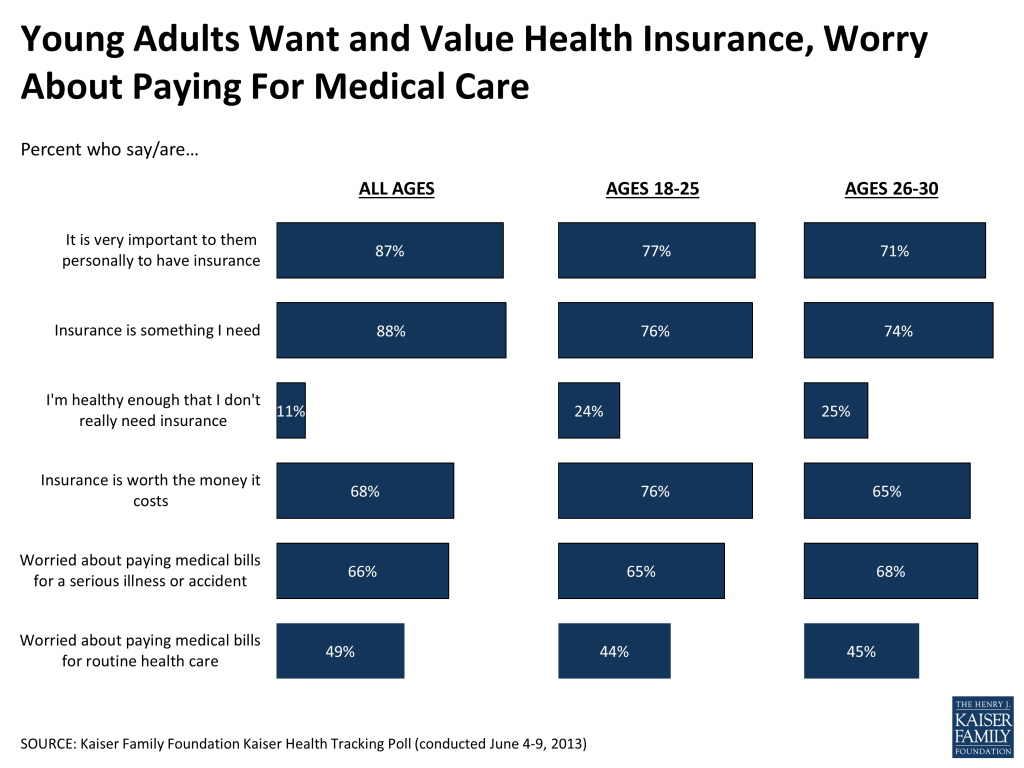
While young adults are sometime described as viewing themselves as “young invincibles,” the poll findings indicate that many young adults worry about affording medical bills, particularly catastrophic ones. Among those ages 30 and younger, roughly two-thirds say they are worried about “not being able to pay medical bills in the event of a serious illness or accident,” while over four in ten say they worry about affording medical bills “for routine health care services.”
The Uninsured Also See Coverage as Important, But Cost is the Biggest Barrier to Getting It
It’s not just the people who have insurance that value it: A majority of those who currently lack coverage also want it. Two-thirds of the uninsured say it is “very important” to them personally to have health insurance (with another 21 percent saying it is “somewhat important”), and three-quarters (76 percent) describe health insurance as “something I need.” Overall, only one in ten of the uninsured say coverage is not important to them, and just under a quarter believe they are healthy enough that they “don’t really need health insurance.” Compared with their insured counterparts, the uninsured are somewhat less convinced that health insurance is worth the money it costs, though a slim majority (56 percent) of those without insurance believe it is worth the money.
| FIGURE 2: The Uninsured See Coverage As Important And Feel It Is Something They Need | |||
| By Insurance statusAmong ages 18-64 | |||
| Total public | Insured | Uninsured | |
| How important is it to you personally to have health insurance? | |||
| Very important | 87% | 91% | 67% |
| Somewhat important | 9 | 7 | 21 |
| Not too important | 2 | 1 | 6 |
| Not at all important | 2 | 1 | 4 |
| Which of the following comes closer to your view? | |||
| Health insurance is something I need | 88 | 90 | 76 |
| I’m healthy enough that I don’t really need health insurance | 11 | 9 | 23 |
| Would you say that health insurance IS or IS NOT worth the money it costs? | |||
| Worth the money | 68 | 69 | 56 |
| Not worth the money | 27 | 27 | 40 |
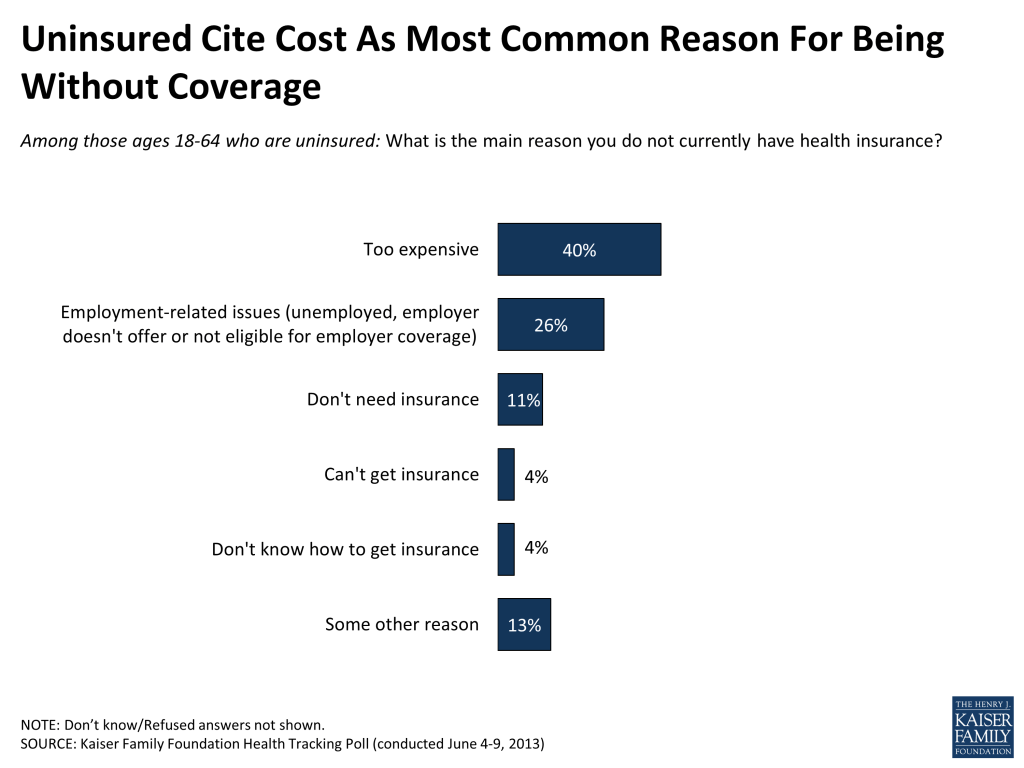
The cost of insurance remains the biggest barrier for the uninsured, most of whom (66 percent) say they have been without coverage for two years or more. When asked to cite the main reason they don’t have health insurance, four in ten of the uninsured say that coverage is too expensive, and a quarter name employment issues – either being unemployed (14 percent), not having an offer of coverage from an employer (8 percent), or not being eligible for employer coverage (4 percent). About one in ten (11 percent) say they are uninsured because they don’t think they need insurance.
Not surprisingly, those without coverage are about twice as likely as their insured counterparts to say they worry about affording both routine and catastrophic medical costs. Roughly half (51 percent) of the uninsured say they are “very worried” about not being able to pay medical bills for routine health services, and fully two-thirds (67 percent) are “very worried” about not being able to afford medical bills in the event of a serious illness of accident.
| FIGURE 4: Uninsured Twice As Likely to Worry About Affording Routine and Catastrophic Medical Costs | |||
| By Insurance statusAmong ages 18-64 | |||
| How worried are you about not being able to pay medical bills… | Total public | Insured | Uninsured |
| …for routine health care services | |||
| Very worried | 29% | 24% | 51% |
| Somewhat worried | 20 | 19 | 18 |
| Not too worried | 28 | 32 | 19 |
| Not at all worried | 22 | 24 | 12 |
| …in the event of a serious illness or accident | |||
| Very worried | 40 | 34 | 67 |
| Somewhat worried | 26 | 28 | 17 |
| Not too worried | 18 | 21 | 8 |
| Not at all worried | 15 | 16 | 9 |
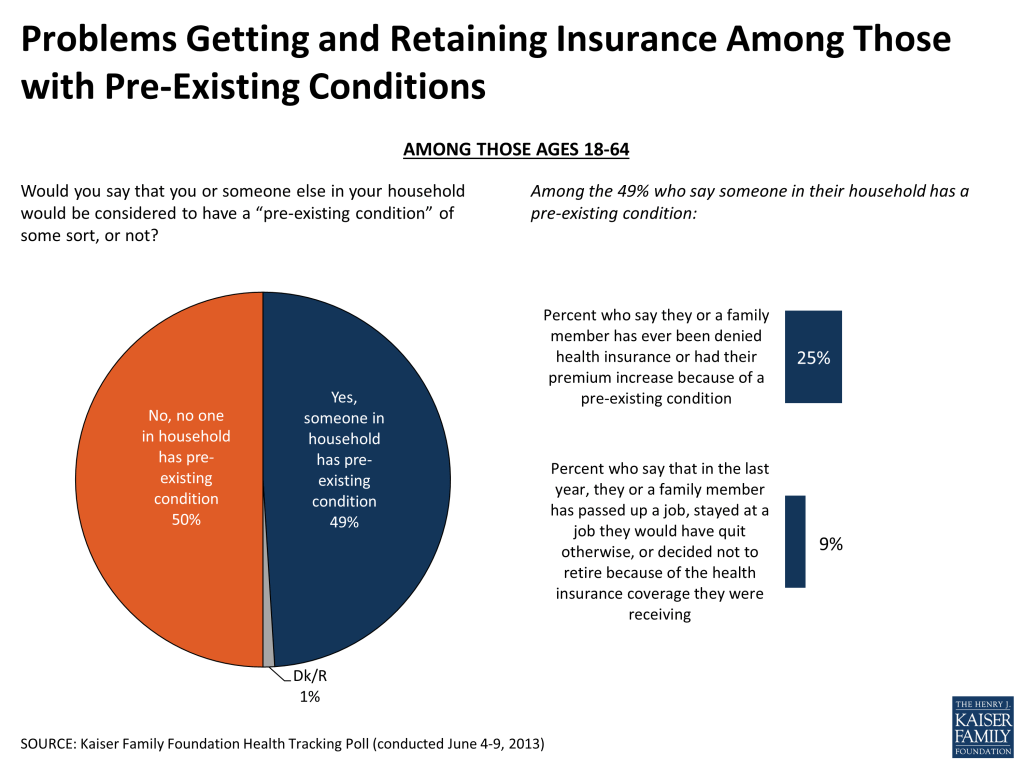
Those with Pre-Existing Conditions Face Particular Problems
Americans with pre-existing medical conditions often face problems in getting and retaining good health insurance coverage, an issue dealt with directly by ACA in its “guaranteed issue” provision, which prohibits insurance companies from denying coverage to individuals on the basis of health status or pre-existing medical conditions beginning in 2014. The June survey finds that roughly half (49 percent) of adults under age 65 say they or someone in their household has a pre-existing condition, and many of them report problems related to getting and keeping insurance.1
One quarter (25 percent) of these individuals (14 percent of all non-elderly adults) say that they or a family member has ever been denied insurance or had their premium increased because of their pre-existing condition. Further, nearly one in ten (9 percent) of these individuals say that in the past year, they or someone in their household has passed up a job opportunity, stayed at a job they would have quit otherwise, or decided not to retire in order to maintain their health coverage.
Unfavorable Views of ACA Outnumber Favorable
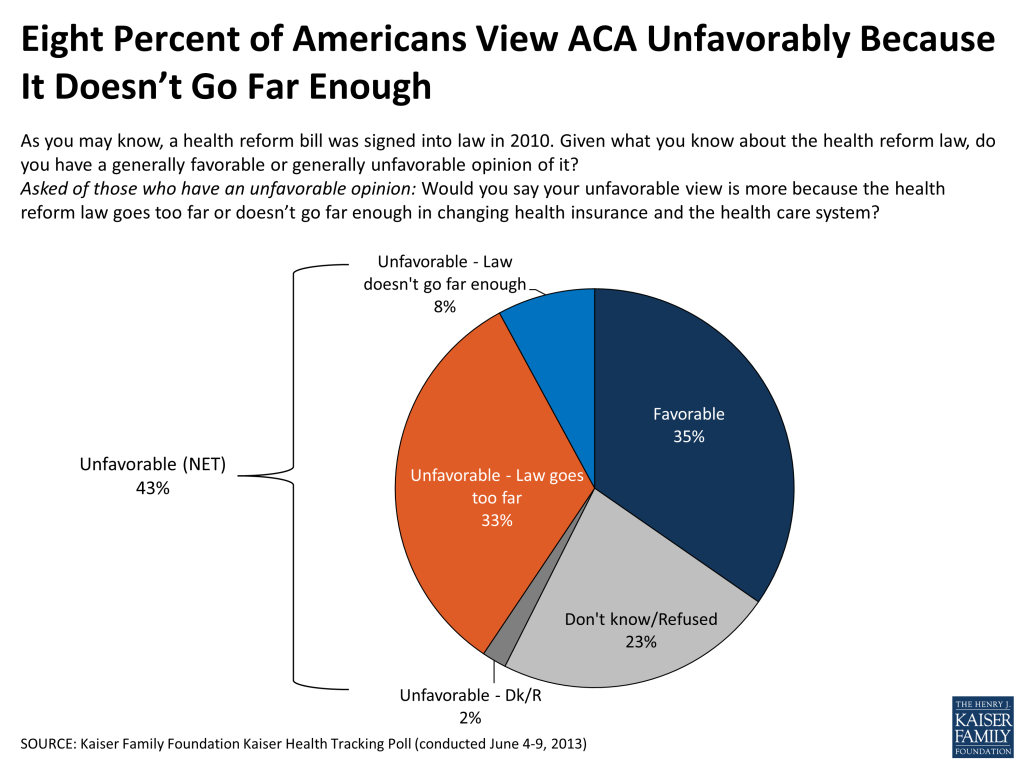
As state and federal policymakers gear up for this summer’s public awareness campaigns on the ACA, unfavorable views of the law still outnumber favorable ones, 43 percent to 35 percent, with about a quarter (23 percent) remaining undecided on the law. Views continue to diverge by partisan affiliation, with a majority of Democrats in favor of the law, a majority of Republicans opposed, and independents mirroring the public overall and titling negative.
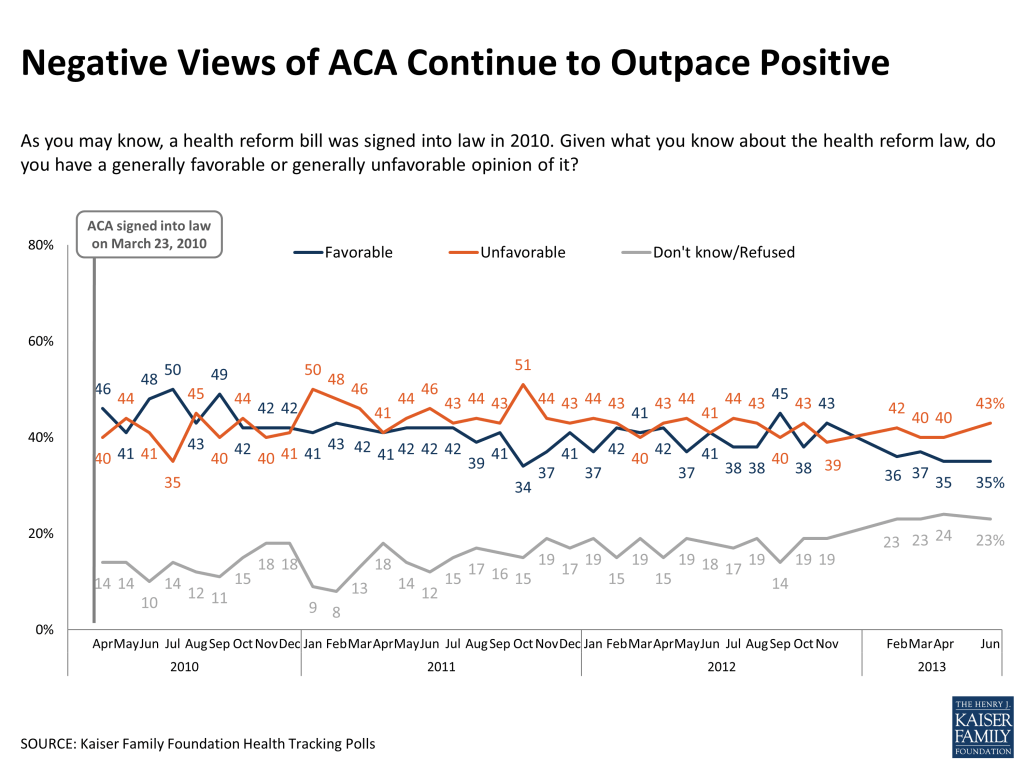
However, a notable share of the law’s critics say that their unfavorable view is mainly because the law doesn’t go far enough to change the health insurance and health care system. Overall, 33 percent of the public say they have an unfavorable view of the law because it goes too far, while 8 percent say they feel unfavorable because it doesn’t go far enough.
Democrats View “Obamacare” More Positively Than “Health Reform Law”
Even though the term “Obamacare” was originally used mostly by the law’s critics, today labeling the law as such influences the public’s reaction in a more nuanced way. Although nearly a quarter of Americans say they don’t know their view on the “health reform law”, the public is more opinionated when asked about “Obamacare”: the share offering no opinion drops to 11 percent, and the shares expressing both favorable and unfavorable views of the law rise when this term is used. Democrats show the biggest change in favorability with the alternate question wording – 73 percent say they have a favorable opinion of “Obamacare” compared to 58 percent who say the same for the “health reform law.”
| FIGURE 8: Partisan Differences In How People React to “Obamacare” | |||
| Percent saying they feel favorable/unfavorable about… | |||
| …Health Reform Law | …Obamacare | Percentage point difference | |
| Total public | |||
| Favorable | 35% | 42% | +7 |
| Unfavorable | 43 | 47 | +4 |
| Don’t know/Refused | 23 | 11 | -12 |
| Democrats | |||
| Favorable | 58% | 73% | +15 |
| Unfavorable | 17 | 16 | -1 |
| Don’t know/Refused | 25 | 10 | -15 |
| Independents | |||
| Favorable | 32% | 33% | +1 |
| Unfavorable | 43 | 52 | +9 |
| Don’t know/Refused | 24 | 14 | -10 |
| Republicans | |||
| Favorable | 12% | 14% | +2 |
| Unfavorable | 76 | 86 | +10 |
| Don’t know/Refused | 11 | 1 | -10 |
Most Expect No Personal Impact of Law; Uninsured and Those With Pre-Existing Conditions Seen as Most Likely to Benefit
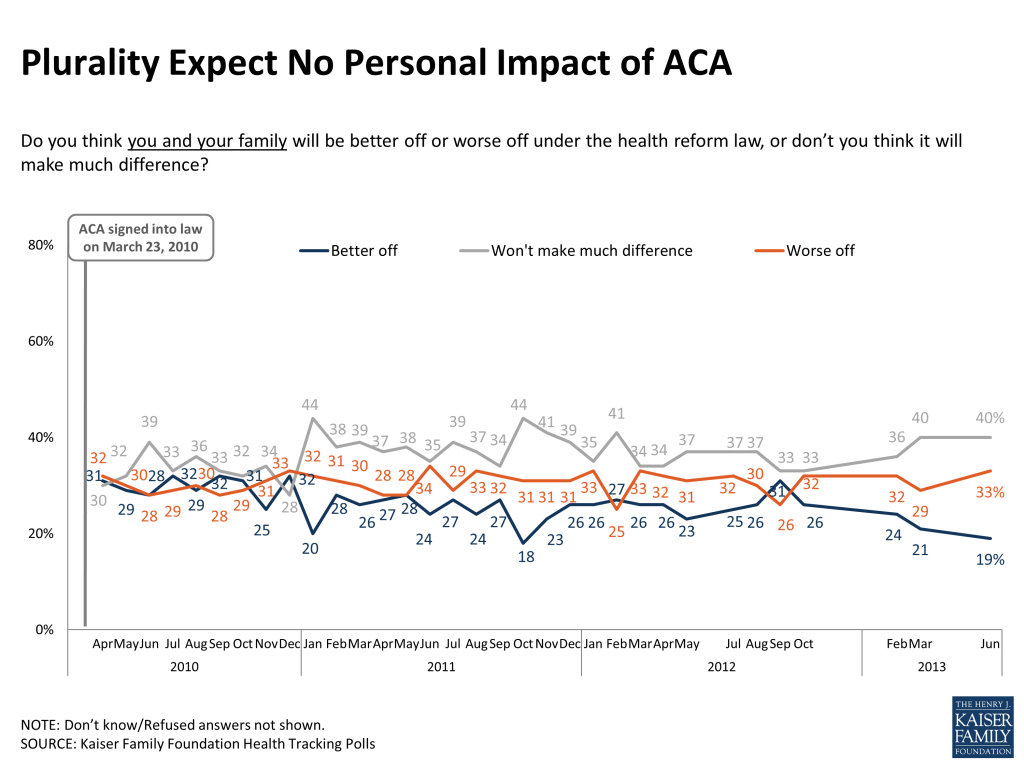
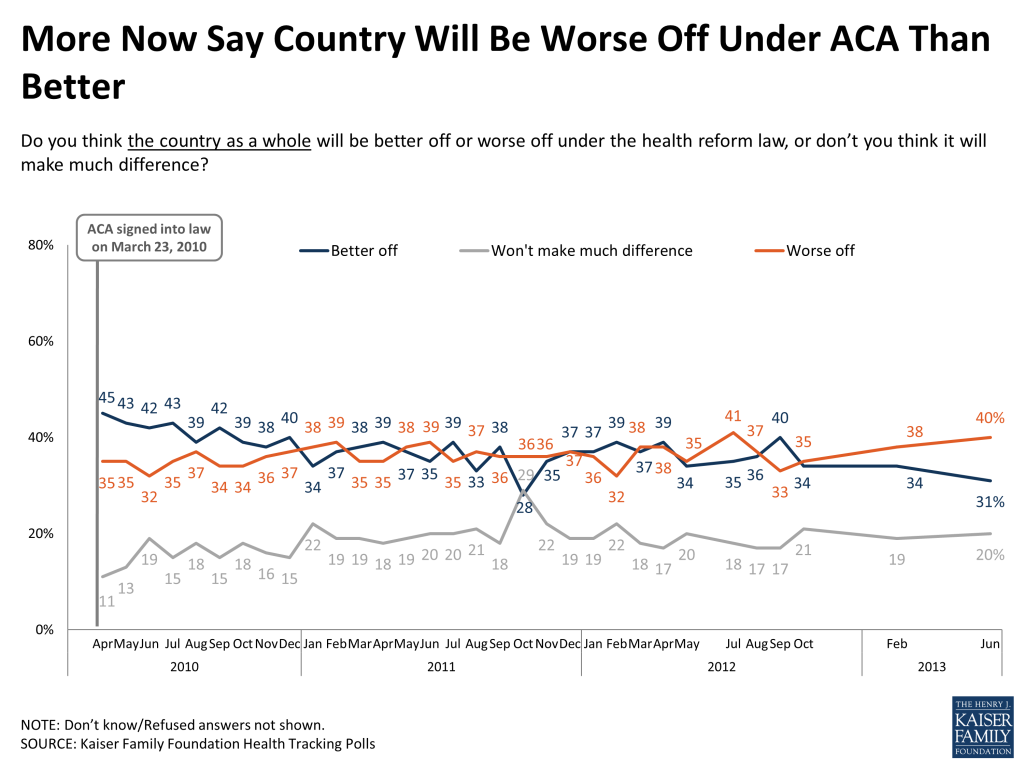
A plurality of Americans (40 percent) continues to say that the law won’t have much impact on their own families, but the gap between the share saying their family will be worse off and the share who expect to be better off has grown in recent months. Currently, a third (33 percent) expect to be worse off and 19 percent expect to be better off. Similarly, the gap between negative and positive expectations for the country as a whole has grown over the past few months, and in June, 40 percent say the country will be worse off under the law and 31 percent say it will be better (20 percent say it won’t make much difference).
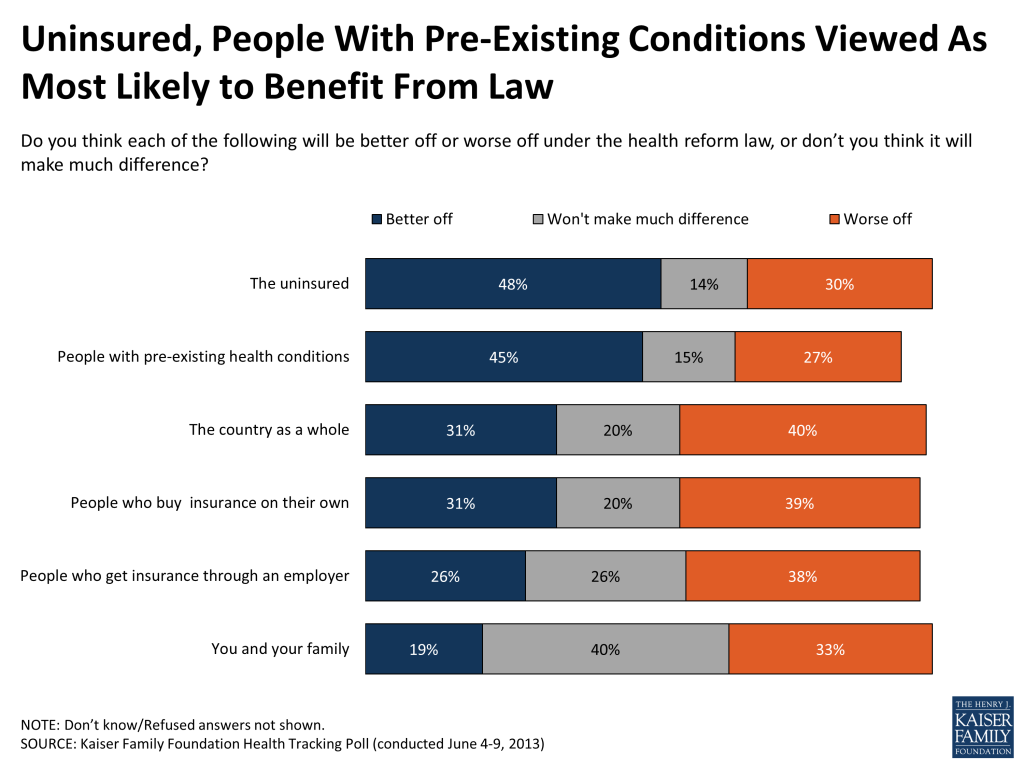
While not expecting much impact on their own families, Americans continue to see the uninsured and people with pre-existing conditions as the two groups most likely to benefit from the ACA, with nearly half saying both groups will be better off under the law (48 percent and 45 percent, respectively).
One in Five Have Heard About the Health Insurance Marketplaces
At this stage, when outreach efforts are just beginning in some states, and others have yet to get started, one in five (22 percent) say they’ve heard at least “some” about the health insurance exchanges. Two in ten lower-income Americans (20 percent) and 12 percent of the uninsured, two key target groups of the law, say they have heard more than a little about the health insurance marketplace so far.
| FIGURE 12: So Far, Few Report Hearing About Health Insurance Exchanges | ||||||
| As you may know, the health care law creates health insurance exchanges or marketplaces where people who don’t get coverage through their employers can shop for insurance and compare prices and benefits. How much, if anything, have you heard about this new health insurance marketplace, [also known as (STATE EXCHANGE NAME)] in your state? | By Insurance StatusAmong ages 18-64 | By Annual Household Income | ||||
| Total public | Insured | Uninsured | Less than $40,000 | $40,000-$89,999 | $90,000 or more | |
| A lot | 8% | 10% | 4% | 7% | 7% | 11% |
| Some | 14 | 15 | 8 | 13 | 14 | 16 |
| Only a little | 34 | 33 | 32 | 31 | 35 | 35 |
| Nothing at all | 45 | 42 | 55 | 49 | 43 | 38 |
More On Views of Insurance
The survey suggests that for most people, the value of insurance lies predominantly in the peace of mind they get from knowing they will be protected against catastrophic medical costs, rather than the help they are getting with ordinary medical bills. Asked about the most important reason to have insurance, three-quarters of the public say it is “to protect against high medical bills in case of severe illness or accident,” while about a quarter (23 percent) say it is “to pay for everyday health care expenses, like check-ups and prescriptions.”
Among those with insurance, most rate their coverage as excellent (32 percent) or good (55 percent), and half say they feel financially well-protected when it comes to meeting their health care needs. Still, a substantial share (42 percent) say they worry they might have health needs their insurance won’t cover, and another 7 percent say their insurance is inadequate and they feel very worried about getting their medical expenses paid.
Those with lower incomes and those who rate their own health status as fair or poor health are more likely to say they feel at least some financial insecurity when it comes to their health needs being paid for.
| FIGURE 13: Half of Those With Insurance Feel Financially Well-Protected | ||||||
| Which comes closest to your own view about your current health insurance coverage? | By Health Status | By Annual Household Income | ||||
| Total insured | Excellent/very good/good | Fair/poor | Less than $40,000 | $40,000-$89,999 | $90,000 or more | |
| My health insurance is good and I feel financially well-protected when it comes to meeting my health care needs | 50 | 54 | 33 | 36 | 52 | 64 |
| My health insurance is adequate, but I worry that I might have health care needs that it won’t pay for | 42 | 40 | 48 | 50 | 43 | 33 |
| My health insurance is inadequate, and I feel very worried about my health care needs not being paid for | 7 | 5 | 18 | 13 | 5 | 3 |
A Final Note: Health Insurance and the Workplace
Employers are an important source of health insurance coverage for most Americans – and will continue to be so when the major provisions of the ACA are implemented in 2014 – so this tracking poll also takes a look at people’s attitudes toward health insurance in the workplace. For the most part, health insurance is seen by workers as an important benefit, and the public overall is evenly divided over whether they would prefer to have more comprehensive health insurance and lower wages (45 percent) or a less comprehensive health plan and higher wages (46 percent).
Most of those with employer coverage feel that their employer is doing the best they can. Among those ages 18-64 with employer-sponsored coverage, two-thirds (67 percent) say that given their employer’s financial situation, they are offering the best health insurance they can afford, while three in ten (29 percent) feel their employer could be offering something better. Six in ten (61 percent) say their employer gave them a choice of at least two different plans, including four in ten (41 percent) who were given three or more plans to choose from. Those who work for business with 100 employees or more are more likely to report having a choice of plans than those who work for smaller employers (68 percent vs. 45 percent).
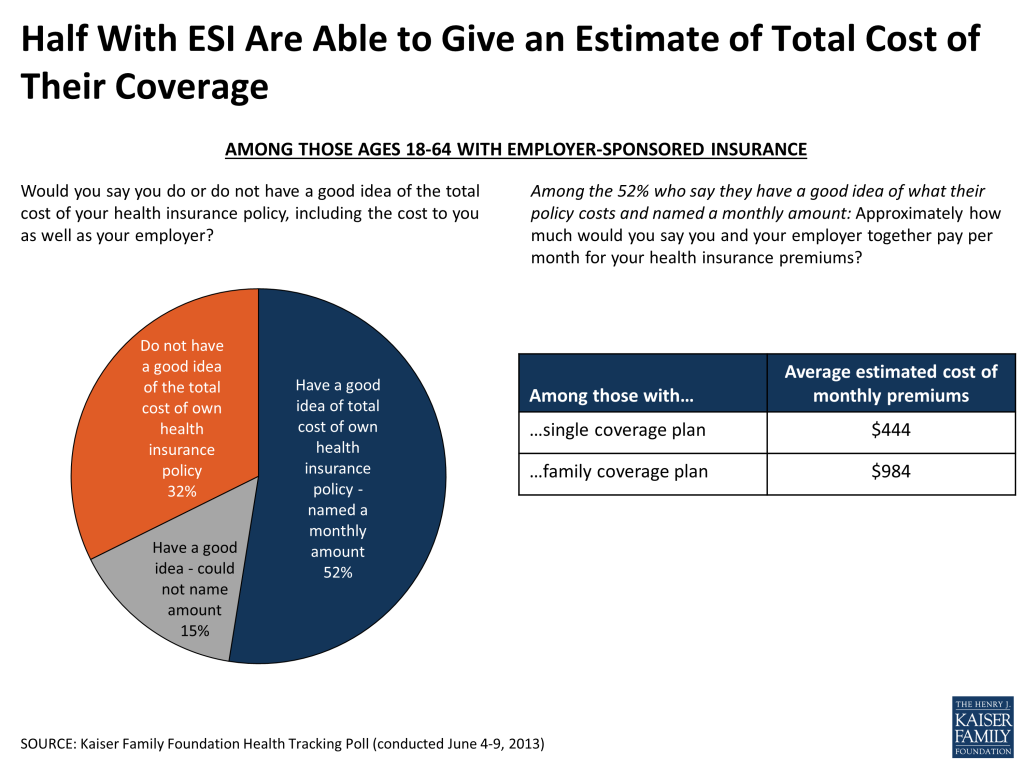
The total cost of health insurance is not always obvious to those who get coverage through an employer, and the survey finds that nearly half of those with employer-sponsored plans either say they do not have a good idea of the cost of their policy (32 percent), or were unable to estimate a dollar amount for their own plus their employer’s contribution (15 percent). However, among the 52 percent who were able to provide an estimate, the average amounts cited were not that far off from the average premium amounts measured in the Foundation’s annual survey of employers. Among those with individual coverage, the average estimate was $444 per month, not far off from the national average of $468 per month in 2012.2 For those with family coverage, the average estimate was $984, compared with an estimated average cost of $1,312 for ESI coverage for a family of four in 2012.3
This Kaiser Health Tracking Poll was designed and analyzed by public opinion researchers at the Kaiser Family Foundation led by Mollyann Brodie, Ph.D., including Liz Hamel and Sarah Cho. The survey was conducted June 4-9, 2013, among a nationally representative random digit dial telephone sample of 1,505 adults ages 18 and older, living in the United States, including Alaska and Hawaii (note: persons without a telephone could not be included in the random selection process). Computer-assisted telephone interviews conducted by landline (752) and cell phone (753, including 385 who had no landline telephone) were carried out in English and Spanish by Princeton Data Source under the direction of Princeton Survey Research Associates International (PSRAI). Both the landline and cell phone samples were provided by Survey Sampling International, LLC. For the landline sample, respondents were selected by asking for the youngest adult male or female currently at home based on a random rotation. If no one of that gender was available, interviewers asked to speak with the youngest adult of the opposite gender. For the cell phone sample, interviews were conducted with the person who answered the phone.
The combined landline and cell phone sample was weighted to balance the sample demographics to match estimates for the national population data from the Census Bureau’s 2011 American Community Survey (ACS) on sex, age, education, race, Hispanic origin, nativity (for Hispanics only), and region along with data from the 2010 Census on population density. The sample was also weighted to match current patterns of telephone use using data from the January-June 2012 National Health Interview Survey. The weight takes into account the fact that respondents with both a landline and cell phone have a higher probability of selection in the combined sample and also adjusts for the household size for the landline sample. All statistical tests of significance account for the effect of weighting. Weighted and unweighted values for key demographic variables are shown in the table below.
| Sample Demographics | ||
| Unweighted | Weighted | |
| Gender | ||
| Male | 50.9% | 48.9% |
| Female | 49.1% | 51.1% |
| Age | ||
| 18-24 | 9.3% | 13.3% |
| 25-34 | 13.0% | 17.4% |
| 35-44 | 12.4% | 16.9% |
| 45-54 | 17.6% | 18.5% |
| 55-64 | 21.1% | 16.6% |
| 65+ | 26.6% | 17.3% |
| Education | ||
| HS Graduate or Less | 32.4% | 42.8% |
| Some College/Assoc. Degree | 27.4% | 29.9% |
| College Grad. | 40.1% | 27.3% |
| Race/Ethnicity | ||
| White/not Hispanic | 74.0% | 67.1% |
| Black/not Hispanic | 9.8% | 11.5% |
| Hisp – US born | 5.2% | 7.0% |
| Hisp – born outside | 5.1% | 7.3% |
| Other/not Hispanic | 5.9% | 7.0% |
| Party Identification | ||
| Democrat | 28.9% | 30.0% |
| Independent | 34.9% | 35.2% |
| Republican | 25.0% | 22.4% |
| Other | 7.0% | 7.6% |
The margin of sampling error including the design effect for the full sample is plus or minus 3 percentage points. For results based on subgroups, the margin of sampling error may be higher. Sample sizes and margin of sampling errors for other subgroups are available by request. Note that sampling error is only one of many potential sources of error in this or any other public opinion poll.
The response rate calculated based on the American Association for Public Opinion Research’s Response Rate 3 formula was 10 percent for the landline sample and 9 percent for the cell phone sample.
Endnotes
- Those ages 65 and older are excluded from this analysis because of their access to Medicare. Respondents were read the following definition: “In general, the term ‘pre-existing condition’ is used by insurance companies to describe an illness or medical condition that a person had before they began looking for insurance. For example, if you were looking to buy health insurance but had a history of asthma, diabetes or high blood pressure, those would be considered pre-existing conditions, along with illnesses such as cancer. Given that definition, would you say that you or someone else in your household would be considered to have a ‘pre-existing condition’ of some sort, or not? ↩︎
- Source: Kaiser Family Foundation /Health Research & Educational Trust 2012 Employer Health Benefits Survey (http://modern.kff.org/health-costs/report/employer-health-benefits-2012-annual-survey/). Note that while this is not a direct comparison, it does give a sense of whether those who say they have a good idea of the total cost of their policy are able to provide reasonably accurate amounts. ↩︎
- Note that this is not an exact comparison, as survey respondents in family plans may have varying family sizes, and many may have plans that cover only one adult plus one or more children, which would be less expensive than coverage for a family of four with two adults and two children. ↩︎