Kaiser Health Tracking Poll: February 2014
Amid the recent media focus on “narrow network” health insurance plans, the latest Kaiser Health Tracking Poll finds that those who are most likely to be customers in the Affordable Care Act (ACA)’s new insurance exchanges (the uninsured and those who purchase their own coverage) are more likely to prefer less costly plans with narrow networks over more expensive plans with broader networks. Narrow network plans are a tougher sell among those with employer coverage, who tend to pay less of their health care costs directly since their employers pick up much of the cost. Overall opinion of the ACA remains about the same as it has been since November, with just under half the public viewing the law unfavorably (47 percent this month, 50 percent in January) and just over a third having a favorable view (35 percent this month, 34 percent in January). Still, more Americans want Congress to keep the law in place and work to improve it rather than repeal it. Among those who are currently uninsured, unfavorable views of the law continue to outnumber favorable ones by a large margin as they did in January. Lack of awareness about key aspects of the law also continues among the uninsured – just about a quarter are aware of the March 31st deadline to sign up for coverage, and just over six in ten say they know little or nothing about the ACA’s health insurance exchanges.
Overall, more prefer expensive broad-network plans over cheaper narrow-network plans, but potential ACA exchange customers lean in the opposite direction
There has been a lot of discussion in the news recently about “narrow network” health insurance plans that limit the range of doctors and hospitals their customers can visit, or charge them more for visiting providers outside the network. While the concept of narrow network plans pre-dates the ACA, attention has been drawn to the issue as many consumers are weighing their options on the health insurance exchanges and choosing between narrower network plans, which typically have lower premiums and cost-sharing, and plans with broader networks that are usually more expensive.
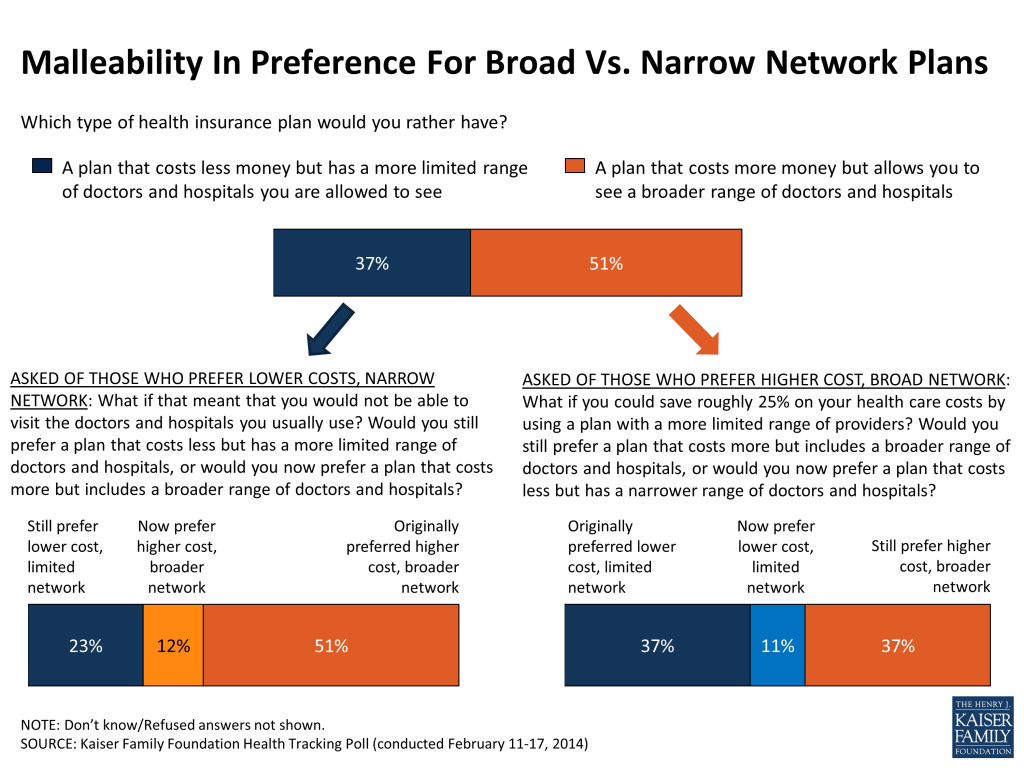
The latest Kaiser Health Tracking Poll finds that, in general, the public leans towards more expensive plans with broader networks. About half (51 percent) say they would rather have a plan that costs more money but allows them to see a broader range of doctors and hospitals, while just under four in ten (37 percent) prefer a plan that is less expensive but allows them to visit a more limited range of providers. While older individuals and those with higher incomes exhibit a clearer preference for more expensive plans with broader networks, younger adults and those with lower incomes are more evenly divided in their preferences. But those who are either uninsured or currently purchase their own coverage – a group that is most likely to be in a position to take advantage of new coverage options under the ACA – are more likely to prefer less costly narrow network plans over more expensive plans with broader networks (54 percent versus 35 percent). Those who currently get their insurance through an employer (and are more protected from the cost of coverage) have the opposite preference: 55 percent prefer a more expensive plan with a broader network, while 34 percent would rather have a cheaper narrow network plan.
| Figure 1: Preferences For Narrow Versus Broad Network Plans | |||
| Which type of health insurance plan would you rather have? | |||
| A plan that costs less money but has a more limited range of doctors and hospitals you are allowed to see | A plan that costs more money but allows you to see a broader range of doctors and hospitals | Neither of these/Don’t know/Refused | |
| Total public | 37% | 51% | 12% |
| By age | |||
| 18-29 | 47 | 47 | 5 |
| 30-49 | 41 | 50 | 9 |
| 50-64 | 32 | 52 | 15 |
| 65+ | 26 | 54 | 20 |
| By annual household income | |||
| Less than $40,000 | 44 | 44 | 12 |
| $40,000-$89,999 | 34 | 54 | 13 |
| $90,000 or more | 30 | 62 | 8 |
| By insurance type (ages 18-64) | |||
| Employer-sponsored | 34 | 55 | 10 |
| Uninsured or purchase own insurance | 54 | 35 | 10 |
Those who prefer narrow network plans may be less likely to prefer them if it means they can’t see their usual providers. When those who prefer a less costly narrow network plan are presented with the possibility that they would not be able to visit the doctors and hospitals they normally use, the share who continue to prefer this option drops from 37 percent to 23 percent among the public overall, and from 54 percent to 35 percent among the uninsured and those who buy their own insurance.
On the other hand, when those who initially prefer a more expensive plan with a broader network are told that they could save up to 25 percent on their health care costs1 , the share continuing to prefer the more expensive option drops from 51 percent to 37 percent among the public overall, and from 35 percent to 22 percent among those the uninsured and those with non-group coverage.
Overall opinion on the ACA holds steady, but most want the law kept in place rather than repealed
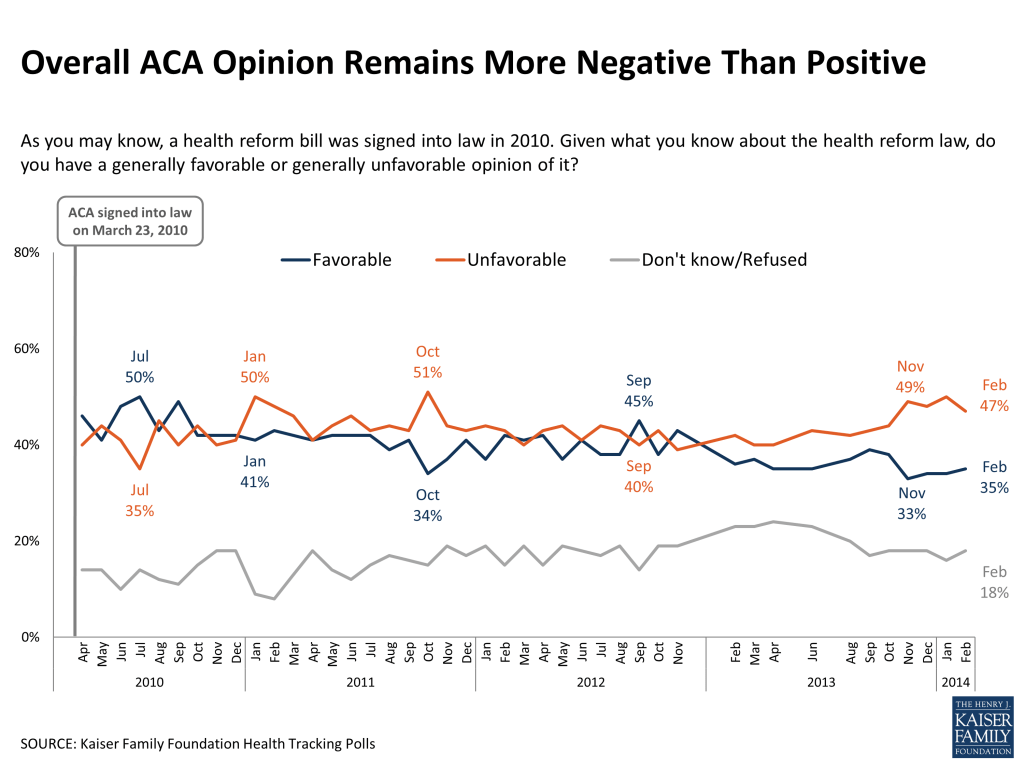
Overall public opinion on the ACA in February looks much like it has since last November, with nearly half (47 percent) having an unfavorable view of the law and just over a third (35 percent) viewing it favorably. A plurality of the public (44 percent) say their impression of the law is based mostly on what they’ve seen in the media, while smaller shares say it’s based on their own experience (23 percent) or what they’ve heard from friends and family (18 percent).
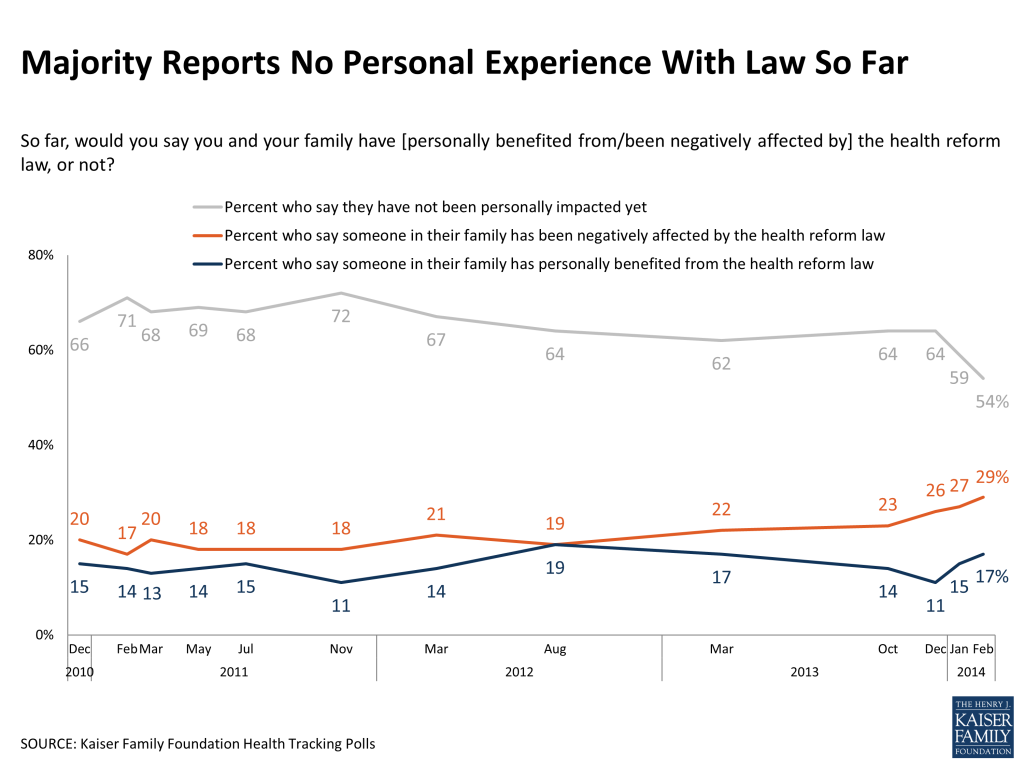
While most Americans (54 percent) continue to say they haven’t been impacted by the law one way or another, the share saying they’ve been negatively affected has inched up in recent months (29 percent in February, up from 23 percent last October) and continues to outpace the share saying they’ve personally benefited from the law (17 percent).
When it comes to next steps on the law, a majority say it should be kept in place, including 48 percent who want Congress to work to improve it and 8 percent who say it should be kept as is. Fewer say Congress should repeal the law and replace it with a Republican-sponsored alternative (12 percent) or repeal it and not replace it (19 percent). Like opinions on the law overall, views about next steps are deeply divided by political party identification, with most Democrats preferring to keep the law in place and a majority of Republicans wanting to see it repealed. Among independents, more than half want Congress to keep the law as is or work to improve it, while a third prefer to see it repealed.

The uninsured continue to view the law unfavorably
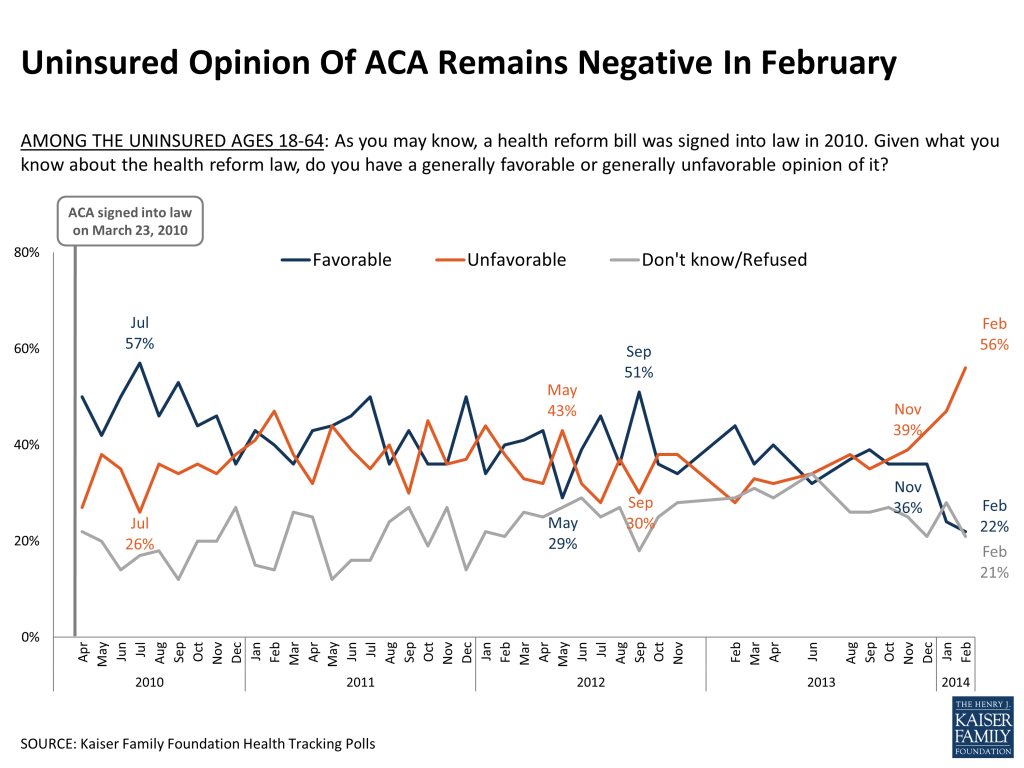
Last month’s tracking poll found a negative shift in opinion of the ACA among those who are currently uninsured, and that trend continues in February, with 56 percent of the uninsured having an unfavorable opinion of the law and 22 percent a favorable one. As more Americans gain coverage under the law, we can expect the group who remain uninsured to change over time, and some changes in opinion may be attributable to changes in who remains uninsured, rather than a shift in opinion among individuals.
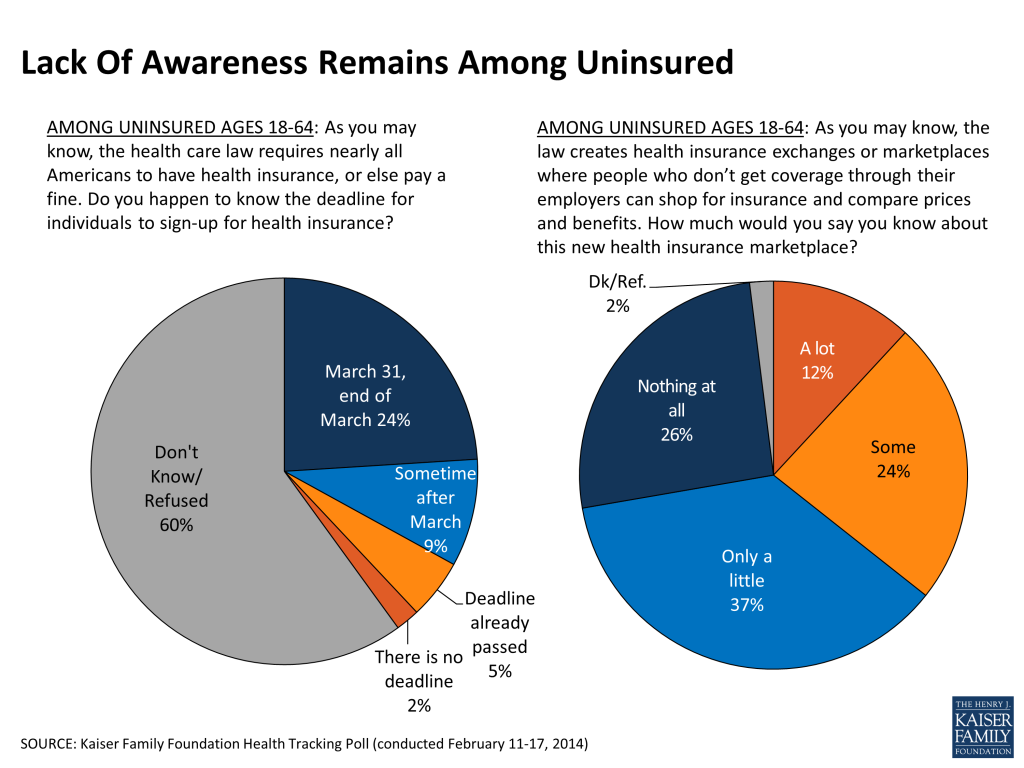
Lack of awareness continues among the uninsured
Among those who report being uninsured in February, confusion and lack of awareness continue. Half (50 percent) say they don’t have enough information to understand how the law will impact their own families. Nearly two-thirds say they know only a little (37 percent) or nothing at all (26 percent) about the ACA’s health care marketplaces, and just a quarter (24 percent) are aware that the deadline to sign up for coverage and avoid paying a penalty is at the end of March.
Forty-four percent of the uninsured say they have tried to seek out more information about the ACA over the past few months, and 15 percent say they have been personally contacted by someone about the law through a phone call, email, text message, or door-to-door visit. Similar to last month, 39 percent of the uninsured say they have tried to get insurance for themselves in the past 6 months, and half (49 percent) say they plan to get coverage this year.
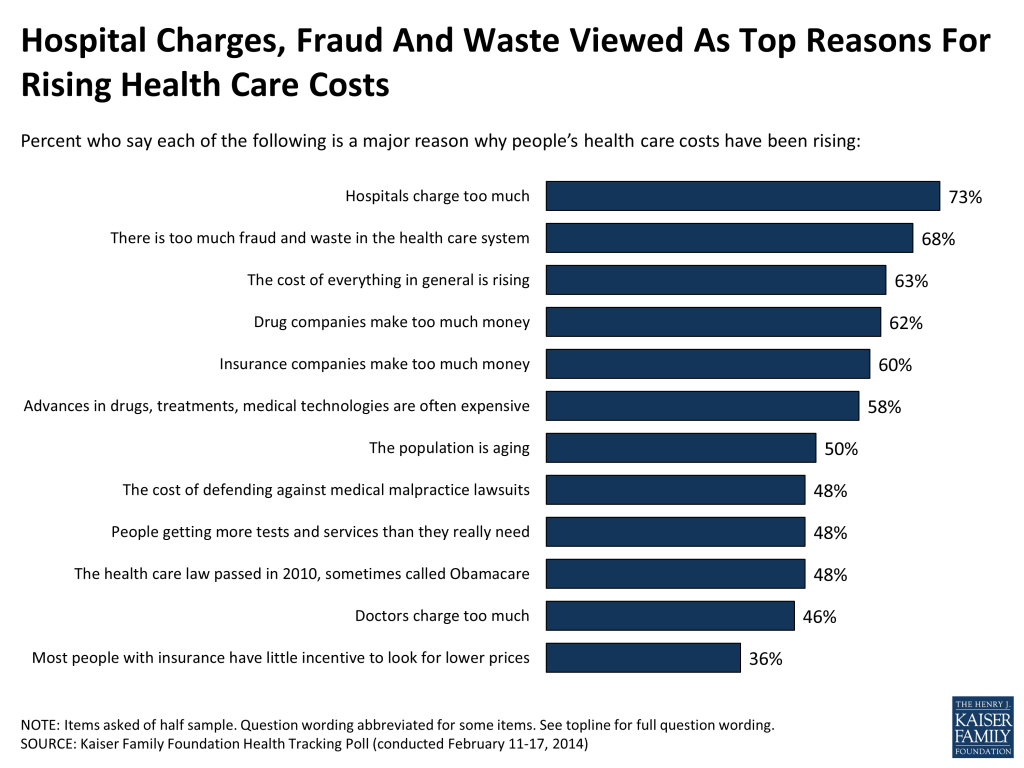
Hospital prices and health care fraud top the public’s reasons for rising costs
Last month’s Kaiser Health Tracking Poll found that half of Americans believe national health care costs have been rising faster than usual over the past few years, despite a recent CMS report to the contrary.
This month’s poll finds that on a more personal level, a majority of the public (55 percent) says their own family’s health care costs have been going up over the past few years, while 37 percent say they have been staying about the same and just 3 percent say they’ve been going down.
When asked about the reasons behind rising health care costs, the public finds plenty of sources to blame. At the top of the list are high hospital charges (73 percent say this is a “major reason” for rising costs), followed by fraud and waste in the health care system (68 percent). About six in ten see other major reasons including rising costs in general (63 percent), drug and insurance companies making too much money (62 percent and 60 percent, respectively), and expensive advances in medical technology (58 percent). Other factors are seen as major reasons for rising costs by about half the public, including the aging of the population (50 percent), the cost of defending against medical malpractice lawsuits (48 percent), people getting more tests and services than they really need (48 percent), and high charges by doctors (46 percent).
Similarly, about half the public (48 percent) believes the ACA is a major contributor to rising health care costs. Not surprisingly, there are partisan differences in views on this question. Two-thirds (67 percent) of Republicans and about half (52 percent) of independents say the law is a major factor in rising costs, while just about a quarter (26 percent) of Democrats agree.
This Kaiser Health Tracking Poll was designed and analyzed by public opinion researchers at the Kaiser Family Foundation (KFF) led by Mollyann Brodie, Ph.D., including Liz Hamel, Bianca DiJulio, and Jamie Firth. The survey was conducted February 11-17, 2014, among a nationally representative random digit dial telephone sample of 1,501 adults ages 18 and older, living in the United States, including Alaska and Hawaii (note: persons without a telephone could not be included in the random selection process). Computer-assisted telephone interviews conducted by landline (750) and cell phone (751, including 415 who had no landline telephone) were carried out in English and Spanish by Princeton Data Source under the direction of Princeton Survey Research Associates International (PSRAI). Both the random digit dial landline and cell phone samples were provided by Survey Sampling International, LLC. For the landline sample, respondents were selected by asking for the youngest adult male or female currently at home based on a random rotation. If no one of that gender was available, interviewers asked to speak with the youngest adult of the opposite gender. For the cell phone sample, interviews were conducted with the person who answered the phone. KFF paid for all costs associated with the survey.
The combined landline and cell phone sample was weighted to balance the sample demographics to match estimates for the national population using data from the Census Bureau’s 2012 American Community Survey (ACS) on sex, age, education, race, Hispanic origin, nativity (for Hispanics only), and region along with data from the 2010 Census on population density. The sample was also weighted to match current patterns of telephone use using data from the January-June 2013 National Health Interview Survey. The weight takes into account the fact that respondents with both a landline and cell phone have a higher probability of selection in the combined sample and also adjusts for the household size for the landline sample. All statistical tests of significance account for the effect of weighting.
The margin of sampling error including the design effect for the full sample is plus or minus 3 percentage points. Numbers of respondents and margin of sampling error for key subgroups are shown in the table below. For results based on other subgroups, the margin of sampling error may be higher. Sample sizes and margin of sampling errors for other subgroups are available by request. Note that sampling error is only one of many potential sources of error in this or any other public opinion poll.
| Group | N (unweighted) | M.O.S.E. |
| Total | 1,501 | ±3 percentage points |
| Insurance Status (age 18-64) |
|
|
Uninsured | 137 | ±9 percentage points |
Employer-Sponsored Insurance | 606 | ±4 percentage points |
Uninsured or purchased own insurance | 210 | ±7 percentage points |
| Party Identification |
|
|
Democrats | 432 | ±5 percentage points |
Republicans | 333 | ±6 percentage points |
Independents | 546 | ±5 percentage points |
| Age |
|
|
18-29 | 221 | ±7 percentage points |
30-49 | 376 | ±5 percentage points |
50-64 | 457 | ±5 percentage points |
65+ | 443 | ±5 percentage points |
| Household Income |
|
|
Less than $40,000 | 565 | ±5 percentage points |
$40,000-$89,999 | 459 | ±5 percentage points |
$90,000 or more | 316 | ±6 percentage points |
Endnotes
- Rough estimate of 25% cost savings using narrow network plan is based on McKinsey Center for U.S. Health System Reform report, Hospital networks: Configurations on the exchanges and their impact on premiums: http://www.mckinsey.com/~/media/mckinsey/dotcom/client_service/healthcare%20systems%20and%20services/pdfs/hospital_networks_configurations_on_the_exchanges_and_their_impact_on_premiums.ashx ↩︎