Kaiser Health Tracking Poll: August-September 2014
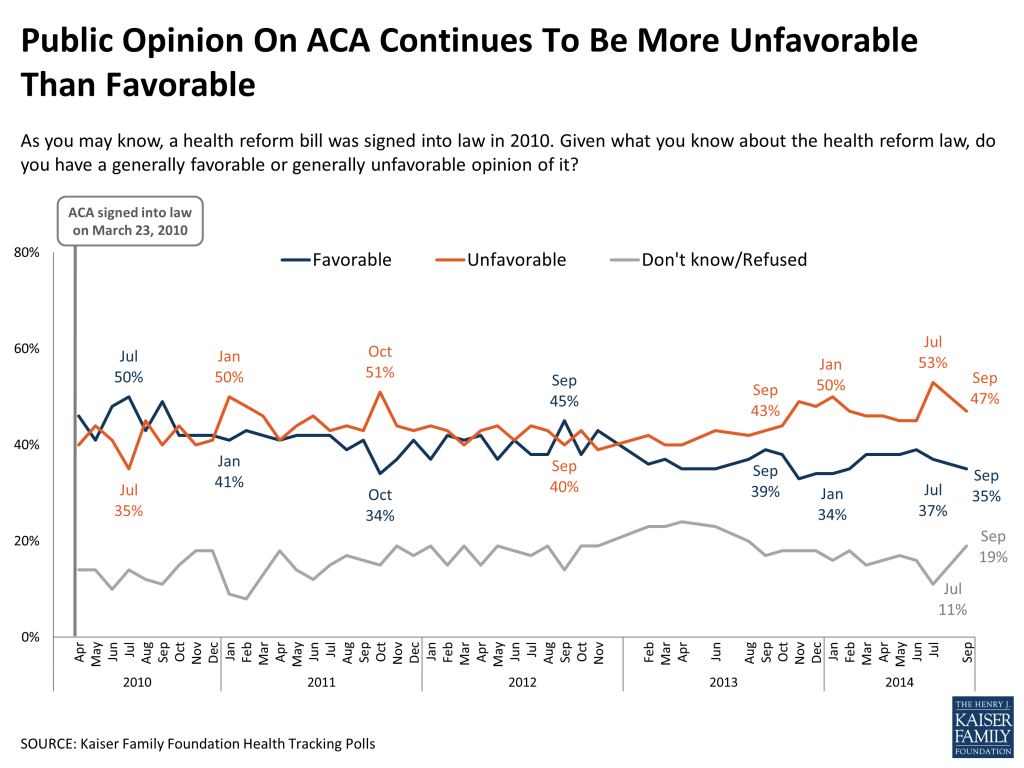
The latest Kaiser Health Tracking Poll finds that public opinion on the Affordable Care Act (ACA) remains more negative than positive, with 47 percent viewing the law unfavorably (closer to levels measured earlier this year after rising to 53 percent in July) and 35 percent having a favorable view. Partisan divisions on the law are as deep as ever, not only when it comes to overall opinion but also in the public’s perception of how the law has impacted their own families and the next steps they want Congress to take.
This poll takes a special look at registered voters’ views of the ACA and what role, if any, the law might be playing in the upcoming midterm election. The survey finds that health care is named as an important voting issue by about one in eight voters, ranking behind the economy and jobs, and clustered with several other issues such as foreign policy and national defense, dissatisfaction with government, immigration, and education. At the same time, the ACA is prominent among the issues voters report hearing about from candidates in their campaigns and advertising. And the messages they are hearing in political advertising are decidedly more anti-ACA than pro-ACA, particularly in states with competitive Senate races. This messaging in advertising may be a reflection of Republican candidates playing to their base, as the survey finds that most Republican voters want candidates to continue talking about the ACA, while most Democrats want them to focus on other issues. Two months out from Election Day, Republicans have a modest edge among the most enthusiastic voters. However, it does not appear that opposition to the ACA is a big driver of that enthusiasm, as these voters are no more likely than others to mention health care as an important factor in their vote.
More Continue to View ACA Unfavorably than Favorably
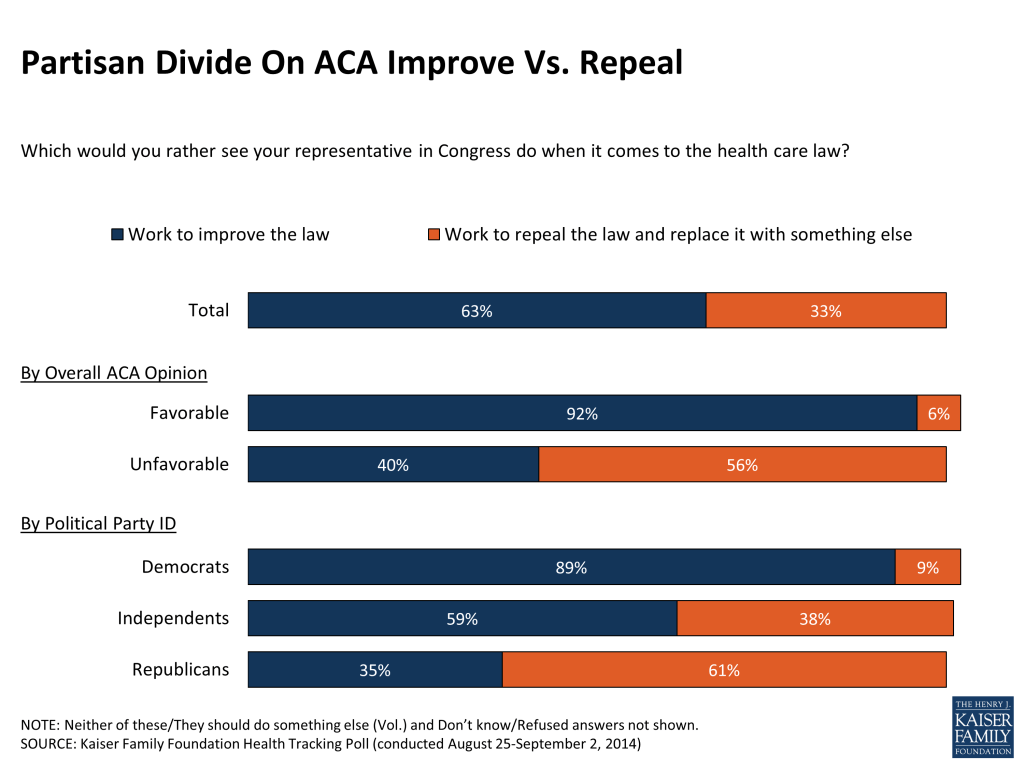
The latest Kaiser Health Tracking Poll finds that the public continues to be more likely to express an unfavorable view of the health care law (47 percent) than a favorable one (35 percent). However, after rising to 53 percent in July, the latest poll finds that the share with an unfavorable view fell back down closer to the shares reported earlier in the year. The share not offering an opinion on the law increased to 19 percent this month, while the share with a favorable view remains similar to previous levels. Even as overall opinion remains more negative than positive, nearly twice as many Americans say they want their Congressional representative to work to improve the law (63 percent) rather than to repeal it and replace it with something else (33 percent).
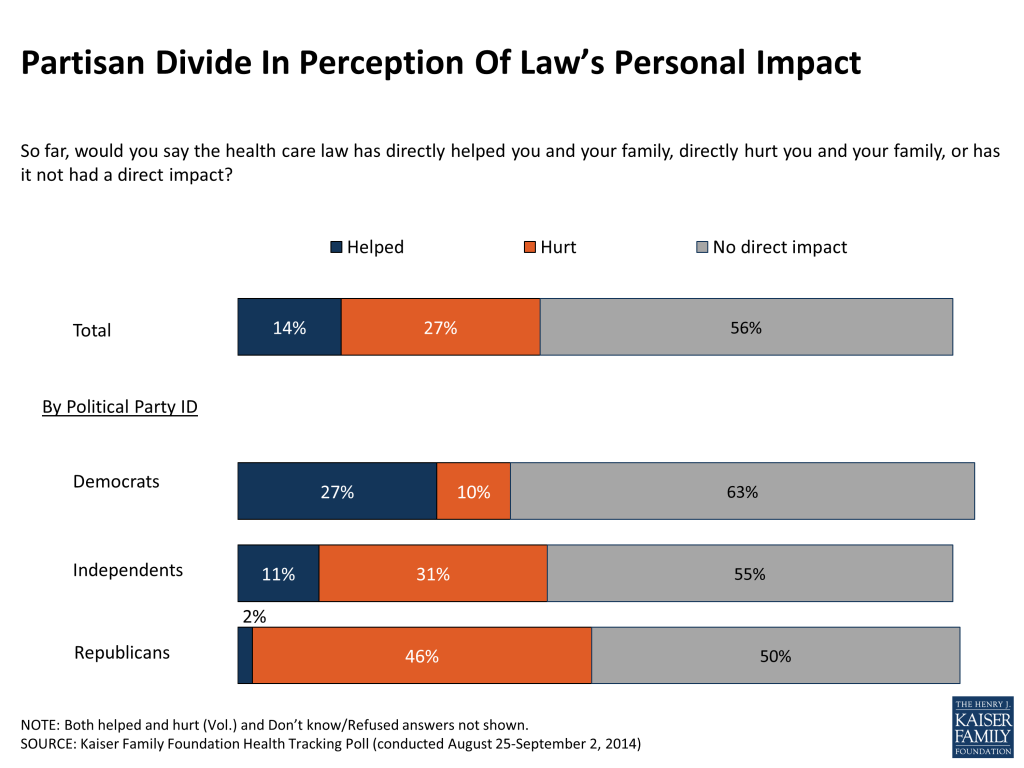
When it comes to personal impact, a majority of the public (56 percent) says the law has not directly impacted them or their families. Of those who say the law has touched them directly, about twice as many report being hurt (27 percent) as report being helped (14 percent). Those who report being hurt by the law mainly say that it has increased the cost of their health care or insurance (16 percent), while those who say the law has helped them mainly say it has allowed someone in their family to get or keep health coverage (6 percent) or made it easier for them to get the health care they need (4 percent).
Party Identification Sharply Divides Opinion Of Health Care Law
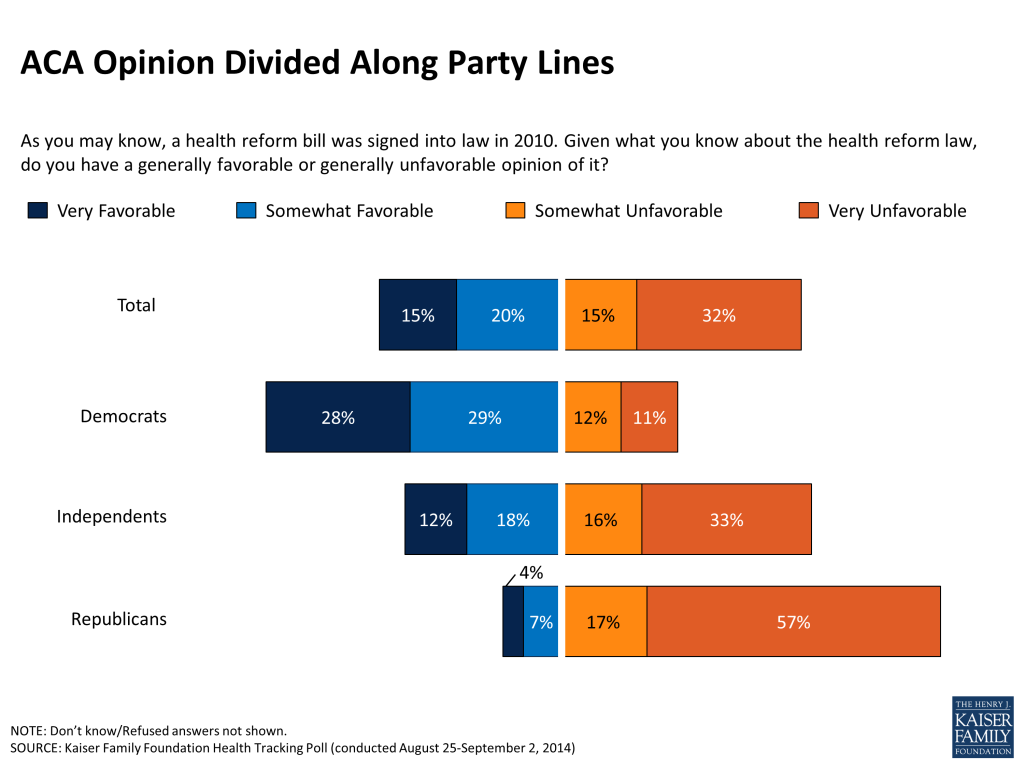
Consistent with previous Kaiser Health Tracking Polls, opinions of the health care law including views overall, impression of personal impact and what Congress should do next are sharply divided along party lines. A majority of Democrats report a favorable opinion of the law (57 percent), while a majority of Republicans report an unfavorable opinion (74 percent), and independents fall in between the two, although more of them have an unfavorable than a favorable view (49 percent versus 30 percent). Intensity in opinion of the law lies with the Republicans, with about twice as many Republicans expressing a “very” unfavorable opinion of the law as Democrats expressing a “very” favorable opinion (57 percent versus 28 percent).
Just as opinion of the law in general is divided along party lines, reported personal impact is as well. Democrats (27 percent) are more likely than independents (11 percent) and Republicans (2 percent) to report that the law has directly helped them. And vice versa, Republicans are more likely to say that the law has directly hurt them (46 percent) than are independents (31 percent) and Democrats (10 percent).
The public’s preferences for next steps with the health care law also differ sharply by party identification, with a large majority of Democrats wanting their representative in Congress to work to improve the law (89 percent), and a majority of Republicans wanting them to work to repeal the law and replace it with something else (61 percent). However, notable shares of both Republicans (35 percent) and those with an unfavorable opinion of the law (40 percent) say that they want their representative to work to improve the law.
Where Does Health Care Rank As A Voting Issue?
This month’s poll takes a special look at registered voters’ views of the ACA and what role, if any, the law might be playing in the upcoming midterm election. Like the public overall, registered voters are more likely to have an unfavorable view of the ACA than a favorable one (49 percent versus 35 percent). Opinion tilts even more negative among likely voters1 (51 percent versus 35 percent).
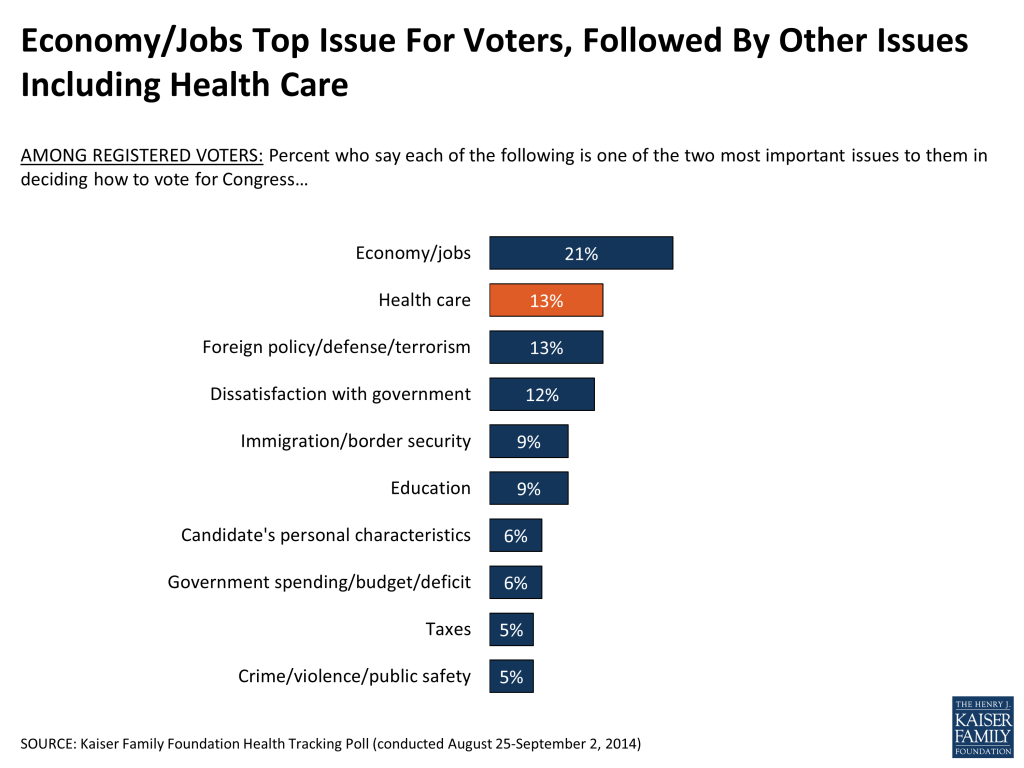
However, health care does not appear to be the dominant issue on voters’ minds when thinking about how to vote in November. Asked to name in their own words the two most important issues in deciding their vote for Congress, the most frequently-mentioned issue is the economy and jobs (21 percent). Thirteen percent of voters name health care as a top issue, including just 3 percent who specifically mention the Affordable Care Act. Those who view the law favorably are about equally likely to mention health care as a top issue in their vote as are those with an unfavorable view (12 percent versus 15 percent).
As a voting issue, health care is clustered with a number of other issues, including foreign policy/national defense/terrorism (13 percent), dissatisfaction with the way government is working (12 percent), immigration and border security (9 percent), and education (9 percent).
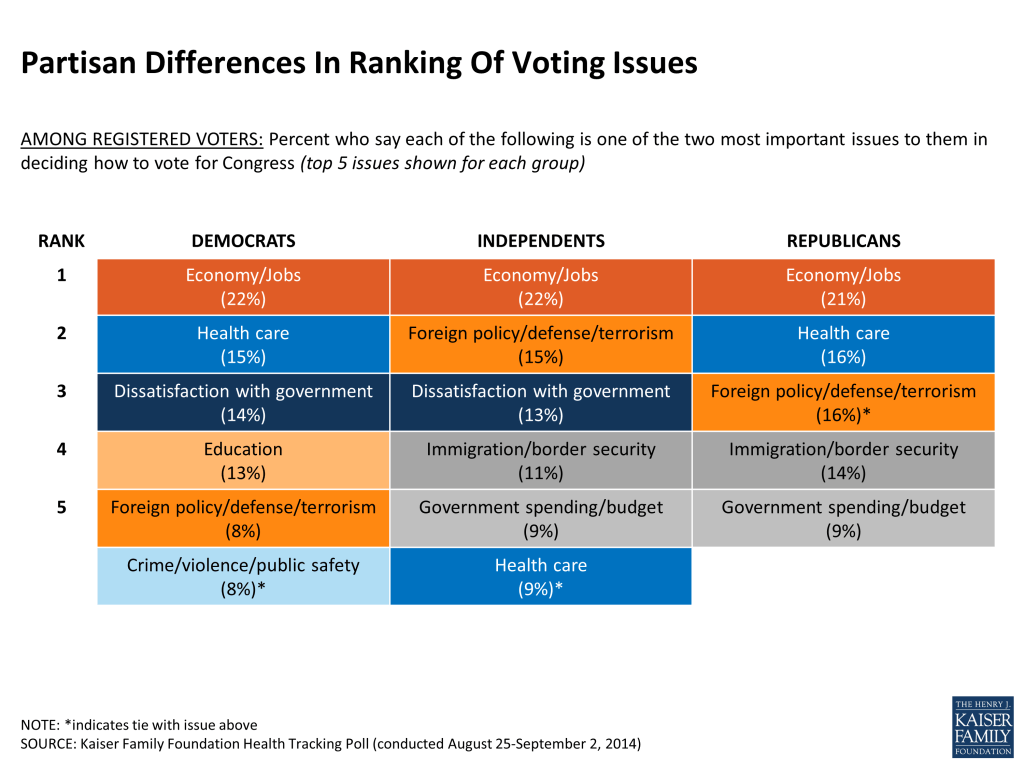
Looking at registered voters by party identification, the economy is the most frequently mentioned voting issue among Democrats, Republicans, and independents alike. While health care ranks second and is mentioned by a similar share of Democrats (15 percent) and Republicans (16 percent), it ranks further down the list and is mentioned by a smaller share of independent voters (9 percent). When Republicans mention health care as a top voting issue, they are more likely to mention the ACA or Obamacare by name (7 percent of Republicans versus 2 percent of Democrats), while Democrats are more apt to name other health care issues or health care more generally.
Other partisan differences are also apparent. For example, foreign policy, immigration, and government spending all receive more mentions among independents and Republicans than among Democrats, while Democrats and independents are more likely than Republicans to name dissatisfaction with government. Two issues make the top five list for Democrats but do not rank as high for other voters: education and crime/public safety.
Issues Are Only One Part Of Voters’ Decisions
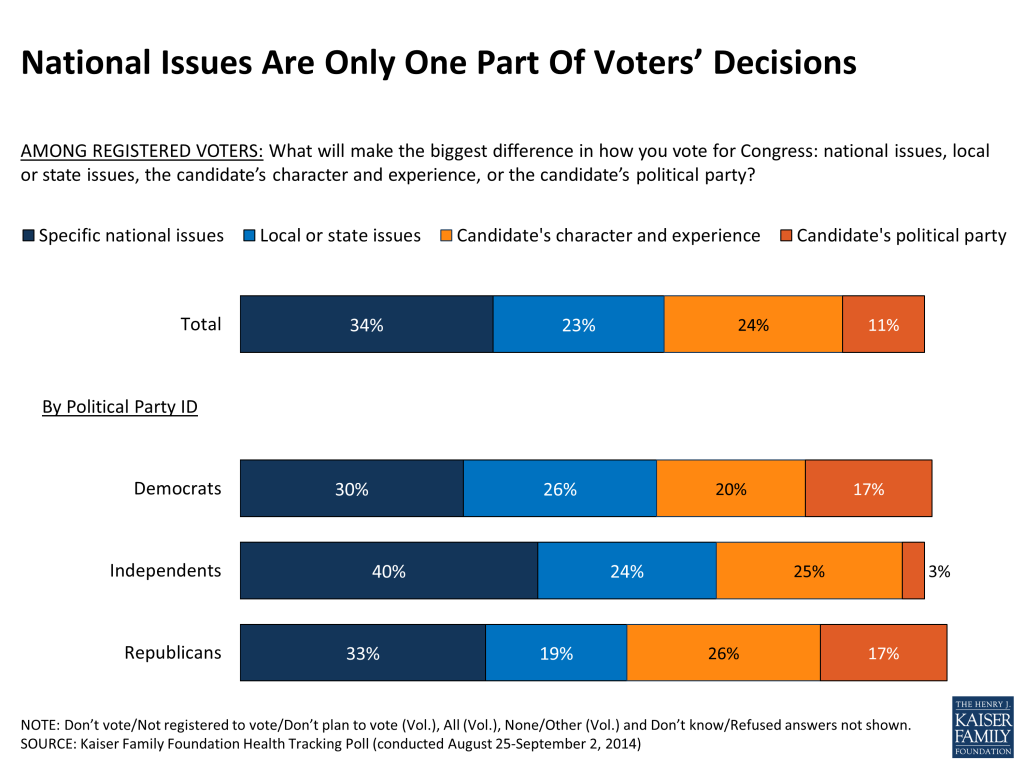
In assessing how the health care law will influence voting decisions, it’s important to keep in mind that national issues like the ACA are only one part of the calculus for voters. While about a third (34 percent) of registered voters say specific national issues will make the biggest difference in how they vote for Congress, about a quarter each say their vote will be mostly based on the candidate’s character and experience (23 percent) or local or state issues (24 percent), and 11 percent say the candidate’s party affiliation will be the most important factor.
Voters Are Hearing Candidates Talk About Jobs, Immigration, And The ACA
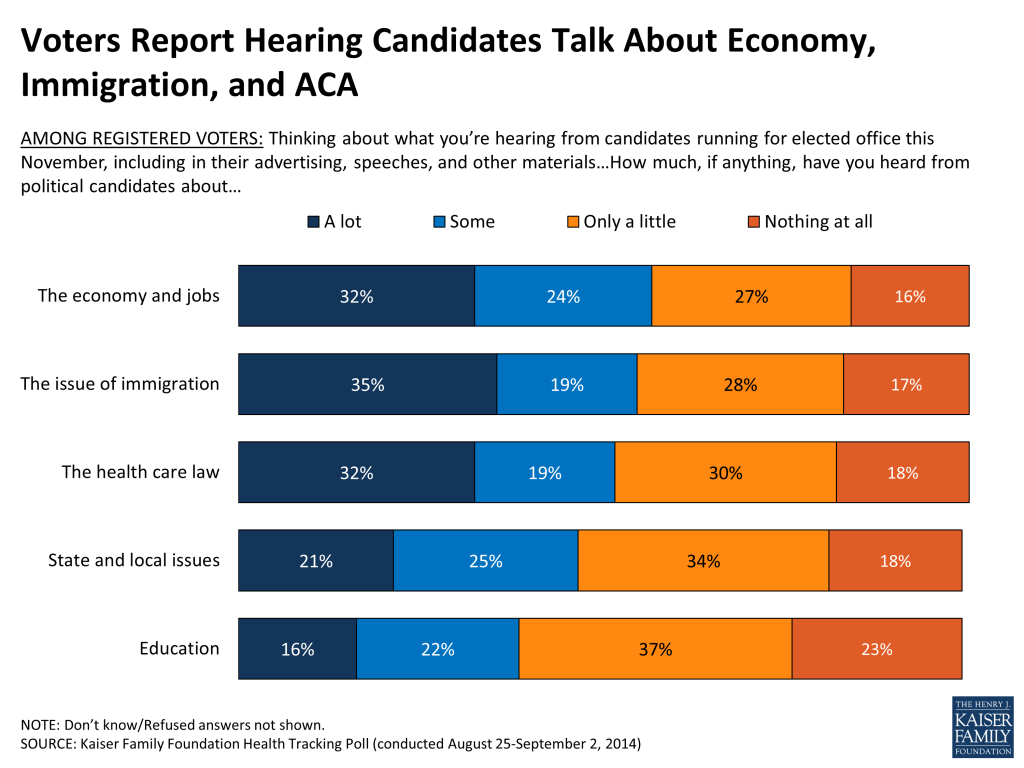
While the ACA may not be top-of-mind for most voters when deciding how to vote, it is prominent among the issues voters report hearing about from candidates. About a third (32 percent) of registered voters say they’ve heard “a lot” from candidates about the health care law, and another one in five (19 percent) say they’ve heard “some” about the issue. Similar shares report hearing from candidates about immigration and the economy, while fewer say they’re hearing from candidates about education or state and local issues.
Voters who identify as Republican are somewhat more likely than Democratic voters to say they’re hearing “a lot” from candidates about immigration (41 percent versus 31 percent) and state and local issues (26 percent versus 17 percent), but for other issues, including the health care law, there is no partisan difference in how much voters report hearing from candidates.
Voters Report Seeing More Anti-ACA Than Pro-ACA Advertising
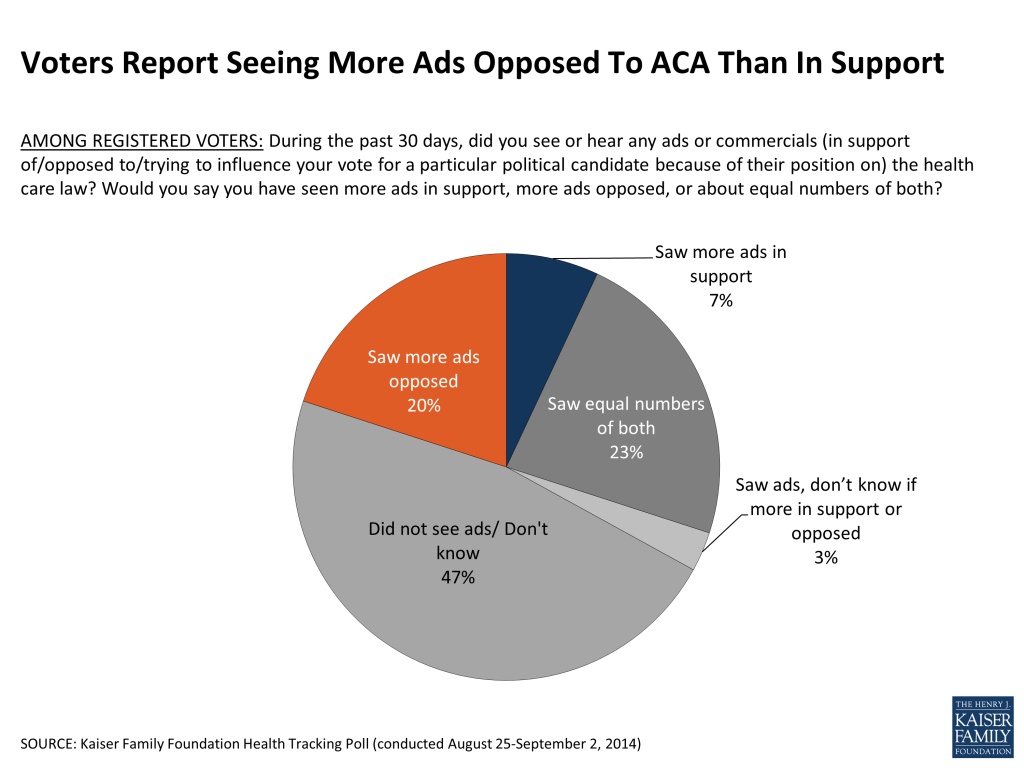
In addition to hearing candidates talk about the ACA, about half of voters (53 percent) report seeing some type of political or issue advertising related to the health care law in the past 30 days, including ads that were opposed to or in support of the law itself, as well as ads that tried to influence their vote for a particular candidate because of their position on the law. Overall, nearly three times as many voters say that most of the ads they saw were opposed to the law (20 percent) as say most of them were in support of the law (7 percent), while just under a quarter (23 percent) say they saw about equal numbers of both.
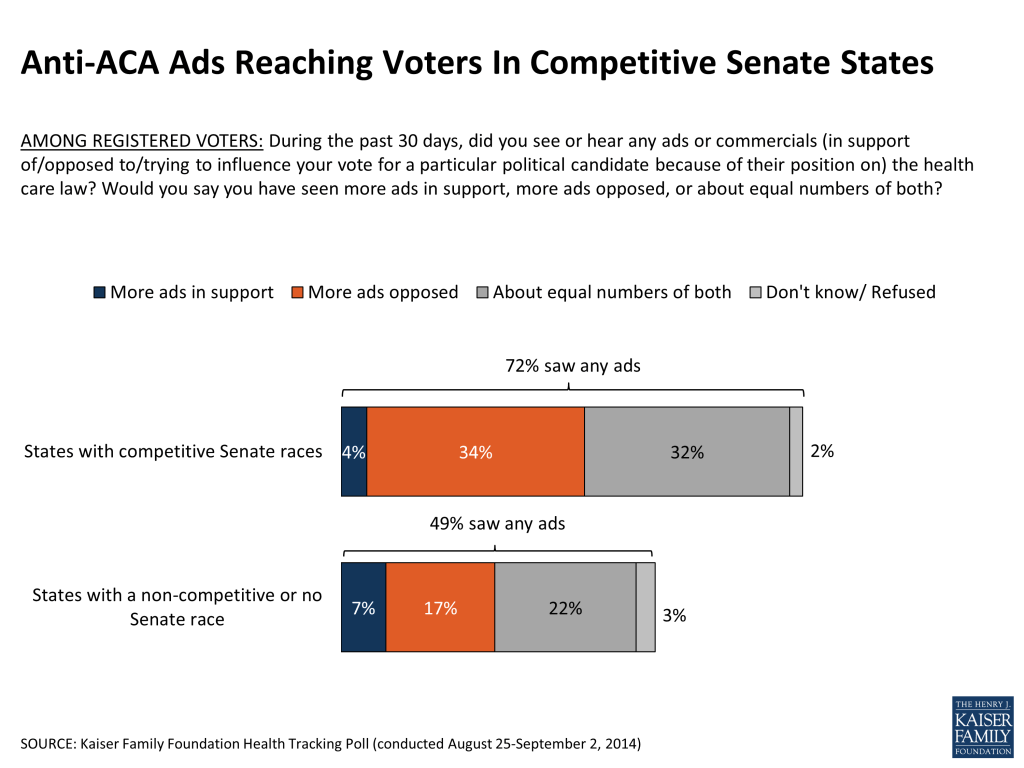
In states with competitive Senate races2 , an even larger share of voters reports seeing ads related to the law (71 percent), and the balance of negative over positive ads is even more lopsided (34 percent say they saw more ads opposed to the law while just 4 percent report seeing more ads in support).
Voters Are Divided On Whether Candidates Should Continue Talking About ACA
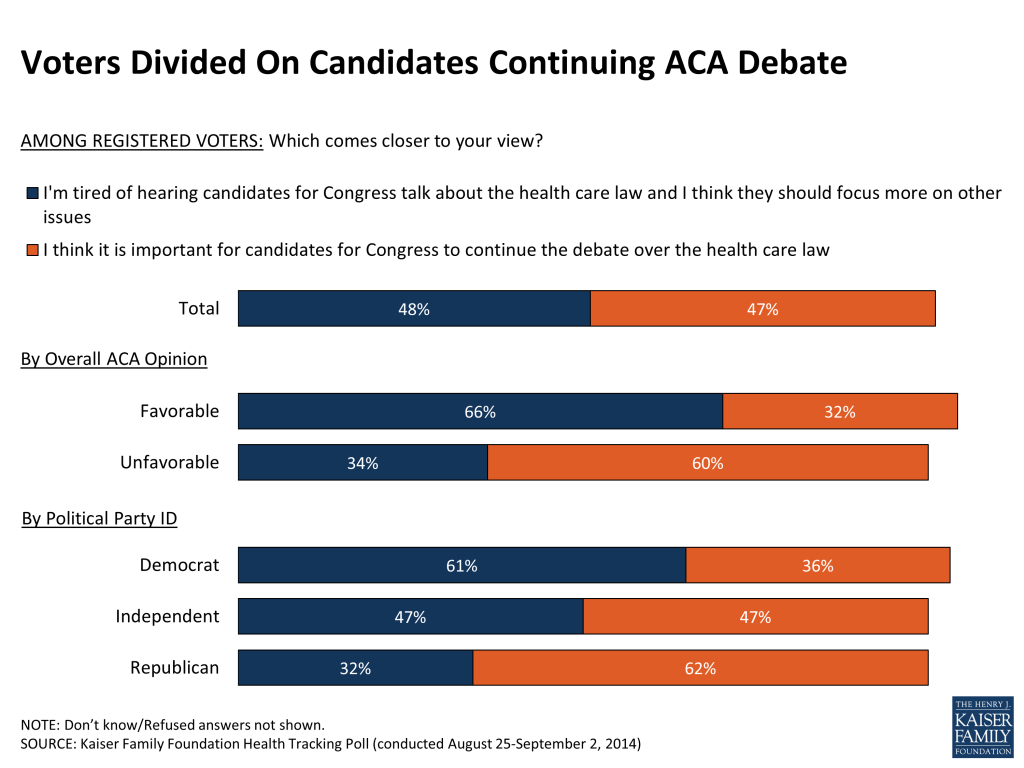
At this point in the campaign, voters are evenly divided on whether they want to hear candidates for Congress continue to talk about the ACA. About half (48 percent) of voters say they are tired of hearing candidates talk about the law and would rather they focus on other issues, while a similar share (47 percent) feel it’s important for candidates to continue the debate. The desire for continued debate is more on the side of the law’s opponents than its supporters; about six in ten Republicans and those with an unfavorable view of the law want candidates to keep up the debate, while similarly large shares of Democrats and those who view the law favorably say they should move on to other issues.
Despite the fact that voters in states with competitive Senate races report seeing more campaign advertising related to the law, they are not more likely than voters in other states to say they are tired of hearing candidates talk about the ACA (49 percent in states with competitive Senate races versus 48 percent in other states).
Republicans Have An Edge Among “Enthusiastic” Voters, But Not Necessarily Because Of ACA
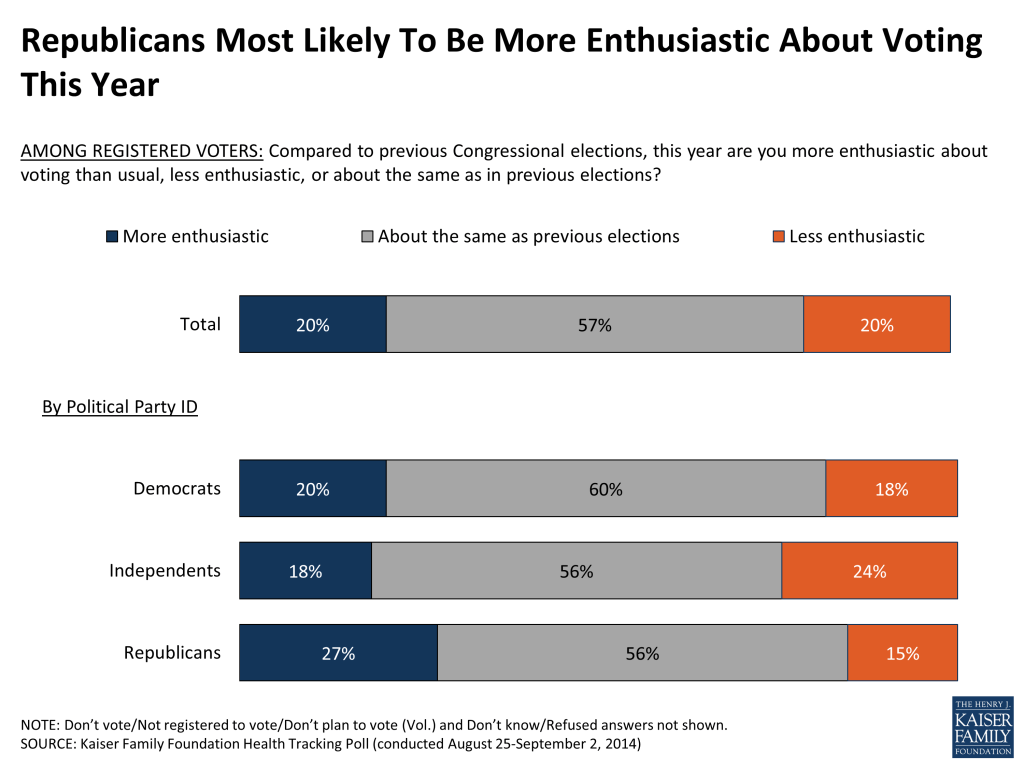
As other polls have shown, Republicans have a modest edge when it comes to voter enthusiasm. While a majority of voters of all political stripes say their enthusiasm about voting this year is “about the same” as in previous Congressional elections, 27 percent of Republicans say they are “more enthusiastic” about voting this year than in the past, compared with 20 percent of Democrats and 18 percent of independents.
Overall, the survey finds that registered voters are fairly evenly divided between those who want to see the Democrats hold on to their majority in the Senate (43 percent) and those who would prefer to see the Republicans gain the majority (40 percent). This narrows to a dead heat among likely voters – 43 percent say they want a Democratic majority and 43 percent want a Republican one. However, Republicans have an edge among those who say they’re more enthusiastic about voting this year; half (50 percent) of these voters say they’d prefer to see the Republicans gain the majority in the Senate and 38 percent say they’d like the Democrats to hold on to their majority.
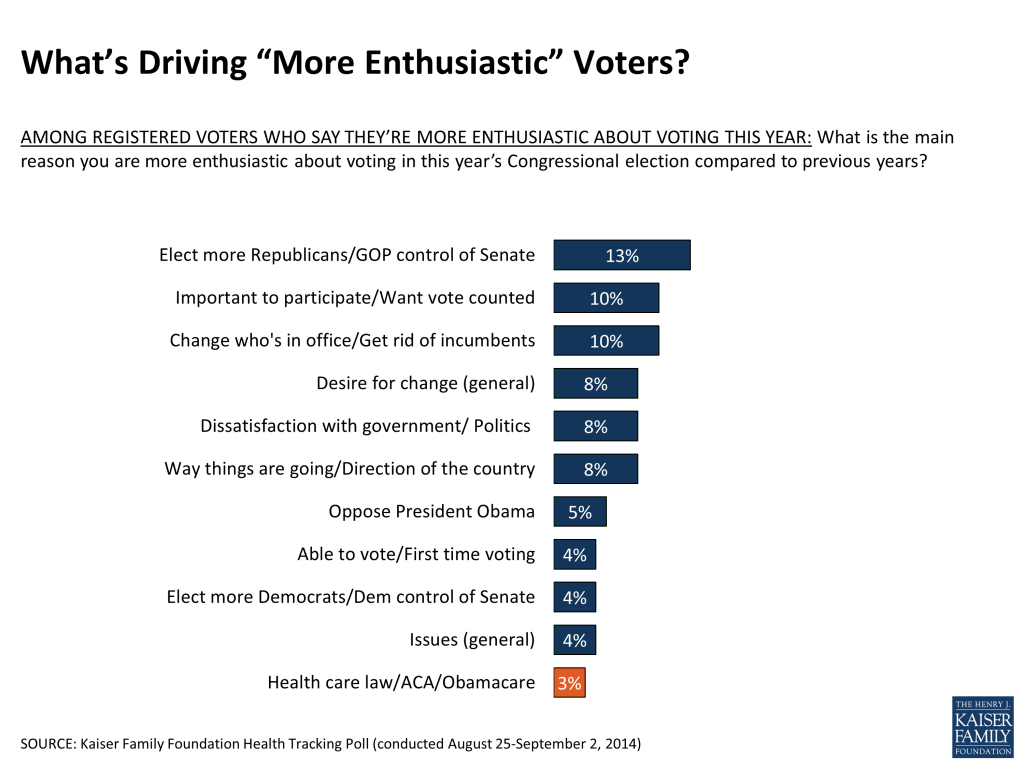
While the “more enthusiastic” voters may give Republicans an edge, opposition to the ACA does not seem to be the dominant factor driving their enthusiasm. These voters are no more likely than other voters to name health care as one of the most important issues in deciding their vote (14 percent name health care – including 6 percent who name the ACA specifically, ranking behind the economy at 21 percent and foreign policy/defense at 16 percent). Further, when asked to say in their own words why they’re more enthusiastic about voting this year, the most common responses relate to a desire to elect more Republicans or help Republicans gain control of the Senate (13 percent), followed by a general sense that participation is important (10 percent), a desire to change who’s in office or get rid of incumbents (10 percent), a general desire for change (8 percent), dissatisfaction with the way government is working (8 percent), and the overall direction of the country (8 percent). Just 3 percent of “more enthusiastic” voters mention the health care law as the main reason for their enthusiasm.
How Do Voters Say A Candidate’s Position On The ACA Will Affect Their Vote?
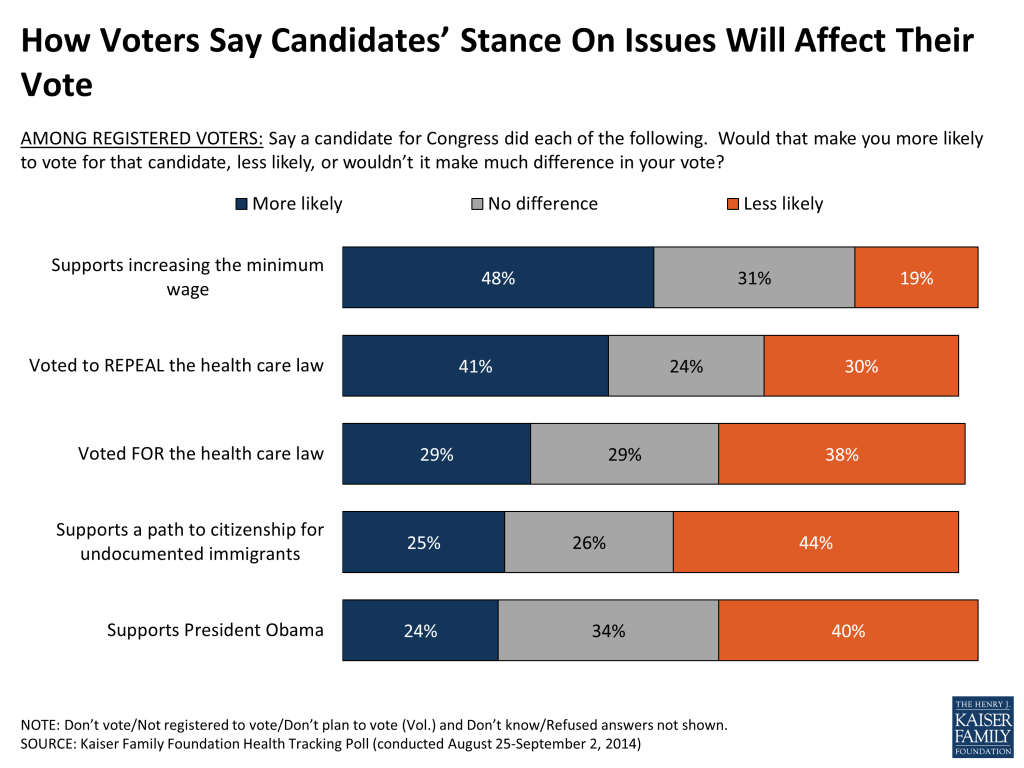
While the ACA may be just one factor in voters’ decisions, many say that a candidate’s position on the law – along with a variety of other issues – would make them more or less likely to vote for that candidate. Almost four in ten (38 percent) say that if a candidate voted for the health care law, they would be less likely to vote for that candidate, while 29 percent say they would be more likely to vote for them. The numbers are almost exactly opposite when it comes to a candidate who voted to repeal the law: 41 percent say they would be more likely to vote for that candidate and 30 percent say they would be less likely to vote for them. To put the ACA in context with other issues, nearly half (48 percent) of voters say they’d be more likely to vote for a candidate who supports increasing the minimum wage, and over four in ten (44 percent) say they’d be less likely to vote for a candidate who supports a path to citizenship for undocumented immigrants.
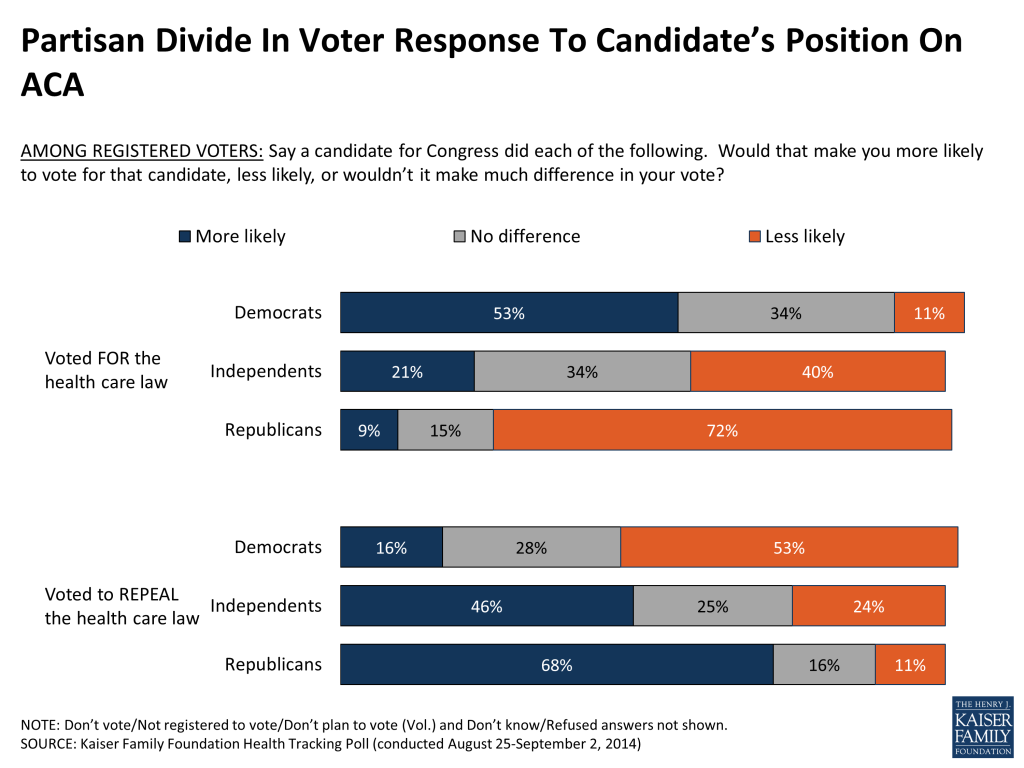
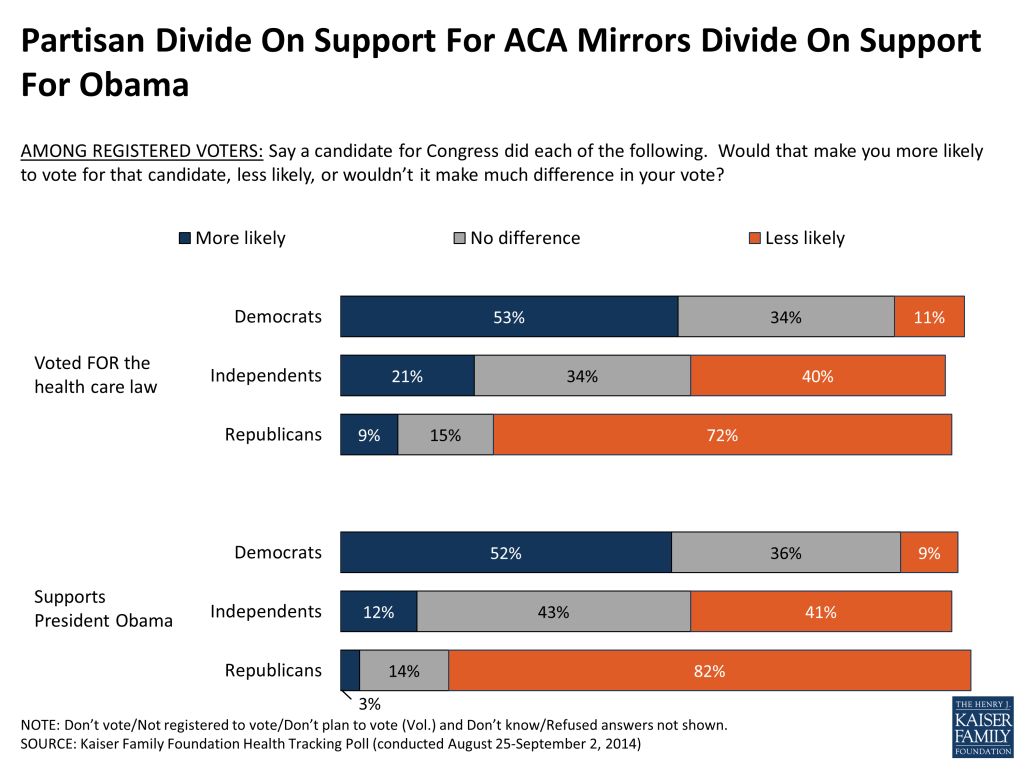
Not surprisingly, voters’ reactions to different candidate positions on the ACA divide sharply on party lines, and once again Republicans appear to have the edge in terms of enthusiasm. Just over half (53 percent) of Democrats say they would be more likely to support a candidate who voted for the ACA, but an even larger share of Republicans (72 percent) say they would be less likely to back such a candidate. Similarly, when asked how they would react to a candidate who voted to repeal the law, 68 percent of Republicans say they would be more likely to vote for them and 53 percent of Democrats say they would be less likely.
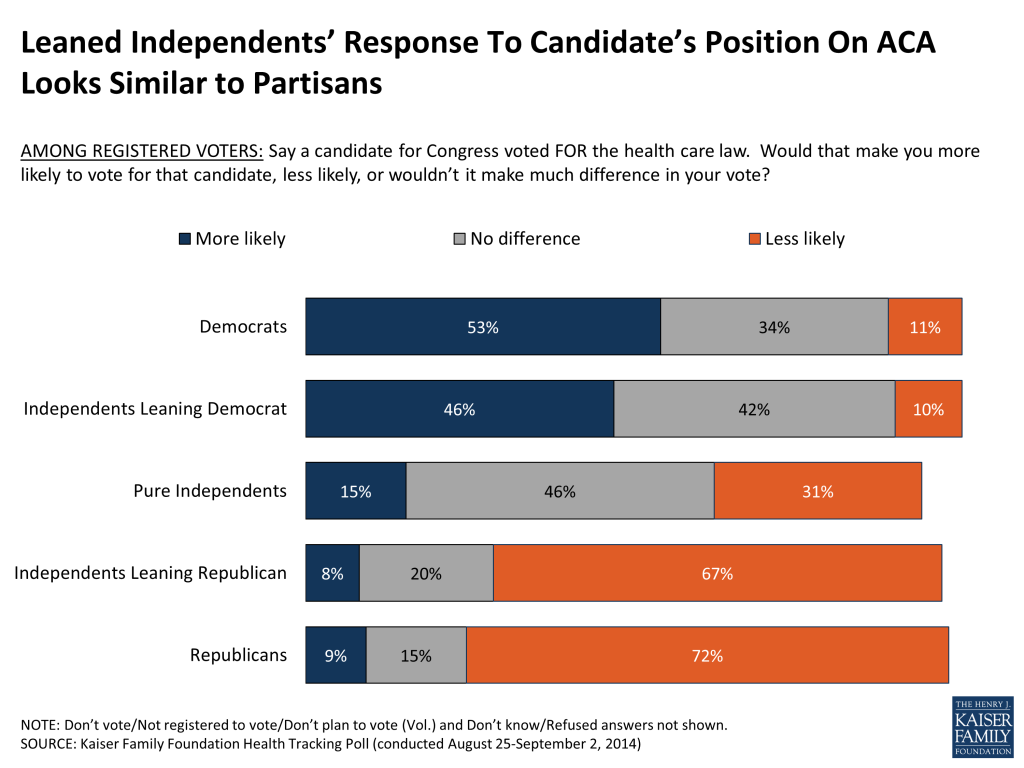
Among independent voters overall, about twice as many say they would be less likely to vote for a candidate who voted for the ACA as say they would be more likely to vote for such a candidate (40 percent versus 21 percent). But as previous Kaiser tracking polls have shown, independents who lean towards one party or another have views that look more like their partisan counterparts. Nearly half (46 percent) of independent voters who lean toward the Democratic party say they would be more likely to support a candidate who voted for the health care law, while two-thirds (67 percent) of Republican-leaning independents say they would be less likely to support such a candidate.
As other polls have shown, voters’ views on the ACA, nicknamed “Obamacare” for the president who championed its passage and signed it into law, often mirror their views on the president himself. And in fact, this survey finds that partisan divisions in voters’ reactions to a candidate who “supports President Obama” are very similar to a candidate who “voted for the health care law.” Just over half (52 percent) of Democratic voters say they’d be more likely to vote for a candidate who supports the president (almost identical to the 53 percent who say the same about a candidate who voted for the ACA), and 82 percent of Republican voters say they’d be less likely to vote for such a candidate (similar to the 72 percent who say they’d be less inclined to back a candidate who voted for the ACA).
This Kaiser Health Tracking Poll was designed and analyzed by public opinion researchers at the Kaiser Family Foundation (KFF). The survey was conducted August 25- September 2, 2014, among a nationally representative random digit dial telephone sample of 1,505 adults ages 18 and older, living in the United States, including Alaska and Hawaii (note: persons without a telephone could not be included in the random selection process). Computer-assisted telephone interviews conducted by landline (753) and cell phone (752, including 424 who had no landline telephone) were carried out in English and Spanish by Princeton Data Source under the direction of Princeton Survey Research Associates International (PSRAI). Both the random digit dial landline and cell phone samples were provided by Survey Sampling International, LLC. For the landline sample, respondents were selected by asking for the youngest adult male or female currently at home based on a random rotation. If no one of that gender was available, interviewers asked to speak with the youngest adult of the opposite gender. For the cell phone sample, interviews were conducted with the adult who answered the phone. KFF paid for all costs associated with the survey.
The combined landline and cell phone sample was weighted to balance the sample demographics to match estimates for the national population using data from the Census Bureau’s 2012 American Community Survey (ACS) on sex, age, education, race, Hispanic origin, nativity (for Hispanics only), and region along with data from the 2010 Census on population density. The sample was also weighted to match current patterns of telephone use using data from the July-December 2013 National Health Interview Survey. The weight takes into account the fact that respondents with both a landline and cell phone have a higher probability of selection in the combined sample and also adjusts for the household size for the landline sample. All statistical tests of significance account for the effect of weighting.
The margin of sampling error including the design effect for the full sample is plus or minus 3 percentage points. Numbers of respondents and margin of sampling error for key subgroups are shown in the table below. For results based on other subgroups, the margin of sampling error may be higher. Sample sizes and margin of sampling errors for other subgroups are available by request. Note that sampling error is only one of many potential sources of error in this or any other public opinion poll.
| Group | N (unweighted) | M.O.S.E. |
| Total | 1,505 | ±3 percentage points |
| Party Identification | ||
| Democrats | 473 | ±5 percentage points |
| Republicans | 368 | ±6 percentage points |
| Independents | 510 | ±5 percentage points |
| Opinion of ACA | ||
| Favorable Opinion of the ACA | 544 | ±5 percentage points |
| Unfavorable Opinion of the ACA | 698 | ±4 percentage points |
| Registered Voters (RV) | 1,239 | ±3 percentage points |
| Likely Voters | 1,056 | ±3 percentage points |
| “More Enthusiastic” Voters | 265 | ±7 percentage points |
| Party Identification (among RV) | ||
| Democrats | 401 | ±6 percentage points |
| Republicans | 329 | ±6 percentage points |
| Independents | 400 | ±6 percentage points |
| Opinion of ACA (among RV) | ||
| Favorable Opinion of the ACA | 457 | ±5 percentage points |
| Unfavorable Opinion of the ACA | 598 | ±5 percentage points |
| Senate Races (among RV) | ||
| States with competitive Senate races | 212 | ±8 percentage points |
| States with a non-competitive or no Senate race | 1,027 | ±4 percentage points |
Endnotes
- Likely voters are defined as those who say they are “absolutely certain” to vote or will “probably” vote in the Congressional election in November. ↩︎
- States with competitive Senate races are those identified by the Cook Political Report ratings as “Toss Up,” “Lean Democrat,” or “Lean Republican as of Sept. 4: AK, AR, CO, GA, IA, KY, LA, MI, NC, NH, and WV (see http://cookpolitical.com/senate/maps). ↩︎