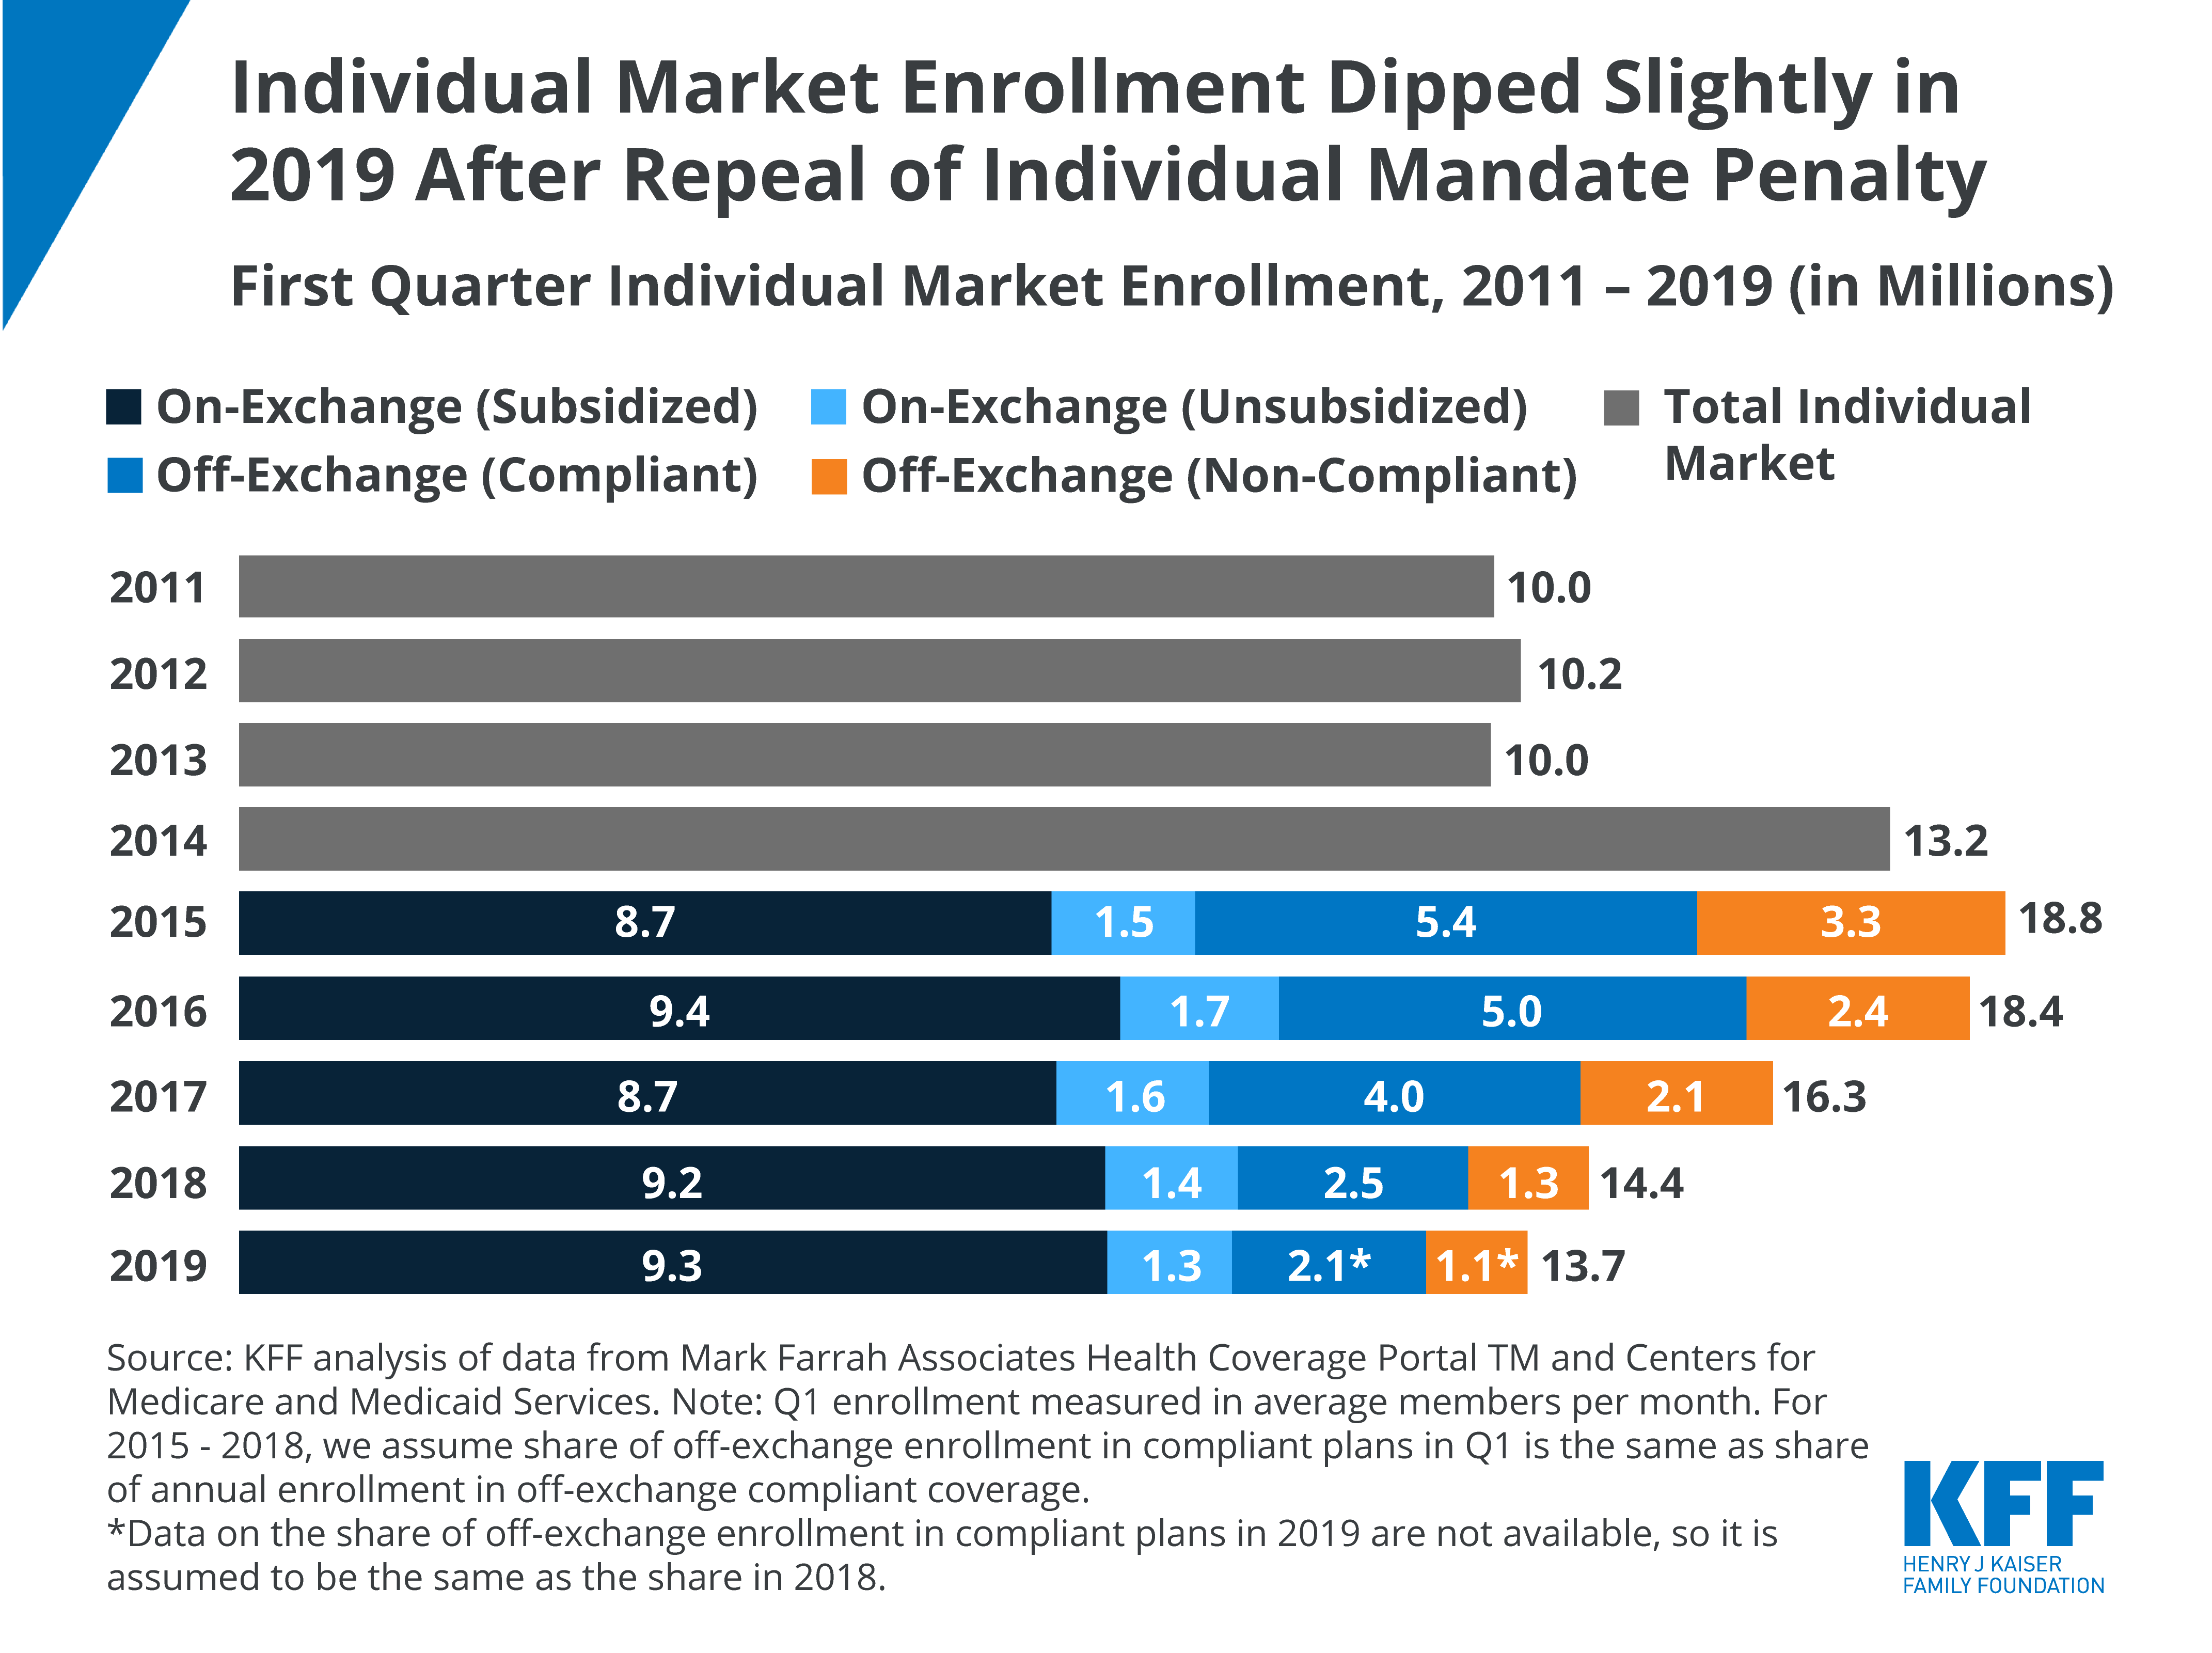
Individual Market Enrollment Ticks Up in Early 2014

Marketplace enrollment has been one of the few measures available thus far to gauge the early success of the Affordable Care Act (ACA) in expanding access to health insurance. The latest figures released by the Department of Health and Human Services put the number of people who have selected a plan on the Marketplace at about 8 million as of the end of the open enrollment period (which extended through mid-April in most states).

But this measure is incomplete. Although it is often referred to as the Marketplace “enrollment” number, we do not know how many of the 8 million have paid their premium and effectuated their coverage.  Also, an unknown number of people selected plans in the individual market outside of the Marketplaces (directly through an insurance company or broker, instead of going through healthcare.gov or their state’s Marketplace) and other enrollees have left the market.

New data became available last week that, while still incomplete, provide information about the growth in individual market insurance coverage during the early part of 2014. Insurers recently submitted filings with insurance regulators (compiled by Mark Farrah Associates), that provide totals of the number of people enrolled in their individual market products.  Because these filings only represent the number of people whose coverage began by March 31, they do not capture new enrollees who signed up toward the end of open enrollment with coverage beginning in April or May. While not complete for a variety of reasons discussed in more detail below, these filings provide some initial indications of how the ACA has affected enrollment in the individual market overall, which includes people purchasing their own coverage both on and off of the exchange Marketplaces.

What this new information shows is that, for individual market insurers with available data, the number of people with coverage in effect at the end of March was about 29 percent higher than at the end of December. (As there was a slight dip in December, comparing March enrollment to the end of September would yield a net increase of 26 percent).  Roughly one fourth of this growth was from new plans, including new insurers and CO-OP plans as well as insurers that had previously operated in other markets or states.  Overall, this suggests that the individual insurance market grew substantially during the first part of 2014, although many questions remain and we will need to wait for the next round of filings to get a more complete picture of overall enrollment, including capturing the late March enrollment surge.

Figure 1: Percent change in enrollment from previous quarter

Figure 1: Percent change in enrollment from previous quarter

There are some challenges with using these initial data to measure the impact of the ACA on enrollment. The first is that several important insurers are not represented in these filings, largely because they have different filing requirements or different deadlines.  Because some sizable insurers that reported in 2013 have not yet filed their 2014 data, the overall totals from the two periods are not comparable.  To address this, we looked only at insurers that submitted first quarter filings, and excluded insurers that only report annually or have not yet submitted their first quarter filings.  The plans included in this analysis represent about two thirds of the overall market and it is possible that the insurers not included saw higher or lower growth rates in their enrollment.

A second limitation is that these filings measure the number of people whose coverage began by March 31,  and therefore are not likely to include enrollees who signed up after mid-February (because their coverage would have taken effect in April or May).  Coverage begins on the first of each month, so generally speaking a person would need to sign up by February 15 for coverage to begin March 1, and therefore be in place at the end of March when enrollment was measured for these filings. Even some earlier applicants may have had later effective dates if they did not pay their initial premium right away.  The majority of marketplace signups occurred after mid-February, which means that these initial filings likely underrepresent the ultimate number of individual market enrollees.  We will need to wait for the second round of 2014 data to get a clearer picture of enrollment as of the end of the open enrollment period.

Given these limitations, a complete count of people purchasing their own coverage is still unavailable.  However, if the insurers that were not included in these initial filings experienced similar growth rates to the insurers with available data, this would yield a net increase of roughly 3 to 3.5 million people for a total of about 15 million people in the individual market with coverage in effect by March, 2014.

As these are aggregate numbers, it is not clear how much of this growth is attributable to Marketplace enrollment. To put this in perspective, between 3.3 and 4.2 million people had signed up for Marketplace coverage by mid-February, but we do not know how many paid their premium in time to begin coverage in March and be included in these filings.

With the surge in enrollment that occurred through the Marketplaces at the end of open enrollment (with plan effective dates in April and May), the number of new enrollees in 2014 could conceivably double when these later enrollment data become available. However, we do not yet know whether off-exchange insurers experienced the same growth, nor do we know whether the people who signed up toward the end of open enrollment paid their premiums at the same rates as earlier enrollees.  Again, we will need to wait until the second round of enrollment data become available later this year.

What makes these initial filings interesting is that they provide our first look at net enrollment: not only counting the people who signed up for coverage through the Marketplace, but also accounting for people signing up off of the exchange, and those who left the market altogether. And what these numbers suggest is that enrollment in the individual market grew rapidly in early 2014, and most likely continued to grow through April and May as many plans took effect in those months.

Methods

This analysis is based on filings that insurers submit to state regulators.  The source of the data was the Health Coverage Portal TM, a market database maintained by Mark Farrah Associates, which includes information from the National Association of Insurance Commissioners and California’s Department of Managed Health Care.  First quarter 2014 data are still preliminary and several insurers have yet to file their first quarter data.  We excluded plans that have not yet filed their first quarter enrollment data and also excluded plans that file on an annual basis (i.e. plans that file as life insurance companies, as well as two plans in New Jersey).  New plans (those that filed for the first time in first quarter 2014, including new companies, new subsidiaries, and existing insurers that previously had operated in other states or markets) were included in the analysis.

The analysis is limited to the 50 states and the District of Columbia, and does not include the territories. Enrollment is measured by the number of covered lives in major medical coverage on March 31, 2014, and does not include specialty coverage.  The percent change in enrollment represents the change in total enrollment of all plans included in the analysis in a given quarter, from the total enrollment of all plans included in the previous quarter.

KFF Headquarters: 185 Berry St., Suite 2000, San Francisco, CA 94107 | Phone 650-854-9400
Washington Offices and Barbara Jordan Conference Center: 1330 G Street, NW, Washington, DC 20005 | Phone 202-347-5270

www.kff.org | Email Alerts: kff.org/email | facebook.com/KFF | twitter.com/kff

The independent source for health policy research, polling, and news, KFF is a nonprofit organization based in San Francisco, California.