Kaiser Health Tracking Poll: October 2015
This month’s Kaiser Health Tracking Poll finds that the affordability of prescription drugs continues to be at the top of the public’s priority list for the President and Congress, with “making sure that high-cost drugs are affordable to those who need them” and “government action to lower prescription drug prices” picked as top priorities by majorities across political parties. Issues specific to the ACA, such as repealing provisions of the law or repealing the law entirely, fall much lower on the list. For example, while the public generally opposes the Cadillac tax, a provision of the health care law that has received a lot of attention recently, relatively few (30 percent) say it should be a top priority.
A large majority of Americans (82 percent) report seeing or hearing prescription drug ads, with about 3 in 10 (28 percent) saying they have talked with a doctor about a specific medicine as a result of an ad. About half of the public (51 percent) say they think that prescription drug advertising is mostly a good thing and many say drug advertisements do a good or excellent job of telling consumers which condition or disease the drug is designed to treat (50 percent), as well as the potential benefits (47 percent) and potential side effects they might experience (44 percent). On the other hand, the public overwhelmingly favors requiring the Food and Drug Administration (FDA) to review prescription drugs advertisements for accuracy and clarity before they can be aired to the public (89 percent), an opinion held by nearly identical shares of Republicans, Democrats, and independents.
The survey also found that health care expenses strain many family budgets – while 55 percent report no problems affording care, saying it is very or somewhat easy to afford, 42 percent say they find it difficult to afford health care, just above expenses like utilities (38 percent), housing (35 percent), food (31 percent) and transportation costs (30 percent). The share reporting a difficult time affording health care increases greatly among the uninsured and those with lower incomes.
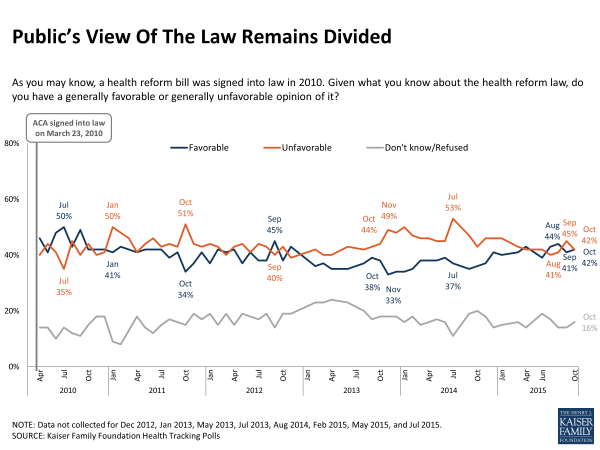
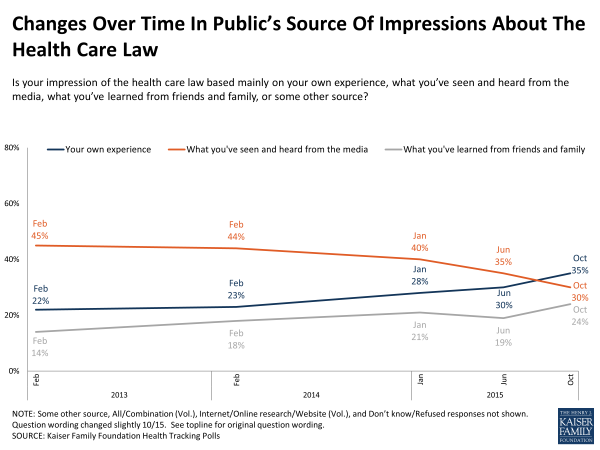
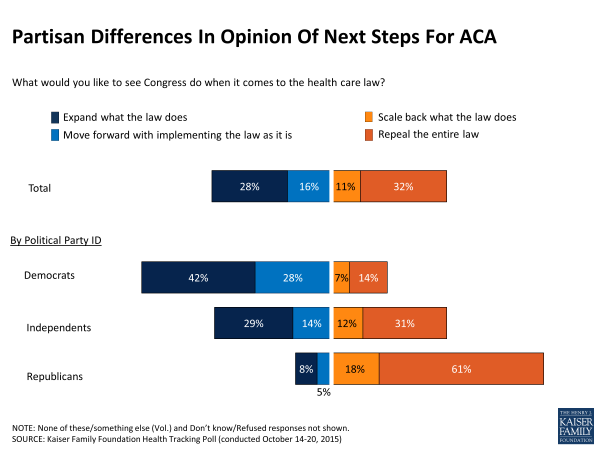
Favorable and unfavorable views of the health care law are tied this month with 42 percent favorable and 42 percent unfavorable. Compared to when most of the law’s provisions were just taking effect in early 2014, more now say their impression of the health care law is based on their own experience (35 percent now, 23 percent in February 2014), while fewer say it is based on what they’ve seen in the media (30 percent now, 44 percent in February 2014). In addition, the public continues to be divided on what Congress should do about the law – 32 percent say repeal, 11 percent say scale back, 16 percent say move forward with implementation, and 28 percent say expand the law.
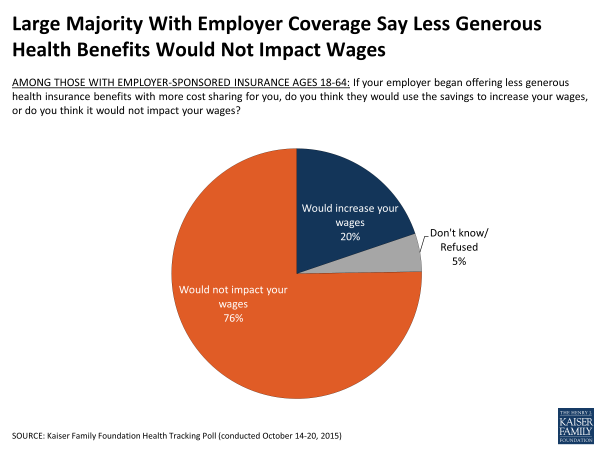
In the context of the debate around the so-called Cadillac Plan Tax on higher cost employer-sponsored plans, three-quarters of those with employer coverage (76 percent) say if their employer began offering less generous health insurance benefits, it would not result in an increase in their wages, while 2 in 10 (20 percent) say they think their wages would increase.
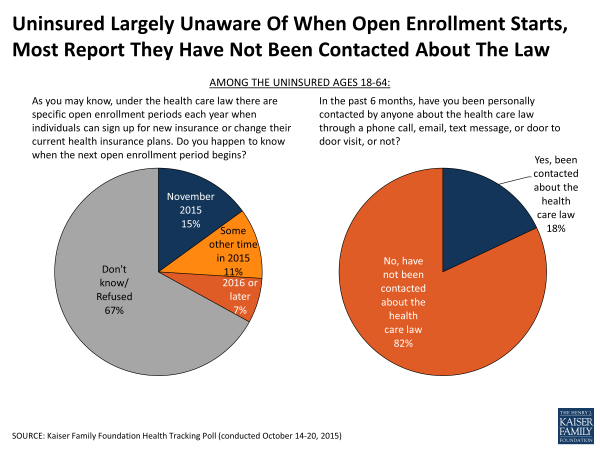
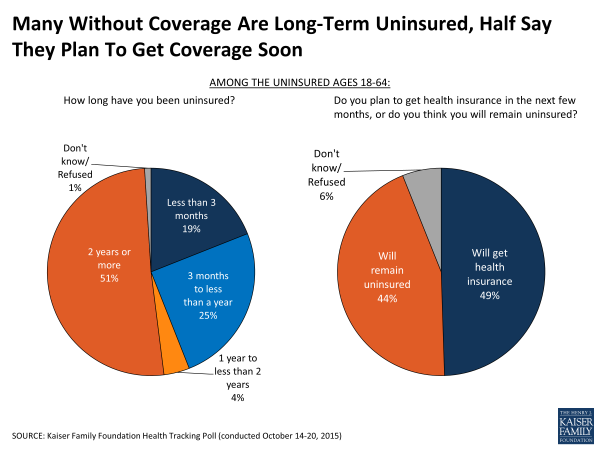
Few uninsured (15 percent) are aware that the third ACA enrollment period begins in November, however many (49 percent) say they expect to get health insurance in the next few months despite the fact that about half (51 percent) say they have been uninsured for 2 years or more.
The Public’s Health Care Priorities
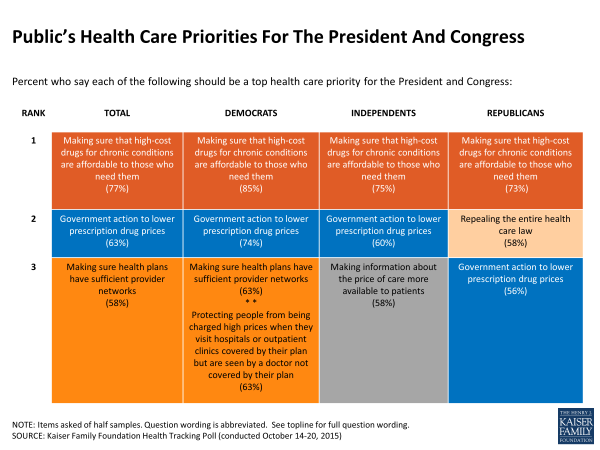
As some Presidential candidates begin releasing details of their health care platforms, the public’s opinion of priorities in health care becomes increasingly relevant. In April, the Kaiser Health Tracking Poll asked the public about which health care issues they thought the President and Congress should prioritize, and this month’s poll revisits that priorities list six months later to see if public opinion has shifted. The public largely prioritizes the same issues they did in April, with the cost of prescription drugs rising to the top. Making sure that high-cost drugs for chronic conditions, such as HIV, hepatitis, mental illness and cancer, are affordable to those who need them is viewed as a top priority by 77 percent of the public and more than 7 in 10 across party lines, and at least half of Democrats, Republicans, and independents say government action to lower prescription drug prices should be a top priority. Additionally, about half or more view provider network protections, increasing price and quality transparency and helping moderate income people pay for high out-of-pocket health care costs as top priorities. Issues specific to the ACA, such as repealing provisions of the law or repealing the law entirely, fall lower on the list and are named as top priorities by fewer Americans. However, repealing the ACA is named as a top priority by nearly 6 in 10 Republicans (58 percent), ranking second as their top priority.
| Table 1: “Top Health Care Priorities” For The President And Congress | ||||
| Percent who say each of the following should be a top health care priority for the President and Congress | Total | Democrats | Independents | Republicans |
| Making sure that high-cost drugs for chronic conditions, such as HIV, hepatitis, mental illness and cancer, are affordable to those who need them | 77% | 85% | 75% | 73% |
| Government action to lower prescription drug prices | 63 | 74 | 60 | 56 |
| Making sure health plans have sufficient provider networks of doctors and hospitals | 58 | 63 | 57 | 55 |
| Making information about the price of doctors’ visits, tests, and procedures such as hip replacements and MRIs more available to patients | 56 | 60 | 58 | 51 |
| Protecting people from being charged high prices when they visit hospitals or outpatient clinics covered by their health plan but are seen by a doctor not covered by their plan | 56 | 63 | 57 | 50 |
| Making information comparing the quality of health care provided by doctors and hospitals more available to patients | 53 | 59 | 52 | 42 |
| Making information about what doctors and hospitals are covered under different health insurance plans more available | 50 | 54 | 50 | 49 |
| Helping people with moderate incomes pay high out-of-pocket costs for medical care | 48 | 62 | 45 | 37 |
| Repealing the requirement that employers with 100 or more workers pay a fine if they don’t offer health insurance | 38 | 47 | 37 | 37 |
| Repealing the requirement that nearly all Americans have health insurance or else pay a fine | 38 | 35 | 37 | 40 |
| Repealing the entire health care law | 37 | 28 | 33 | 58 |
| Eliminating a tax on higher cost employer-sponsored health plans, also called Cadillac plans, that helps pay for the health care law | 30 | 27 | 32 | 34 |
| Reducing the amount of financial assistance available to help people buy health insurance in order to save the government money | 29 | 33 | 27 | 31 |
| Note: Items asked of half samples. | ||||
Prescription Drug Regulation And Advertising
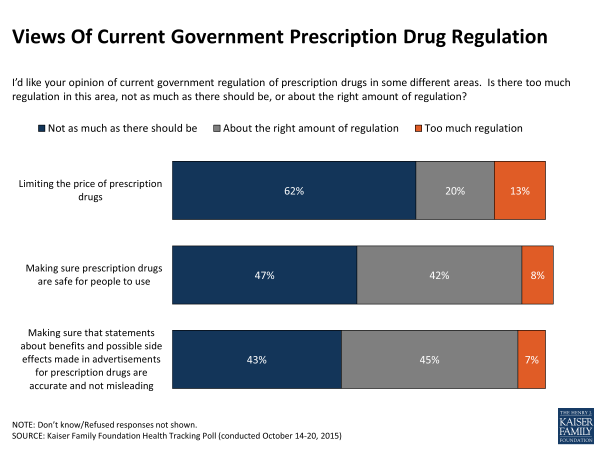
Not surprisingly, given the public’s desire for improved affordability of prescription drugs, many (62 percent) say there is not as much regulation as there should be limiting the price of prescription drugs. Much smaller shares say there is about the right amount of regulation (20 percent) or too much regulation (13 percent).
The public is more divided about the amount of regulation ensuring the safety of drugs and overseeing claims made in drug advertisements. About half (47 percent) say that there is not as much regulation as there should be making sure prescription drugs are safe for people to use, while about 4 in 10 (42 percent) say there is about the right amount and just 8 percent say there is too much regulation. Similarly, 43 percent say there is not as much government regulation as there should be making sure that statements about benefits and possible side effects made in advertisements for prescription drugs are accurate and not misleading, while 45 percent say there is about the right amount and 7 percent say there is too much.
Partisans differ in their opinion of whether current government regulation of prescription drugs is adequate. Democrats are more likely than Republicans to say there is not as much regulation as there should be across the various aspects asked about in the survey, while Republicans are more likely than Democrats to say there is about the right amount.
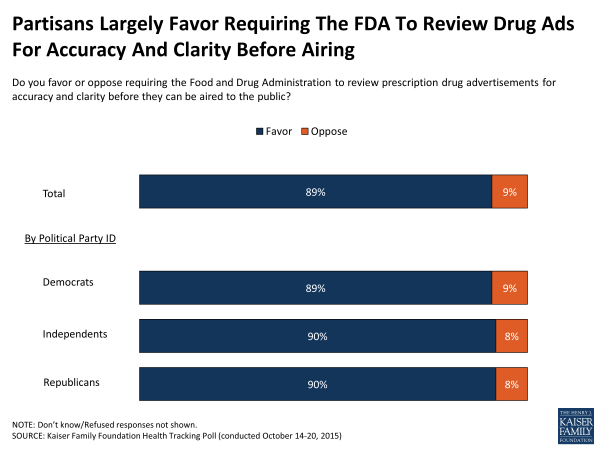
While the public is divided on whether there is about the right amount of regulation or not enough, an overwhelming majority (89 percent) say they favor requiring the Food and Drug Administration (FDA) to review prescription drug advertisements for accuracy and clarity before they can be aired to the public, something the FDA currently does not do.1 This opinion is held by nearly identical shares of Republicans, Democrats, and independents.
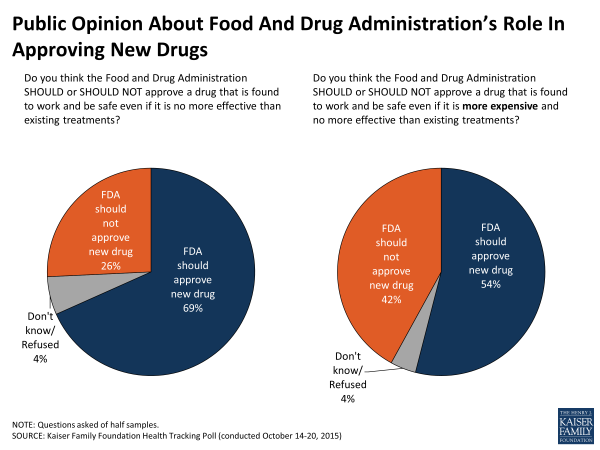
When asked whether the FDA should approve a drug that is found to work and be safe although it is no more effective than existing treatments, about 7 in 10 (69 percent) say it should be approved. However, when cost is added to the equation and the new, hypothetical drug is said to be both more expensive and no more effective than existing treatments, the share saying the FDA should approve it drops to 54 percent.
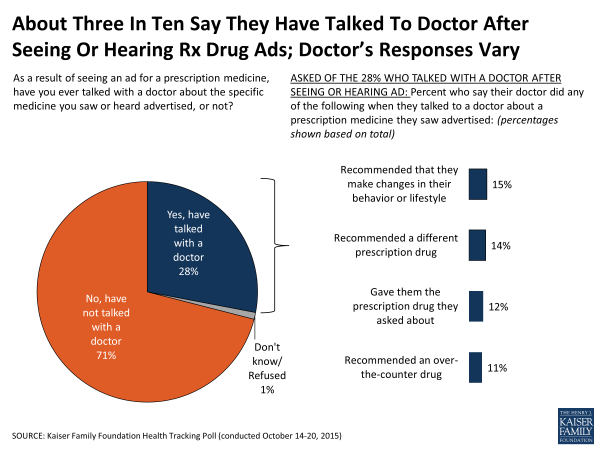
A large majority of Americans (82 percent) report seeing or hearing prescription drug advertisements, and 3 in 10 (28 percent) say they have talked with a doctor about the specific medicine they saw advertised. After talking to a doctor about a drug they saw, 15 percent of the public says the doctor recommended changes in their behavior or lifestyle, 14 percent say the doctor recommended a different prescription drug, 12 percent say they were given the drug they asked about, and 11 percent were instead recommended an over-the-counter option.
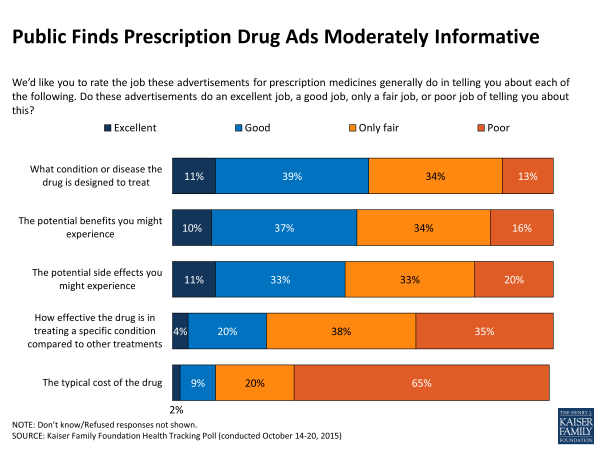
About half of the public (51 percent) say they think that prescription drug advertising is mostly a good thing, while 4 in 10 (39 percent) say the opposite. Regardless of whether they think drug advertisements are good or bad, the public seems to find them only moderately informative. Half (50 percent) say drug advertisements do a good or excellent job of telling consumers which condition or disease the drug is designed to treat. Over 4 in 10 say the advertisements do at least a good job telling consumers about the potential benefits (47 percent) and potential side effects they might experience (44 percent). About a quarter (24 percent) say the advertisements do at least a good job of informing consumers of how effective the drug is in treating a specific condition compared to other treatments. Just 11 percent say the ads are good or excellent at informing the public of the typical cost of the drug, while 20 percent say they do a fair job and a majority (65 percent) say they do a poor job.
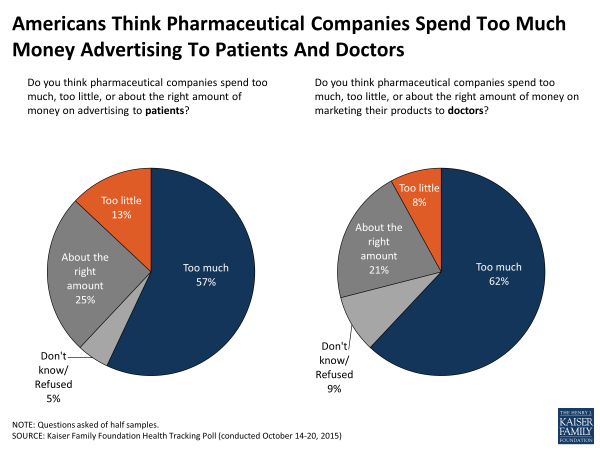
The public also believes that pharmaceutical companies spend too much money advertising to patients and doctors. About 6 in 10 (57 percent) say that pharmaceutical companies spend too much advertising to patients, 13 percent say too little and a quarter (25 percent) say the right amount. Nearly identical shares say the same about money spent marketing to doctors; 62 percent say they spend too much, 8 percent say too little, and 21 percent say about the right amount.
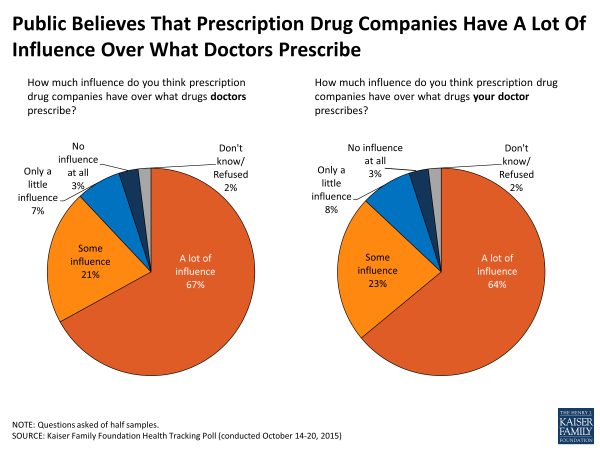
And, according to the public, pharmaceutical companies have quite a bit of influence over what doctors prescribe their patients – nearly 9 in 10 (88 percent) say they think they have at least some influence, including 67 percent who say they have a lot of influence. When asked specifically how much influence drug companies have over what their own doctor prescribes, similarly large shares say the pharmaceutical companies have considerable influence (64 percent say a lot and 23 percent say they have some influence).
Health Care And Family Budgets
When asked about how easy or difficult it is to afford different basic elements of most family budgets, many say affording things like food, gas, housing, and health care are at least somewhat easy, however 42 percent of the public says it is difficult to afford health care, followed by monthly utilities (38 percent), housing costs (35 percent), food (31 percent) and gas or other transportation costs (30 percent). There are stark differences by insurance status and income. Within each income bracket, individuals report difficulty affording various pocketbook expenses at roughly similar rates, those with higher incomes report less difficulty affording the expenses and those with lower incomes report more difficultly; however health care tops the list across all income brackets.
| Table 2: Ranking Of Pocketbook Costs | ||||||
| Percent who say it is very or somewhat difficult to afford each of the following | Total | By Insurance Status (Ages 18-64) | By Annual Household Income | |||
| Insured | Uninsured | Less than $40,000 | $40,000-$89,999 | $90,000 or more | ||
| Health care | 42% | 38% | 81% | 56% | 41% | 16% |
| Monthly utilities, like electricity, heat, and phone | 38 | 36 | 63 | 54 | 35 | 9 |
| Rent or mortgage | 35 | 34 | 63 | 50 | 32 | 12 |
| Food | 31 | 29 | 52 | 48 | 25 | 7 |
| Gas or other transportation costs | 30 | 29 | 46 | 44 | 24 | 7 |
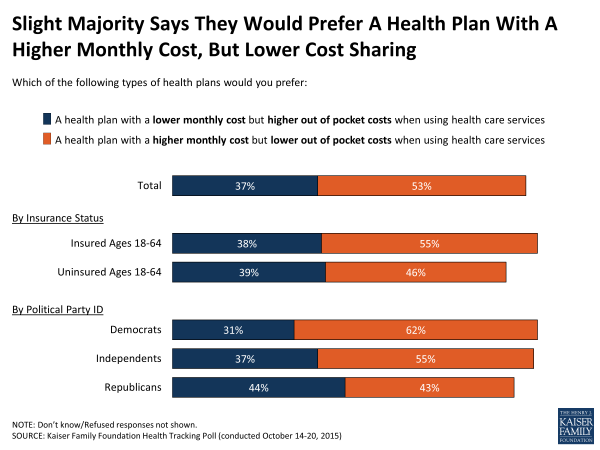
A slim majority (53 percent) of the public says, if given the choice, they would prefer a health plan with a higher monthly cost but lower out of pocket costs when using health care services, and just under 4 in 10 (37 percent) say they would prefer a plan with a lower monthly cost, but higher out of pocket cost sharing. These shares are similar across insurance status. Democrats (62 percent) and independents (55 percent) are more likely than Republicans (43 percent) to say they prefer a higher cost plan with lower cost sharing.
Views Of The ACA On The Eve Of Open Enrollment
Opinion Of The Law
In October, equal shares of the public report favorable and unfavorable views of the health care law (42 percent each). This even divide masks a persistent underlying partisan split in views of the law. This month, 63 percent of Democrats say they have a favorable view of the law, while 79 percent of Republicans say they have an unfavorable view. Independents are about evenly split with 41 percent reporting a favorable view and 43 percent unfavorable.
Source Of Public’s Impressions Of The Law
The public reports their impressions of the law come from a number of different sources, including 35 percent who say it is based on their own experience, 30 percent who say it’s based on what they’ve heard and seen from the media, and 24 percent who say it’s based on what they have learned from friends and family. Since most of the major provisions of the health care law went into effect in winter of 2014, the share saying their opinion of the law is based on their own experiences has increased from 23 percent in February 2014 to 35 percent this month, while the share saying it is based on what they’ve seen or heard from the media has declined, from over 4 in 10 (44 percent) in 2014 to 30 percent now.
Repeal Or Expand, Or Something In Between?
As has been the case for many months, the public does not converge around what Congress should do when it comes to the health care law. About 3 in 10 (32 percent) would like to see Congress repeal the entire law and 11 percent want to see it scaled back, while 16 percent would like to see implementation continue, and another 28 percent want to see the law expanded. As with views of the laws overall, views of what Congress should do vary widely by party.
One change to the ACA that Congress has been considering recently is repealing an upcoming tax on more expensive employer-sponsored health plans, which some have called the Cadillac Plan Tax. Some say this would result in employees being paid higher wages as employers would lower their health benefits in order to avoid the tax and pass the subsequent savings on to their employees. Those getting coverage through an employer largely believe that if their employer began offering less generous health insurance benefits, the change would not result in increases to their wages (76 percent), while 2 in 10 (20 percent) think their wages would increase.
Public Divided On Whether To Continue Debate Of ACA
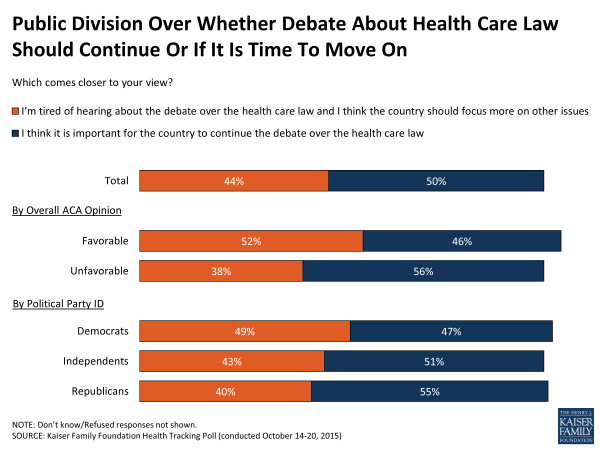
As the political debate about the future of the health care law continues in Congress and on the campaign trail, the public is fairly divided on whether this debate should continue or if it’s time to move on to other issues. Half (50 percent) say it is important for the country to continue the debate over the health care law while 44 percent say they are tired of hearing debate about the ACA and think the country should focus more on other issues. Democrats and independents are divided as to whether they want debate to continue or if it’s time to move on, whereas Republicans are more likely to say debate should continue rather than say it’s time for the country to focus more on other issues (55 percent vs. 40 percent).
Awareness Of Upcoming Open Enrollment Period
The third open enrollment period under the ACA starts November 1st, but at this point, relatively small shares of the public overall (17 percent) as well as the uninsured (15 percent), are aware of when open enrollment starts. In addition, about 2 in 10 uninsured (18 percent) say they have been personally contacted about the health care law in the past six months.
Currently Uninsured Likely Harder To Reach, Many Plan to Get Covered
As more people gain coverage through the Affordable Care Act and other sources, those who remain uninsured become a more difficult to reach group. About half of the uninsured (51 percent) say they have been uninsured for 2 years or more. While many have been without coverage for some time, about half of the uninsured (49 percent) say they plan to get coverage in the next few months, whereas 44 percent of the uninsured expect to remain uninsured.
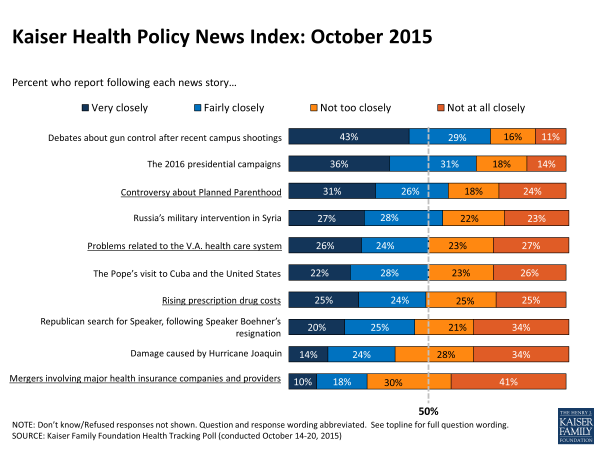
Kaiser Health Policy News Index: October 2015
The Kaiser Health Policy News Index is designed to help journalists and policymakers understand which health policy-related news stories Americans are paying attention to, and what the public understands about health policy issues covered in the news.
In the wake of a shootings on college campuses in Oregon and Arizona, 72 percent of the public says they have been following debates about gun control after these recent campus shootings ‘very’ or ‘fairly’ closely. And, as has been the case in recent months, a sizeable majority (67 percent) report following the presidential campaigns. Closer to half report following other national and international news stories such as the controversy around Planned Parenthood (57 percent), Russia’s military intervention in Syria (55 percent), the Pope’s visit to Cuba and the United States (50 percent), and the Republican search for a New Speaker of the House after Speaker Boehner’s resignation (45 percent). About half also report following two health policy related stories – news about problems with the Veterans Affairs health care system (50 percent) and the rising cost of prescription drugs (49 percent). Closer to 4 in 10 (38 percent) say they have followed coverage of damage caused by Hurricane Joaquin on the east coast. Lowest on the list of this month’s news items is coverage about health insurer and provider group mergers (28 percent).
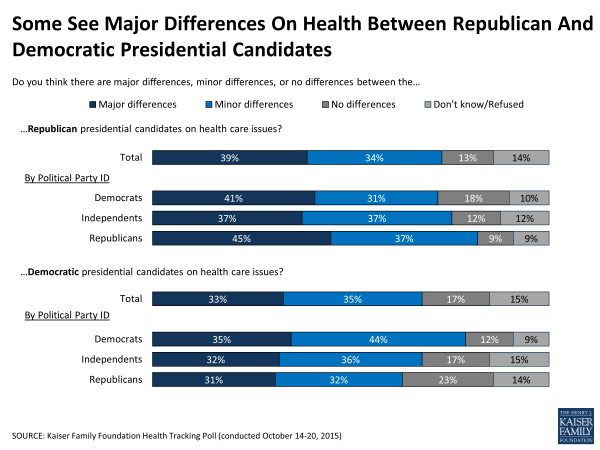
Differences In Presidential Candidates On Health
While two-thirds of the public say they are following the presidential campaigns at this point in the race, opinions are varied on whether there are major, minor or no differences on health care issues between the candidates for each party. When asked about differences among Republican candidates on health, about 7 in 10 (73 percent) of the public say there are differences, including 39 percent who say there are major differences, while just 13 percent say there are no differences. Similarly, when asked about Democratic candidates, nearly 7 in 10 (68 percent) say there are differences, including a third (33 percent) who say major differences, while 17 percent say there are no differences. Partisans are less likely to see differences among candidates of the party opposite their own – Democrats are more likely than Republicans to say there are no differences between the Republican candidates (18 percent vs. 9 percent), and Republicans are more likely than Democrats to say there are no differences between the Democratic candidates (23 percent vs. 12 percent). For both questions, those who say they are following news about the presidential election are more likely than those not following the races as closely to say there are differences between the candidates on health care issues (Republican candidates: 77 percent vs. 64 percent; Democratic candidates: 73 percent vs. 57 percent).

