Health Coverage by Race and Ethnicity: The Potential Impact of the Affordable Care Act
Executive Summary
One of the key goals of the Affordable Care Act (ACA) is to reduce the number of uninsured through a Medicaid expansion and the creation of health insurance exchange marketplaces with advance premium tax credits to help moderate-income individuals pay for this coverage. Given that people of color are at disproportionate risk of being uninsured and having low incomes, the ACA coverage expansions could particularly benefit communities of color and advance efforts to eliminate disparities. This brief provides an overview of health coverage by race and ethnicity today to provide greater insight into the potential impacts of the ACA coverage expansions for people of color. It finds the following:
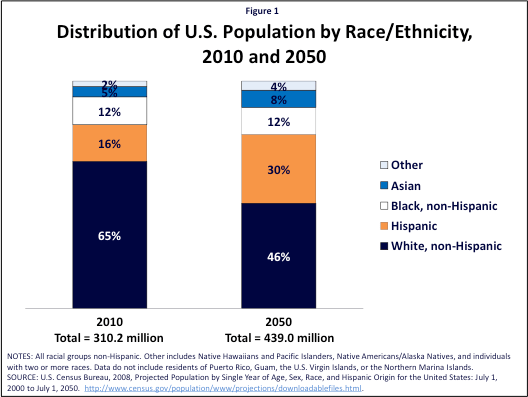
People of color account for a significant share of the U.S. population today and are projected to make up the majority of the population by 2050. There is significant diversity among communities of color, reflecting varied cultural backgrounds, immigration statuses, and languages. While the majority of people of color have a full-time worker in the family, they are more likely to be in low-income, low-wage jobs that provide limited access to employer-sponsored health insurance.
Reflecting their limited incomes and lack of access to employer-sponsored health insurance, people of color are more likely to be uninsured compared to Whites. State expansions in Medicaid and CHIP eligibility for children offset a significant share of the gap in private coverage between Hispanic, Black, American Indian/Alaska Native, and White children. In contrast, Medicaid eligibility for parents and other adults remains more limited. As such, a smaller share of the gap in private coverage is filled for adults in these groups, leaving them with significantly higher uninsured rates compared to Whites.
The ACA coverage expansions have the potential to significantly increase coverage for people of color and reduce disparities in coverage. Over half of the currently uninsured are people of color, most of whom are adults. The large majority of uninsured individuals have incomes in the range that would qualify for the ACA Medicaid expansion or premium tax credits for exchange coverage.
People of color have particularly high stakes in state decisions to implement the ACA Medicaid expansion. Over half of uninsured Hispanics and nearly two-thirds of uninsured Blacks and American Indians/Alaska Natives have incomes below the Medicaid expansion limit of 138% FPL. If a state does not implement the expansion, most of these individuals will be left without an affordable coverage option and will likely remain uninsured.
In sum, the ACA coverage expansions provide an important opportunity to increase coverage among communities of color and advance efforts to achieve greater equity in health coverage. Moreover, to ensure coverage expansions translate into increased coverage, it will be important to conduct outreach and provide application assistance through trusted organizations and individuals with strong ties to communities of color. Given their higher uninsured rates, people of color will be disproportionately impacted if a state does not implement the Medicaid expansion. Without the Medicaid expansion, many people of color will remain uninsured contributing to ongoing access problems and continuing disparities in coverage.
Introduction
Disparities in health care in the United States remain a longstanding challenge. In particular, people of color face persistent and significant disparities in health coverage that contribute to poorer health access and outcomes and unnecessary costs. As the population becomes more diverse, with people of color projected to account for over half of the population by 2050 (Figure 1), it is increasingly important to address these disparities.
One of the key goals of the Affordable Care Act (ACA) is to reduce the number of uninsured through a Medicaid expansion and the creation of health insurance exchange marketplaces with advance premium tax credits to help moderate-income individuals pay for this coverage. Given that people of color are at disproportionate risk of being uninsured and having low incomes, the ACA coverage expansions could particularly benefit communities of color and advance efforts to eliminate disparities.
This brief provides an overview of health coverage by race and ethnicity today to provide greater insight into the potential impacts of the ACA coverage expansions for people of color.1 It is based on analysis of the March 2012 Current Population Survey Annual Social and Economic Supplement.
Background: Medicaid Today and the ACA Coverage Expansions
Today, there is significant variation in Medicaid eligibility across states and groups of people. While states have significantly expanded eligibility for children through Medicaid and CHIP, eligibility levels are much more limited for their parents. Moreover, in most states, other adults without dependent children cannot qualify for Medicaid regardless of how low their income is.
Beginning in 2014, the ACA fills gaps in Medicaid coverage for adults by extending eligibility to 138% of the federal poverty level (FPL) ($26,951 for a family of three in 2013). It also creates new health insurance exchange marketplaces that will build on Medicaid coverage. Advance premium tax credits to help purchase exchange coverage will be available to individuals between 100%-400% FPL who are not eligible for Medicaid and do not have access to affordable health coverage through an employer.
The Supreme Court ruling on the ACA effectively made implementation of the Medicaid expansion a state choice. The Supreme Court upheld the constitutionality of the ACA, but limited enforcement of the Medicaid expansion, effectively making its implementation a state choice. If a state does not expand Medicaid, many low-income adults in that state will likely remain uninsured as those with incomes below 100% FPL will not gain a new coverage option.
Today, immigrants face eligibility restrictions for Medicaid, and they will continue to face eligibility restrictions for health coverage options under the ACA coverage expansions. Specifically, many lawfully present immigrants are subject for a five-year waiting period for Medicaid and CHIP and some lawfully present immigrants remain ineligible regardless of their length of time in the country. Under the ACA, this five-year waiting period and exclusion of some categories of lawfully present immigrants will remain in place for Medicaid. Lawfully present immigrants will be able to purchase coverage in the exchange and receive tax credits without a waiting period, including those who are not eligible for Medicaid due to the five-year wait or their immigration status. Undocumented immigrants are ineligible for Medicaid today and will be ineligible for Medicaid and premium tax credits under the ACA; they also will be prohibited from purchasing exchange coverage at full cost.
Overview of Communities of Color
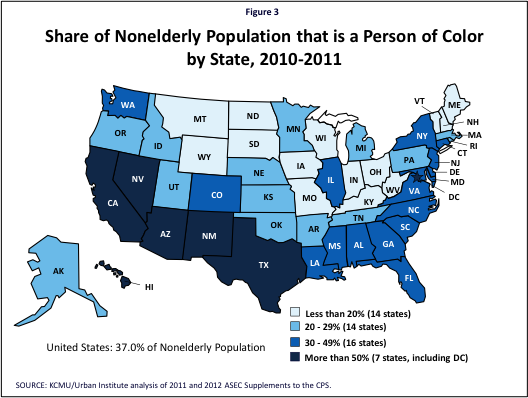
People of color account for about four in ten (39%) of the total nonelderly population. Blacks and Hispanics make up the largest shares of this group, with the remainder including Asians/Pacific Islanders, American Indians/Alaska Natives, and individuals identifying as two or more races (Figure 2). The share of the population that is a person of color varies significantly across states from less than 5% in states such as Maine and Vermont to over 60% in areas such as Hawaii, Texas, California, New Mexico, and the District of Columbia (Figure 3, Appendix Table 1).Moreover, people of color disproportionately live in certain states, with over half of all Hispanics residing in California, Texas, and Florida and four in ten of all Asians/Pacific Islanders residing in California and New York (Appendix Table 2).

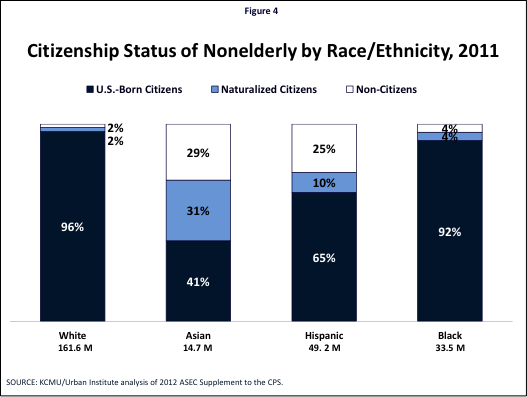
Moreover, there is significant diversity within racial/ethnic groups. Each group includes individuals that vary based on many factors, including immigration status, cultural background, language spoken, and level of English proficiency. It is important to recognize these underlying subgroup variations, since findings for a broad racial group may not be representative of experiences of subgroups. For example, immigrants, who face more barriers to coverage and care relative to U.S.-born citizens, comprise a significant share of Asians/Pacific Islanders and Hispanics (Figure 4). Moreover, other analysis shows that while, as a broad group, Asians/Pacific Islanders often fare as well and sometimes better than Whites along key economic and social factors, disaggregated data reveal that certain subgroups of Asians and Pacific Islanders continue to face many challenges.2 For example, while, as a whole, over eight in ten Asians/Pacific Islanders have health insurance coverage, certain subgroups including Koreans and Bangladeshis have significantly lower coverage rates (at about 78%).3
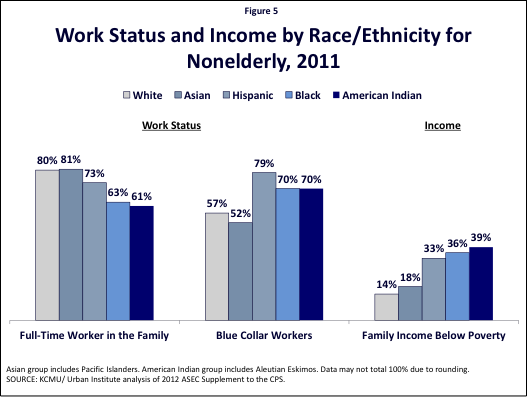
Even though the majority of Hispanics, Blacks, and American Indians/Alaska Natives have at least one full-time worker in the family, they are more than twice as likely to be poor than Whites. Whites and Asians/Pacific Islanders are equally likely to have a full-time worker in the family, with eight in ten indicating at least one full-time worker. The majority of Hispanics, Blacks, and American Indians/Alaska Natives also have at least one full-time worker in the family, although their rates are lower than those for White and Asians/Pacific Islanders. Moreover, Hispanics, Blacks, and American Indians/Alaska Natives are more likely than Whites and Asians/Pacific Islanders to be employed in blue-collar occupations and have family income below the federal poverty level, with at least a third of these groups below poverty (Figure 5). Individuals in low-wage, blue-collar jobs are less likely to be offered health coverage by their employer and, when it is offered, often have difficulty affording their share of premium costs.
Health Insurance Coverage Among the Nonelderly by Race and Ethnicity
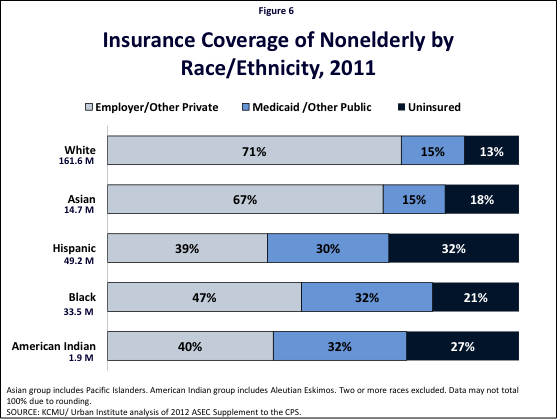
Health insurance coverage rates vary significantly by race/ethnic group. Nonelderly Hispanics have the highest uninsured rate, with nearly one in three lacking coverage (32%), followed by American Indians/Alaska Natives (27%), Blacks (21%), and Asians/Pacific Islanders (18%), who are all more likely than Whites (13%) to be uninsured (Figure 6). These higher uninsured rates primarily reflect lower rates of employer or other private coverage for these groups. Medicaid coverage helps fill in some of these gaps in private coverage, particularly for Hispanics, Blacks, and American Indians/Alaska Natives, but does not fully offset the difference, leaving these groups more likely to be uninsured.
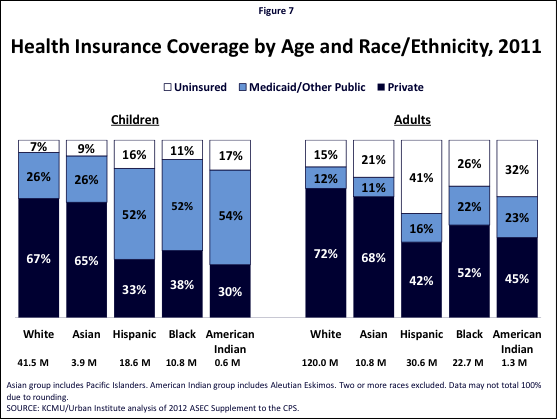
Across racial and ethnic groups, adults are significantly more likely to be uninsured than children (Figure 7). This reflects that states have expanded Medicaid eligibility for children to a much greater extent than they have done so for adults. Medicaid plays a particularly important role for Hispanic, Black, and American Indian/Alaska Native children, covering more than half of all children in these groups.
Nonelderly Medicaid Enrollees by Race and Ethnicity
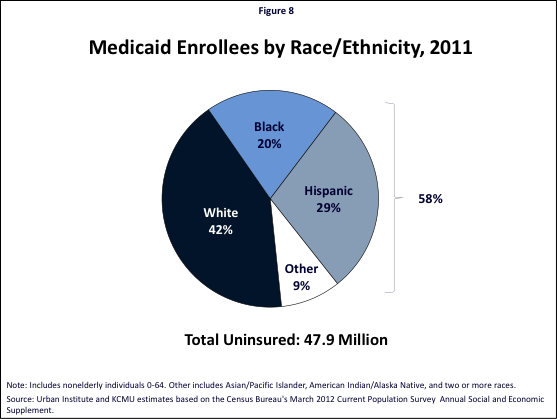
People of color make up nearly six in ten (58%) of nonelderly Medicaid enrollees (Figure 8). Hispanics account for the largest share of this group, making up nearly three in ten (29%) of all Medicaid enrollees. Blacks make up another one in five (20%) enrollees, and an additional 9% of enrollees include Asians/Pacific Islanders, American Indians/Alaska Natives, and individuals identifying as two or more races.
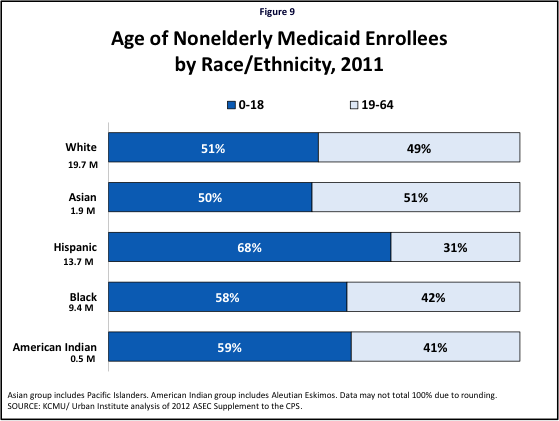
Across racial and ethnic groups, children account for at least half of Medicaid enrollees (Figure 9). Children make up a particularly large share of Medicaid enrollees for Hispanics (68%), American Indians/Alaska Natives (59%), and Blacks (58%).
Hispanic, Black, and American Indian/Alaska Native Medicaid enrollees are more likely to be poor than White and Asian/Pacific Islander enrollees (Figure 10). In particular, a significant share of Black and American Indian/Alaska Native Medicaid enrollees are very poor, with income below half the federal poverty level.

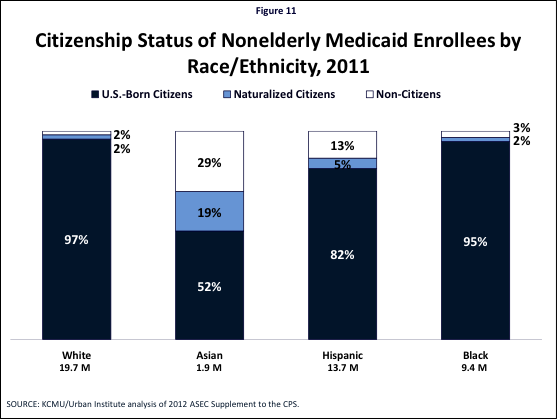
Asian/Pacific Islander and Hispanic Medicaid enrollees include a sizeable share of immigrants (Figure 11). Immigrants make up nearly half (48%) of Asian/Pacific Islander Medicaid enrollees. About four in ten of these immigrants are naturalized citizens, while the remaining six in ten are lawfully present non-citizens. Among Hispanic Medicaid enrollees, about one in five is an immigrant (18%), and about three-quarters of these immigrants are lawfully present non-citizens. Immigrants make up a much smaller share of White and Black Medicaid enrollees.
Nonelderly Uninsured by Race and Ethnicity
Over half of the nonelderly uninsured (55%) are people of color (Figure 11). Hispanics account for the largest share of uninsured people of color, making up nearly one in three (32%) of the total uninsured. Blacks account for 15% of the uninsured, and an additional 8% include Asians/Pacific Islanders, American Indians/Alaska Natives, and individuals identifying as two or more races.
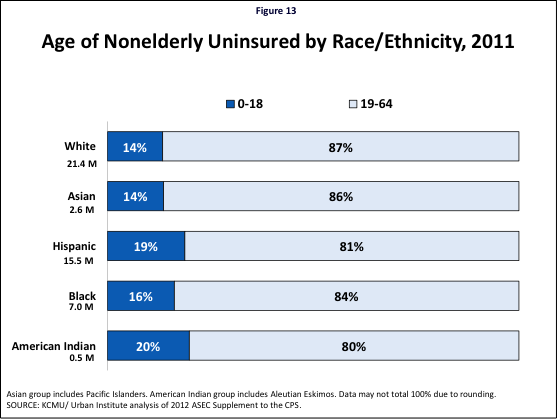
Adults account for at least eight in ten of the uninsured across racial and ethnic groups (Figure 12). This reflects that Medicaid eligibility for adults currently remains very limited in most states, leaving many low-income parents and other adults without an affordable coverage option.

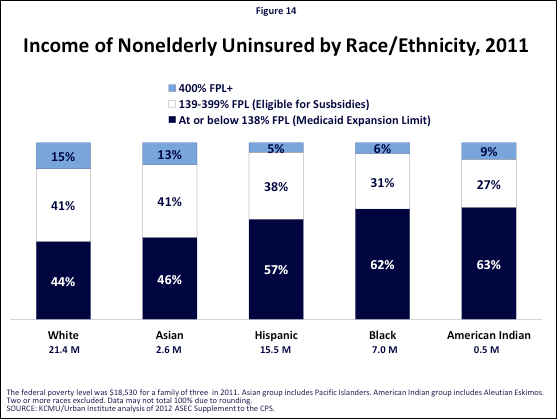
The large majority of uninsured have incomes that would qualify for the ACA coverage expansions, particularly among Hispanics, Blacks, and American Indians/Alaska Natives (Figure 14). Over six in ten uninsured Blacks (62%) and American Indians/Alaska Natives (63%) have incomes at or below the ACA Medicaid expansion limit of 138% FPL, as do over half of Hispanics (57%). Less than half of uninsured Whites (44%) and Asians/Pacific Islanders (46%) have incomes below this limit; however, still over four in ten of uninsured individuals in these groups would be income eligible for Medicaid in states that implement the expansion. An additional four in ten uninsured Whites (41%) and Asians/Pacific Islanders (41%) have incomes in the range to qualify for the advance premium tax credits for exchange coverage, as do 38% of uninsured Hispanics, 31% of uninsured Blacks, and 27% of uninsured American Indians/Alaska Natives.
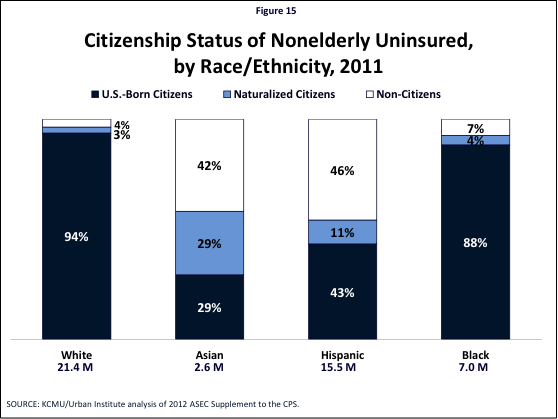
Significant shares of uninsured Asians/Pacific Islanders and Hispanics are immigrants, including naturalized citizens and non-citizens (Figure 15). Under the ACA, naturalized citizens will be eligible for coverage on the same basis as U.S.-born citizens. However, as noted, non-citizens will face eligibility restrictions for Medicaid and exchange coverage, including the five-year wait for Medicaid coverage for lawfully present immigrants and the exclusion of undocumented immigrants from coverage options.
Implications
These findings highlight the significant and growing diversity of the population and the key health coverage challenges faced by people of color. People of color account for a significant share of the U.S. population today and are projected to make up the majority of the population by 2050. There is significant diversity among communities of color, reflecting varied cultural backgrounds, immigration statuses, and languages. While the majority of people of color have a full-time worker in the family, they are more likely to be in low-income, low-wage jobs that provide limited access to employer-sponsored insurance. Moreover, even when offered coverage by an employer, they are likely to have difficulty affording it given their low incomes. Similarly, coverage on the individual market is often unaffordable.
Reflecting their limited incomes and lack of access to employer-sponsored health insurance, people of color are more likely to be uninsured compared to Whites. Medicaid plays a particularly important role for people of color, especially children, helping to offset some of these gaps in private coverage. The more expansive role of Medicaid for children reflects that states have significantly expanded eligibility for children through Medicaid and CHIP. In contrast, Medicaid eligibility for parents and other adults remains more limited. As such, a smaller share of the gap in private coverage is filled for adults in these groups, leaving them with significantly higher uninsured rates compared to Whites.
The ACA coverage expansions have the potential to significantly increase coverage for people of color and reduce disparities in coverage. Over half of the currently uninsured are people of color. The large majority of uninsured people of color have incomes that would qualify for the ACA Medicaid expansion or premium tax credits for exchange coverage, with over nine in ten uninsured Hispanics, Blacks, and American Indians/Alaska Natives having household incomes in the range to qualify for these coverage options. However, significant shares of uninsured Asians and Hispanics are non-citizen immigrants who will face eligibility restrictions for Medicaid and exchange coverage under the ACA.
State decisions to implement the Medicaid expansion will have particularly important implications for people of color and potential reductions of disparities in coverage. As noted, the ACA Medicaid expansion to 138% FPL is now effectively a state option. People of color have particularly high stakes in state decisions to expand, as over half of uninsured Hispanics and nearly two-thirds of uninsured Blacks and American Indians/Alaska Natives have incomes below the Medicaid expansion limit. The Medicaid expansion could significantly increase coverage rates for these groups and help reduce longstanding disparities in coverage. If a state does not implement the expansion, most of these individuals will be left without an affordable coverage option and likely remain uninsured, contributing to ongoing access problems and continuing disparities in coverage.
Outreach and enrollment efforts will be important for assuring that increased coverage options translate into increased coverage rates. Today, eligible individuals face numerous potential barriers to enrolling in Medicaid and CHIP, including lack of awareness of the programs, difficulty completing the application process, and language and literacy challenges. Conducting outreach through trusted organizations and individuals with strong ties to communities of color will be important for making people aware of their eligibility for the new Medicaid and exchange coverage options under the ACA. Moreover, one-on-one application assistance, language accessibility, and cultural competency will be key for reaching the diverse set of individuals within these communities, particularly those at higher risk for facing barriers, such as non-citizens and individuals with limited English proficiency.
This brief was prepared by Samantha Artiga with the Kaiser Family Foundation’s Commission on Medicaid and the Uninsured. The author thanks Brian Smedley with the Joint Center for Political and Economic Studies; Jennifer Ng’andu with the National Council of La Raza; and Kathy Ko Chin, Priscilla Huang, and Iyanrick John, with the Asian and Pacific Islander American Health Forum for their helpful review. She also thanks Andrew Goodwin, former Barbara Jordan Health Policy fellow for earlier research assistance that helped inform this brief.
| Table 1: Share of Nonelderly Population that is a Person of Color by Race/Ethnicity and State, 2010-2011 | ||||||||
| State | Nonelderly Population (Millions) | White | Black | Hispanic | Asian American & Pacific Islander | American Indian/Alaska Native | Other | Total People of Color |
| United States | 266.1 | 61% | 13% | 18% | 5% | 1% | 2% | 39% |
| Alabama | 4.1 | 66% | 27% | 4% | 1% | — | 1% | 34% |
| Alaska | 0.6 | 68% | 2% | 7% | 8% | 8% | 7% | 32% |
| Arizona | 5.7 | 52% | 4% | 36% | 3% | 3% | 2% | 48% |
| Arkansas | 2.4 | 73% | 16% | 6% | 2% | — | 2% | 27% |
| California | 33.0 | 37% | 6% | 42% | 13% | 0% | 2% | 63% |
| Colorado | 4.4 | 70% | 4% | 21% | 3% | — | 2% | 30% |
| Connecticut | 3.0 | 70% | 9% | 14% | 6% | — | 1% | 30% |
| Delaware | 0.8 | 61% | 22% | 11% | 3% | — | 2% | 39% |
| District of Columbia | 0.5 | 36% | 47% | 12% | 4% | — | — | 64% |
| Florida | 15.5 | 56% | 16% | 23% | 3% | — | 1% | 44% |
| Georgia | 8.6 | 55% | 30% | 9% | 4% | — | 2% | 45% |
| Hawaii | 1.1 | 16% | — | 13% | 48% | — | 22% | 84% |
| Idaho | 1.4 | 80% | — | 15% | 2% | — | — | 20% |
| Illinois | 11.1 | 62% | 14% | 17% | 5% | — | 1% | 38% |
| Indiana | 5.5 | 82% | 10% | 5% | 2% | — | 2% | 18% |
| Iowa | 2.6 | 86% | 3% | 7% | 2% | — | 2% | 14% |
| Kansas | 2.4 | 76% | 6% | 11% | 3% | — | 4% | 24% |
| Kentucky | 3.7 | 84% | 8% | 4% | 1% | — | 2% | 16% |
| Louisiana | 3.9 | 61% | 33% | 4% | — | — | — | 39% |
| Maine | 1.1 | 94% | 1% | 1% | 1% | — | 3% | 6% |
| Maryland | 5.1 | 51% | 29% | 10% | 7% | — | 2% | 49% |
| Massachusetts | 5.6 | 74% | 6% | 12% | 7% | — | 1% | 26% |
| Michigan | 8.4 | 75% | 14% | 5% | 3% | — | 2% | 25% |
| Minnesota | 4.5 | 81% | 6% | 5% | 5% | — | 2% | 19% |
| Mississippi | 2.5 | 56% | 39% | 2% | — | — | — | 44% |
| Missouri | 5.1 | 79% | 12% | 3% | 2% | — | 3% | 21% |
| Montana | 0.8 | 87% | — | 3% | — | 6% | 3% | 13% |
| Nebraska | 1.6 | 77% | 5% | 13% | 2% | 2% | 1% | 23% |
| Nevada | 2.3 | 49% | 8% | 29% | 9% | — | 3% | 51% |
| New Hampshire | 1.1 | 92% | 1% | 2% | 2% | — | 1% | 8% |
| New Jersey | 7.5 | 55% | 13% | 22% | 9% | — | 1% | 45% |
| New Mexico | 1.7 | 37% | — | 48% | 3% | 10% | — | 63% |
| New York | 16.7 | 56% | 15% | 19% | 9% | 0% | 1% | 44% |
| North Carolina | 8.1 | 62% | 22% | 9% | 3% | 3% | 1% | 38% |
| North Dakota | 0.6 | 82% | 1% | 3% | 1% | 10% | 3% | 18% |
| Ohio | 9.7 | 80% | 12% | 4% | 1% | — | 2% | 20% |
| Oklahoma | 3.2 | 62% | 8% | 8% | 1% | 7% | 13% | 38% |
| Oregon | 3.3 | 78% | 2% | 10% | 6% | — | 3% | 22% |
| Pennsylvania | 10.6 | 78% | 11% | 7% | 2% | — | 1% | 22% |
| Rhode Island | 0.9 | 74% | 6% | 15% | 3% | — | 2% | 26% |
| South Carolina | 3.9 | 63% | 30% | 5% | 1% | — | 1% | 37% |
| South Dakota | 0.7 | 82% | 1% | 4% | 1% | 9% | 2% | 18% |
| Tennessee | 5.5 | 75% | 17% | 4% | 2% | — | 2% | 25% |
| Texas | 22.7 | 39% | 12% | 42% | 5% | 0% | 1% | 61% |
| Utah | 2.5 | 81% | 1% | 11% | 4% | 1% | 2% | 19% |
| Vermont | 0.5 | 94% | 1% | 1% | 1% | — | 2% | 6% |
| Virginia | 6.8 | 63% | 19% | 9% | 6% | — | 3% | 37% |
| Washington | 5.8 | 68% | 3% | 13% | 11% | 1% | 5% | 32% |
| West Virginia | 1.6 | 94% | 3% | — | — | — | 2% | 6% |
| Wisconsin | 4.8 | 80% | 6% | 7% | 3% | 2% | 2% | 20% |
| Wyoming | 0.5 | 85% | — | 10% | — | 2% | 2% | 15% |
| “–” = Sample size is not sufficient for a reliable estimate. SOURCE: KCMU/Urban Institute analysis of 2011 and 2012 ASEC Supplements to the CPS. | ||||||||
| Table 2: Distribution of Nonelderly People of Color by Race/Ethnicity and State, 2010-2011 | |||||||
| State | White | Black | Hispanic | Asian American & Pacific Islander | American Indian/Alaska Native | Other | Total People of Color |
| Nonelderly Population (Millions) | 162.16 | 33.37 | 48.66 | 14.59 | 1.90 | 5.44 | 103.96 |
| Alabama | 1.7% | 3.3% | 0.3% | 0.4% | — | 1.0% | 1.3% |
| Alaska | 0.3% | 0.0% | 0.1% | 0.3% | 2.7% | 0.9% | 0.2% |
| Arizona | 1.8% | 0.7% | 4.2% | 1.3% | 7.8% | 1.8% | 2.6% |
| Arkansas | 1.1% | 1.2% | 0.3% | 0.4% | — | 1.0% | 0.6% |
| California | 7.6% | 5.5% | 28.4% | 29.6% | 8.0% | 12.4% | 20.0% |
| Colorado | 1.9% | 0.6% | 1.9% | 0.9% | — | 1.2% | 1.3% |
| Connecticut | 1.3% | 0.8% | 0.9% | 1.2% | — | 0.6% | 0.9% |
| Delaware | 0.3% | 0.5% | 0.2% | 0.2% | — | 0.3% | 0.3% |
| District of Columbia | 0.1% | 0.8% | 0.1% | 0.1% | — | — | 0.3% |
| Florida | 5.3% | 7.6% | 7.5% | 3.0% | — | 4.2% | 6.6% |
| Georgia | 2.9% | 7.7% | 1.6% | 2.4% | — | 3.3% | 3.8% |
| Hawaii | 0.1% | — | 0.3% | 3.6% | — | 4.4% | 0.9% |
| Idaho | 0.7% | — | 0.4% | 0.2% | — | — | 0.3% |
| Illinois | 4.2% | 4.8% | 3.8% | 4.0% | — | 3.0% | 4.1% |
| Indiana | 2.8% | 1.6% | 0.6% | 0.6% | — | 1.7% | 1.0% |
| Iowa | 1.4% | 0.2% | 0.4% | 0.4% | — | 0.9% | 0.4% |
| Kansas | 1.1% | 0.4% | 0.5% | 0.4% | — | 2.0% | 0.6% |
| Kentucky | 1.9% | 0.9% | 0.3% | 0.3% | — | 1.2% | 0.6% |
| Louisiana | 1.5% | 3.8% | 0.3% | — | — | — | 1.5% |
| Maine | 0.6% | 0.0% | 0.0% | 0.1% | — | 0.5% | 0.1% |
| Maryland | 1.6% | 4.4% | 1.0% | 2.6% | — | 2.1% | 2.4% |
| Massachusetts | 2.5% | 1.1% | 1.3% | 2.7% | — | 1.0% | 1.4% |
| Michigan | 3.9% | 3.6% | 0.9% | 1.8% | — | 3.4% | 2.0% |
| Minnesota | 2.3% | 0.8% | 0.5% | 1.6% | — | 1.5% | 0.8% |
| Mississippi | 0.9% | 2.9% | 0.1% | — | — | — | 1.1% |
| Missouri | 2.5% | 1.8% | 0.4% | 0.7% | — | 2.6% | 1.0% |
| Montana | 0.4% | — | 0.1% | — | 2.4% | 0.4% | 0.1% |
| Nebraska | 0.7% | 0.2% | 0.4% | 0.2% | 1.7% | 0.4% | 0.4% |
| Nevada | 0.7% | 0.6% | 1.4% | 1.5% | — | 1.5% | 1.1% |
| New Hampshire | 0.6% | 0.0% | 0.1% | 0.2% | — | 0.3% | 0.1% |
| New Jersey | 2.5% | 3.0% | 3.5% | 4.4% | — | 1.1% | 3.3% |
| New Mexico | 0.4% | — | 1.7% | 0.3% | 9.1% | — | 1.0% |
| New York | 5.7% | 7.2% | 6.6% | 10.2% | 2.9% | 3.7% | 7.1% |
| North Carolina | 3.1% | 5.4% | 1.5% | 1.4% | 10.7% | 2.1% | 2.9% |
| North Dakota | 0.3% | 0.0% | 0.0% | 0.1% | 3.0% | 0.3% | 0.1% |
| Ohio | 4.8% | 3.6% | 0.7% | 0.9% | — | 4.1% | 1.9% |
| Oklahoma | 1.2% | 0.7% | 0.6% | 0.3% | 11.8% | 7.8% | 1.2% |
| Oregon | 1.6% | 0.2% | 0.7% | 1.3% | — | 2.1% | 0.7% |
| Pennsylvania | 5.1% | 3.5% | 1.4% | 1.8% | — | 2.7% | 2.2% |
| Rhode Island | 0.4% | 0.2% | 0.3% | 0.2% | — | 0.3% | 0.2% |
| South Carolina | 1.5% | 3.5% | 0.4% | 0.3% | — | 1.1% | 1.4% |
| South Dakota | 0.3% | 0.0% | 0.1% | 0.1% | 3.3% | 0.2% | 0.1% |
| Tennessee | 2.5% | 2.9% | 0.5% | 0.6% | — | 1.8% | 1.3% |
| Texas | 5.4% | 8.2% | 19.7% | 7.9% | 3.6% | 5.9% | 13.3% |
| Utah | 1.2% | 0.1% | 0.6% | 0.7% | 1.8% | 0.8% | 0.5% |
| Vermont | 0.3% | 0.0% | 0.0% | 0.1% | — | 0.2% | 0.0% |
| Virginia | 2.7% | 3.9% | 1.2% | 2.8% | — | 3.2% | 2.4% |
| Washington | 2.4% | 0.5% | 1.5% | 4.3% | 3.4% | 5.1% | 1.8% |
| West Virginia | 0.9% | 0.1% | — | — | — | 0.5% | 0.1% |
| Wisconsin | 2.4% | 0.8% | 0.7% | 0.9% | 5.4% | 1.5% | 0.9% |
| Wyoming | 0.3% | — | 0.1% | — | 0.6% | 0.1% | 0.1% |
| “–” = Sample size is not sufficient for a reliable estimate. SOURCE: KCMU/Urban Institute analysis of 2011 and 2012 ASEC Supplements to the CPS. | |||||||
- This brief presents data for Asians and Native Hawaiians and Pacific Islanders in an aggregate group. As such, subgroup distinctions between Asians and Native Hawaiian and Pacific Islanders are not reflected in the data. All differences between Whites and other race/ethnicity discussed in the text are statistically significant at the p<0.05 level, two-sided test. ↩︎
- Asian American Center for Advancing Justice, “A Community of Contrasts, Asian Americans, Native Hawaiians, and Pacific Islanders in California,” 2013, available at http://apalc.org/media-center/publications/community-contrasts-asian-americans-native-hawaiians-and-pacific-islande-0 ↩︎
- Asian & Pacific Islander American Health Forum, “Demographic and Socioeconomic Profiles of Asian Americans, Native Hawaiians, and Pacific Islanders in the United States”, July 2011, available at http://www.apiahf.org/sites/default/files/Demographic_Socioeconomic_Profiles_AANHPI.pdf ↩︎