Women, Work, and Family Health: Key Findings from the 2017 Kaiser Women’s Health Survey
Women now comprise nearly half of the nation’s workers, and 70% of mothers with children under age 18 are in the labor force. The U.S. Census Bureau reports that median earnings for women are only 81% of men’s earnings, a gap that has persisted for several years. Policy makers across the political spectrum have forwarded proposals to shore up economic security for working families. Much of the national discussion has focused on policies related to income, such as minimum wage, tax credits, salary transparency, job training, and the wage gap, all of which are important issues for women. For many working women, economic security also encompasses health issues, including workplace benefits such as insurance coverage, paid sick leave, and paid family leave. It is also related to women’s roles as mothers and the primary managers of their children’s health care. This brief presents data on employer benefits and women’s roles in caring for families’ health from the 2017 Kaiser Women’s Health Survey, a nationally representative survey of women and men ages 18 to 64, conducted in the summer and fall of 2017.
Workplace Benefits
So called “fringe benefits” such as paid leave and health insurance help employees meet their personal and family health care needs while also fulfilling their work responsibilities. About two-thirds of working women report that their employer offers them paid sick leave (65%), paid vacation (69%) and a retirement plan (65%), while almost half are offered paid maternity leave (44%) and paid family leave (47%). Men report receiving those same benefits in similar rates (Figure 1).
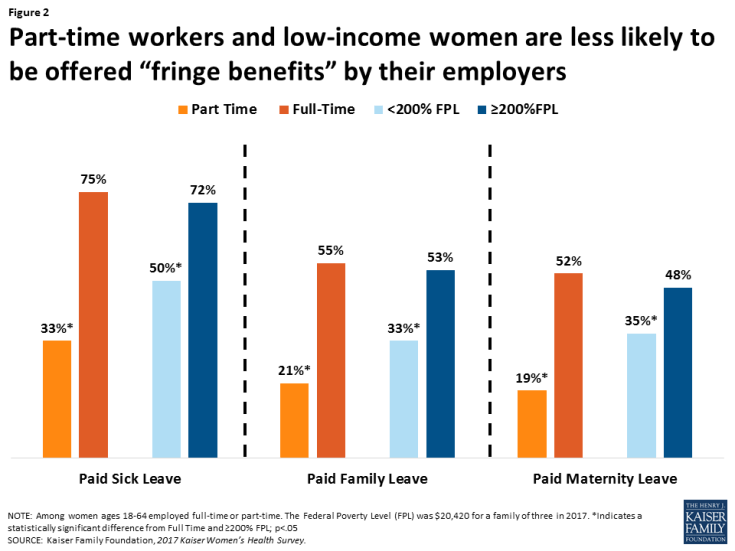
Benefits, however, are not equally available to all workers. Low-income women, women who are employed part-time, and women who live in rural areas are less likely to be offered these benefits. The disparity in workplace benefits is particularly stark between full and part-time workers (Figure 2). Among women part-time workers, 33% report they were offered paid sick leave compared to 75% of full-time workers, 21% were offered paid family leave (55% full-time workers), and 19% were offered paid maternity leave (52% full-time workers). Half of low-income women reported they were offered paid sick leave, and about one in three reported they were offered paid family leave and paid maternity leave. Only about a third of women living in rural areas reported their employer offered paid family leave and maternity leave compared to roughly half of women living in urban areas (see Appendix Table 1).

Figure 2: Part-time workers and low-income women are less likely to be offered “fringe benefits” by their employers
Parental Roles for Children’s Health
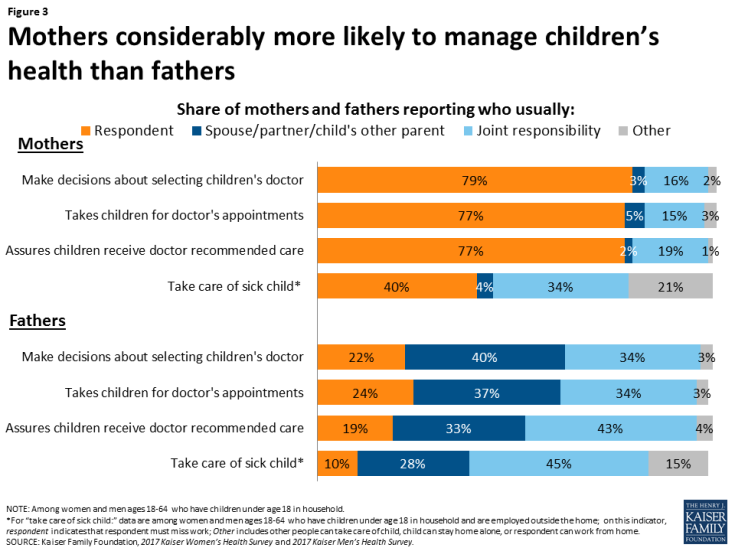
In most households, women are the managers of their families’ health care needs, as illustrated clearly in Figure 3. Among mothers, about three-quarters report that they are the ones who usually take charge of health care responsibilities such as choosing their children’s provider (79%), taking them to appointments (77%), and following through with recommended care (77%), compared to approximately a fifth of fathers who report they take care of these tasks. These rates have not changed significantly over the past decade. There are some variations between groups of women by marital status and education level (Appendix Table 2). This pattern has not changed since the Kaiser Women’s Health Survey was first conducted in 2001.
Mothers and fathers differ somewhat on their assessment of their involvement in children’s health care. While fathers are more likely to report that their partners take care of their children’s health needs than themselves, they are also more likely than mothers to report that it is a joint responsibility.
Impact of Children’s Health Needs on Working Parents
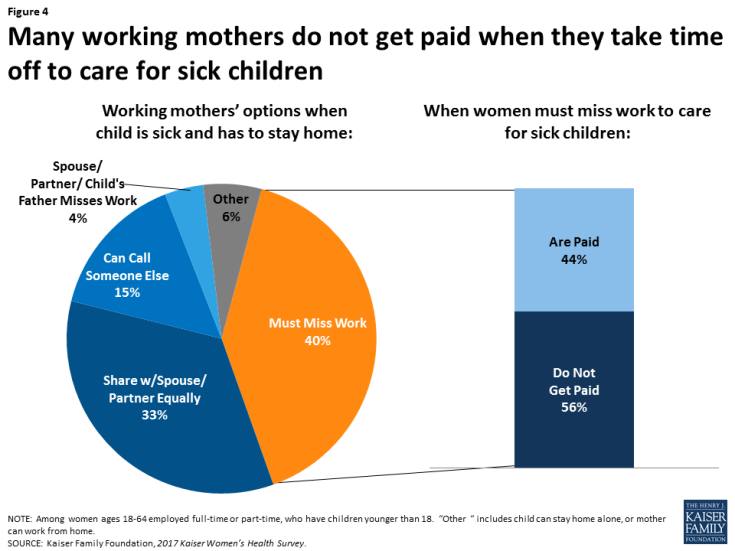
This gender difference extends to working parents as well. Four in ten working mothers (40%) say they must take time off work and stay home when their children are sick, four times the share of men who say this is the case (10%). Over one-third of both mothers and fathers say they share responsibility for these tasks.
Caring for children’s health has tangible economic consequences, especially for women. Among the mothers who must miss work when their children are sick, 56% are not paid for that time off (Figure 4), up significantly from 45% in 2004. Considering that nearly one-fifth of children miss more than a week due to illness or injury, this is a relatively common occurrence with potentially negative economic implications for working mothers.
Mothers in part-time jobs are more likely to report they have to miss work when their child is sick (51%) compared to about a third (36%) of their full-time counterparts. Low-income mothers who must miss work when their child is sick are also far more likely to lose pay (73%) compared to higher income mothers (47%). Additionally, there is a large disparity in workplace benefits, with offer rates of paid sick leave and paid vacation significantly lower among mothers who are low-income or part-time employees (Table 1).
| Table 1: Employer Benefits and Family Health | ||||
| Does your employer offer you: | When your child is sick do you: | |||
| Paid sick leave | Paid family leave | Have to miss work | Lose pay when you miss work | |
| Mothers <200% FPL (Low income) | 56%* | 40%* | 43% | 73%* |
| Mothers ≥200% FPL (Higher Income) | 70% | 54% | 38% | 47% |
| Mothers Full-Time Employment | 76% | 58% | 36% | 49% |
| Mothers Part-Time Employment | 34%* | 22%* | 51%* | n/a |
| NOTES: Among women ages 18-64 who have children under 18. The Federal Poverty Level (FPL) was $20,420 for a family of three in 2017. Some estimates are “n/a” because point estimates do not meet the minimum standards for statistical reliability *Indicates a statistically significant difference from >200% FPL and Full Time; p<.05. SOURCE: Kaiser Family Foundation, 2017 Kaiser Women’s Health Survey. |
||||
Conclusion
The landmark Family and Medical Leave Act (FMLA) has been in place for more than 20 years, and gives eligible employees up to 12 weeks of unpaid leave to care for seriously ill family members, the arrival of a child, and job protection when an employee returns from family or medical leave. However, many working women simply cannot afford to take extended leave without pay. While there is no national paid leave policy, five states and DC have enacted laws offering eligible employees partial paid family leave. In addition to paid family leave, several cities across the nation as well as nine states and DC, require some level of paid sick days, which enables women to take time off without losing pay when they or their children get a minor illness and need to stay home for short periods.
Women have always been the primary caregivers for their family’s health needs, be it for their children, parents, or other family members. The Kaiser Women’s Health Survey finds that there has been relatively little change over time in the share of women employees who receive workplace benefits, such as paid leave, retirement plans, and paid sick days. For many women, missing work when they or their children have a cold or upset stomach has a cost. The price is especially high for low-income working mothers, who have fewer financial resources, and often limited workplace benefits.
This brief was prepared by Ivette Gomez, Usha Ranji, and Alina Salganicoff of the Kaiser Family Foundation.
The authors would like to thank Anthony Damico, an independent consultant, for his assistance with survey analysis.
| Appendix Table 1: Employer Benefits | |||||
| Does your employer offer you: | |||||
| Paid Sick Leave | Paid Family Leave | Paid Maternity Leave | Paid Vacation | A Retirement Plan | |
| All women 18-64 | 65% | 47% | 44% | 69% | 65% |
| White | 66% | 47% | 42% | 71% | 68% |
| Black | 68% | 54% | 58%* | 73% | 72% |
| Latina | 66% | 45% | 42% | 61%* | 50%* |
| Private Insurance | 73% | 54% | 50% | 77% | 73% |
| Medicaid | 40%* | 18%* | 27%* | 38%* | 34%* |
| Uninsured | 44%* | 26%* | 22%* | 51%* | 38%* |
| <200% FPL | 50%* | 33%* | 35%* | 55%* | 47%* |
| ≥200% FPL | 72% | 53% | 48% | 75% | 72% |
| Full-Time Employment | 75% | 55% | 52% | 80% | 74% |
| Part-Time Employment | 33%* | 21%* | 19%* | 31%* | 32%* |
| <High School | 41% | 17% | 14% | 44% | 20% |
| High School Graduate | 56% | 37%* | 40%* | 62%* | 56%* |
| Some College | 67%* | 51%* | 44%* | 74%* | 69%* |
| College Graduate | 71%* | 53%* | 51%* | 72%* | 71%* |
| Urban | 68% | 51%* | 48%* | 72%* | 65% |
| Suburban | 65% | 48%* | 47%* | 70% | 67% |
| Rural | 60% | 37% | 29% | 61% | 58% |
| Fair/Poor Health | 60% | 46% | 39% | 62% | 47%* |
| Good/ Excellent Health | 66% | 47% | 45% | 70% | 67% |
| Women with children <18 | 65% | 49% | 46% | 66% | 62% |
| Women without children <18 | 67% | 53% | 54% | 72% | 68% |
| NOTES: Among women ages 18-64 employed full time or part time. The Federal Poverty Level (FPL) was $20,420 for a family of three in 2017. *Indicates a statistically significant difference from White, Private Insurance, >200% FPL, Full Time, <High School, Rural, and Good/Excellent; p<.05. SOURCE: Kaiser Family Foundation, 2017 Kaiser Women’s Health Survey. |
|||||
| Appendix Table 2: Family Health | ||||
| Mothers who responded that they usually: | ||||
| Make decisions about selecting their children’s doctor | Make sure their children get the care doctor recommends | Take children to doctor’s appointments | Must miss work when their children are ill^ | |
| All women 18-64 | 79% | 77% | 77% | 40% |
| White | 83% | 79% | 77% | 43% |
| Black | 78% | 85% | 81% | 38% |
| Latina | 74% | 71% | 75% | 43% |
| Married | 75% | 72% | 73% | 37% |
| Divorced | 90%* | 90%* | 89%* | n/a |
| Never Married | 89%* | 90%* | 87%* | n/a |
| <200% FPL | 79% | 79% | 79% | 43% |
| ≥200% FPL | 81% | 76% | 76% | 38% |
| Full-Time Employment | 83% | 76% | 70% | 36% |
| Part-Time Employment | 81% | 81% | 84%* | 51%* |
| Not Employed | 71%* | 75% | 81%* | – |
| <High School | 67%* | 70%* | 75% | n/a |
| High School Graduate | 74%* | 75%* | 72% | 37% |
| Some College | 86% | 85% | 82% | 44% |
| College Graduate | 80% | 74%* | 76% | 35% |
| Urban | 80% | 80% | 78% | 41% |
| Suburban | 76%* | 76% | 76% | 43% |
| Rural | 87% | 75% | 75% | 31% |
| Fair/Poor Health | 73% | 78% | 75% | n/a |
| Good/ Excellent Health | 80% | 77% | 77% | 38% |
| NOTES: Among women with children under the age of 18. ^Among women with children under 18 and who reported they were employed. The Federal Poverty Level (FPL) was $20,420 for a family of three in 2017. Some estimates are “n/a” because they do not meet the minimum standards for statistical reliability. *Indicates a statistically significant difference from Married, Full-Time employment, Some College, and Rural, p<.05 SOURCE: Kaiser Family Foundation, 2017 Kaiser Women’s Health Survey. |
||||


