Trends in Medicaid and CHIP Eligibility Over Time
Section 4: Eligibility Trends by State Health Ranking
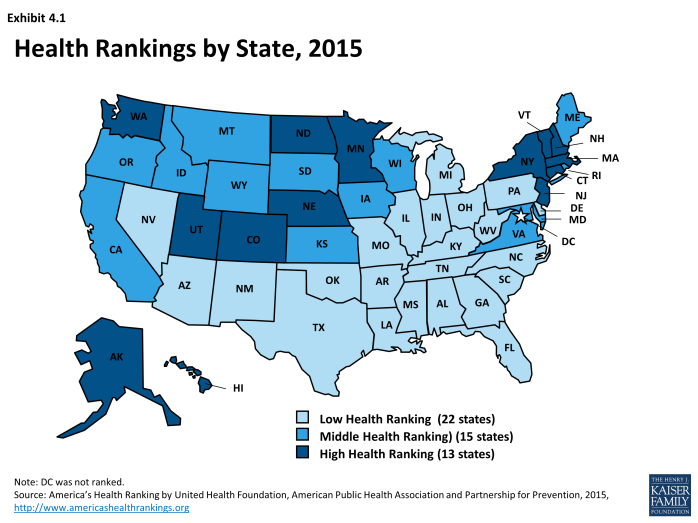
This section analyzes trends in eligibility over time by state health ranking. While these findings provide insight into how coverage levels vary by health needs, it is important to recognize that this is not a causal relationship given that health is impacted by a broad range of factors beyond health coverage and health care. State health rankings were based on the 2015 America’s Health Rankings report, which includes data for all 50 states, but not DC. America’s Health Ranking is produced annually by United Health Foundation, the American Public Health Association and the Partnership for Prevention (available at http://www.americashealthrankings.org/). The rankings are developed based on four groups of health determinants, including: behaviors, community & environment, policy and clinical care, and several measures of health outcomes. An overall health score is created for each state based on how they fare on each measure compared to the national average. (See Appendix B for more details.) For this analysis, states were categorized into three groups based on their health ranking scores. A total of 22 states with a negative score were classified as low health ranking states, 15 states with scores between 0 and .39 were grouped as middle health ranking states, and 13 states with scores above .40 were categorized as high health ranking states (Exhibit 4.1).
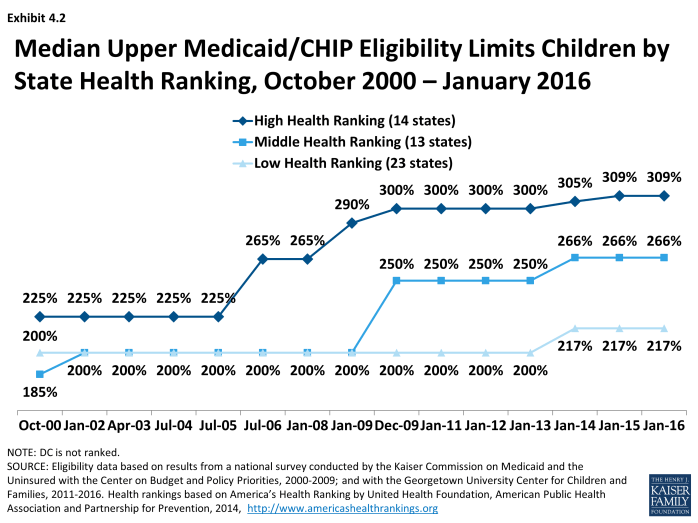
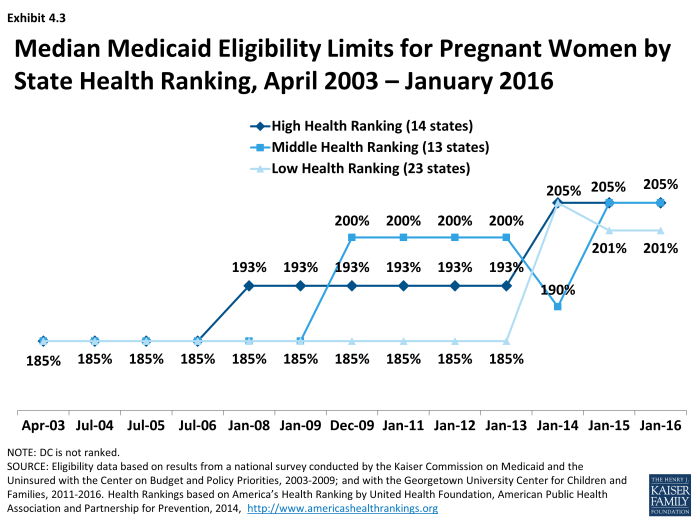
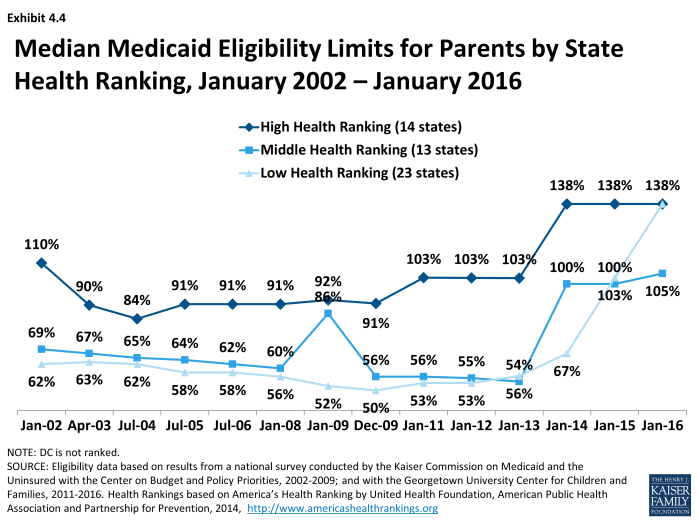
For children, parents, and other adults, states with the highest health rankings generally have the highest median eligibility limits over time. Differences between median eligibility limits by health ranking are largest for children, but have narrowed over time for other groups.
Children. Between 2000 and 2015, median eligibility limits for children increased in high and middle health ranking states (Exhibit 4.2). Increases were largest and occurred earlier in high health ranking states compared to the middle health ranking states. Median eligibility limits did not change in the low health ranking states except for the conversion to MAGI-based standards as of January 2014.
Pregnant women. For pregnant women, there were increases in median eligibility limits for high, middle, and low-ranking states between 2003 and 2016 (Exhibit 4.3). The increases occurred earliest in high ranking health ranking states as of 2008, following by middle health ranking states at the end of 2009, and then last by low-ranking states in 2013. Reflecting these increases, the differences in median eligibility limits between high, middle, and low health ranking states are narrow as of January 2016.
Parents. Median eligibility limits for parents increased between 2002 and 2016 across all three groups of states (Exhibit 4.4). States with high health rankings started with higher eligibility limits as of 2002 compared to the middle and low health ranking states, and remained the highest as of 2016. The middle and low health ranking states generally had similar median eligibility limits throughout the study period with an increase beginning in 2014 when the Medicaid expansion took effect. This increase narrowed the gap in eligibility limits between high and middle and low ranking states.
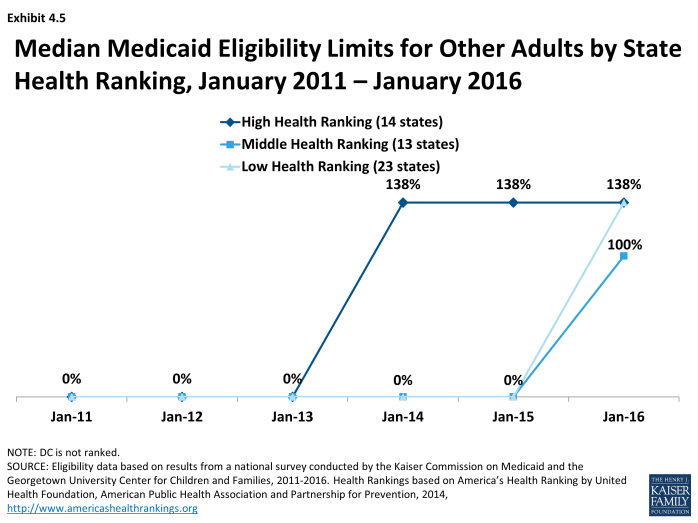
Other adults. The high health ranking states were the first group to show an increase in the median eligibility limit for other adults between 2011 and 2016, increasing from 0% FPL to 138% FPL as of January 2014 when the Medicaid expansion took effect (Exhibit 4.5). This increase reflects adoption of the Medicaid expansion in most of the states that have a high health ranking as of January 2014. In contrast, the median eligibility limit for middle and low health ranking states remained at 0% FPL through 2015. However, as a result of additional states implementing the expansion during 2015, their median limits rose as of January 2016 and the gap in eligibility limits between high, middle, and low health ranking states narrowed.

