Nursing Facilities, Staffing, Residents and Facility Deficiencies, 2009 Through 2016
Facility Deficiencies
Nursing facilities provide care to prevent problems and to address the needs of residents. However, sometimes care does not meet established standards. Policymakers and researchers have developed process indicators to measure the services or activities that a facility does or does not provide and outcome indicators to measure the impact of facility care on a resident. A number of process measures have been associated with poor patient outcomes. These include urethral catheterization, physical restraints, and tube feedings. Another common clinical problem in nursing homes is the improper use of psychotropic drugs.1 A number of outcome measures also have been linked to poor quality, such as: pressure ulcers, falls, weight loss, and infectious disease. Other negative outcomes are behavioral/emotional problems, cognitive problems, and deterioration in physical functioning.2
State surveyors assess both the process and the outcomes of nursing facility care in several major areas, each of which has specific requirements (see Appendix for more detail). In 2016, there were approximately 175 individual requirements. Where a facility fails to meet a requirement, a deficiency or citation is given to the facility for that individual requirement. The deficiencies are given for problems that can result in a negative impact on the health and safety of residents. Since 1995, surveyors also rate each deficiency based on scope and severity for purposes of enforcement. The deficiencies rated as causing actual harm or immediate jeopardy are the most serious.3
Overall Rates of Deficiencies
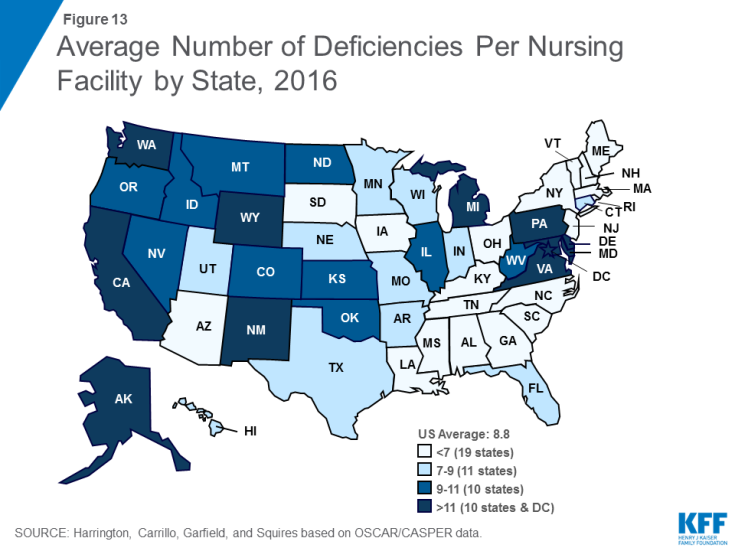
As shown in Table 9, the average number of deficiencies per facility decreased from 9.33 in 2009 to 7.28 in 2013, before rising again in 2016 to reach 8.76. Similarly, the share of facilities with no deficiencies increased from 6.11 in 2009 to 8.07 in 2013, then dropped to 6.50 in 2016. There was wide variation across states in the average number of deficiencies per facility, ranging from 2.56 in Rhode Island to 14.72 in Washington (Figure 13), as well as in the share of facilities with no deficiencies (ranging from 28.6 in Rhode Island to none in the District of Columbia, Delaware, Hawaii and Wyoming). Of particular concern are deficiencies that cause harm or immediate jeopardy to residents. In 2016, more than one in five (20.1%) facilities received a deficiency for actual harm or jeopardy. Again, this rate varied widely across states (Table 10).
Deficiencies by Type
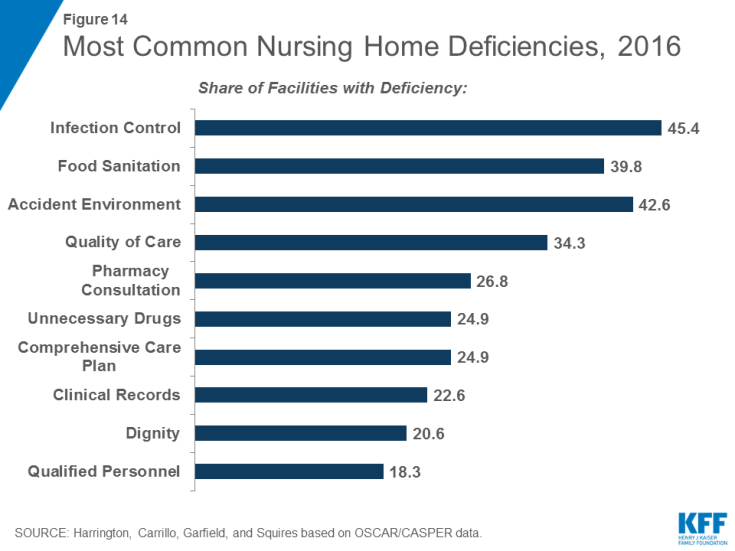
Some types of deficiency are more common than others. In 2016, the most common deficiencies were given for failures in infection control (45.4%); food sanitation (42.6%); accident environment (39.8%); quality of care (34.3%); and pharmacy consultation (26.8%) (Figure 14). (See Appendix for definitions of these types of deficiencies.) Again, there was variation across states in the share of facilities cited for different types of deficiencies (Table 11). However, some states had high rates across all top ten deficiencies, with the Alaska and Washington ranking in the top ten deficiency rate for eight deficiencies and California ranking in the top ten for seven. Additional detail on selected types of deficiencies by state over time is provided in the Supplemental Tables. In addition, the Supplemental Tables provide detailed data on all 175 deficiency types over time, grouped according to the eight categories established by CMS for the Medicare Nursing Home Compare 5-Star website Deficiency data: (1) quality of care; (2) mistreatment; (3) resident assessment; (4) resident rights; (5) environment; (6) nutrition; (7) pharmacy; and (8) administration.


