Nursing Facilities, Staffing, Residents and Facility Deficiencies, 2009 Through 2016
Facility Characteristics
Facility characteristics provide a picture of who provides nursing facility care in the United States, including the number and capacity of facilities, certification and ownership, and revenue sources.
Capacity and Occupancy
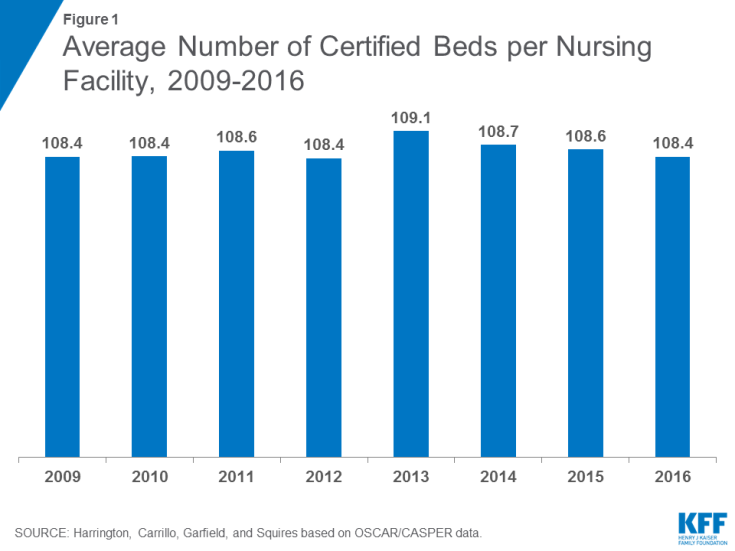
The number of beds that are certified for Medicare and Medicaid residents are an indication of nursing facility capacity in a state. There were 15,452 certified nursing facilities surveyed in 2016, out of approximately 15,640 certified facilities in the U.S.1 Not all facilities are surveyed by state agencies during a calendar year. In terms of number of beds, there were 1.644 million certified beds in nursing facilities that were surveyed in 2016 (uncertified beds are excluded), compared to 1.664 million in 2009 (state-by-state and trend data on number of facilities and number of beds is available in the Supplemental Tables). The number of certified nursing beds per facility is calculated by dividing the total number of certified beds in a state by the total number of certified facilities in the state. In 2016, the overall average facility size was 108.37 beds, almost the same as 2009 (108.42) (Figure 1 & Table 1). However, states vary in their average facility size, with states in the East generally having larger facilities and states in the Mid-West having the smallest facilities (Figure 2).
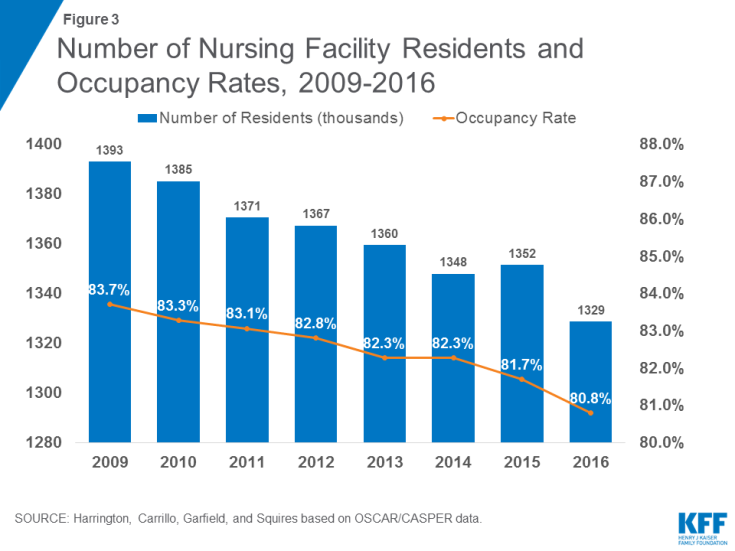
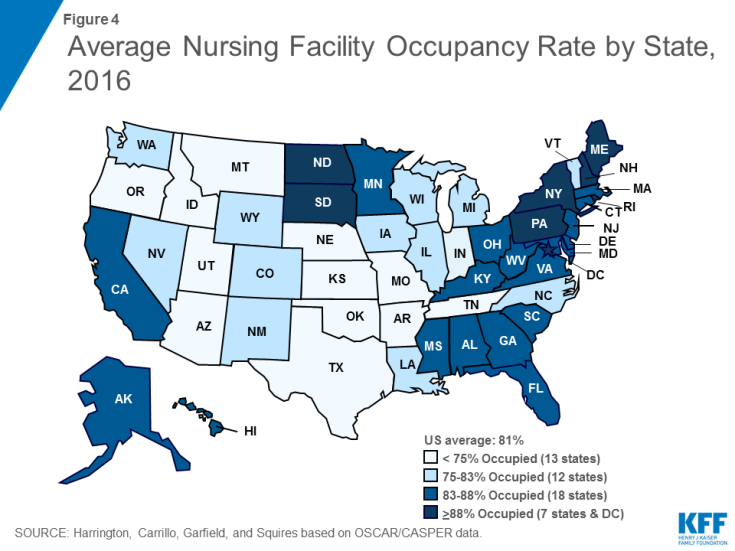
Occupancy rates also are important in showing the potential availability of beds; further, occupancy rates may influence the quality and financial status of the facility.2 Facility occupancy rates are calculated by dividing the number of nursing residents in a certified facility by the total number of certified beds (excluding all uncertified residents and beds). The total number of nursing facility residents in certified nursing facilities has been declining somewhat over time, from 1.393 million in 2009 to 1.329 million in 2016 (excluding residents in uncertified beds) (Figure 3 and Table 2). Correspondingly, the average certified nursing facility occupancy rate declined slightly from 2009 to 2016, from 83.7 percent in 2009 to 80.8 percent in 2016. States in the East generally have higher occupancy rates than other states (Figure 4). Occupancy rates have been declining over time even before this period, providing some evidence of an excess supply of nursing home beds in many areas.3
Certification Category and Payer Source
Licensed nursing facilities may apply to be certified for participation in the Medicare and/or Medicaid program on a voluntary basis. Facilities may apply to participate in: (1) only the Medicaid (Title XIX) program, (2) only the Medicare (Title XVIII) program, or (3) the Medicare/Medicaid dually certified (Titles XVIII and XIX) program. Since 1991, the Medicare program classified facilities as skilled nursing facilities (SNFs), while Medicaid-certified facilities are designated as “nursing facilities” (NFs). Certification requirements are detailed in federal regulations at 42 CFR Part 483. Federal Medicare rules allow for all or part of a facility to be certified.
The percentage of Medicare and Medicaid patients in a facility is an important factor in not only revenue sources but also other aspects of a facility. Nursing facilities have historically considered Medicaid reimbursement rates to be low and prefer Medicare and private pay patients.4 Higher Medicaid reimbursement rates have been associated with higher staffing and higher care quality.5,6,7
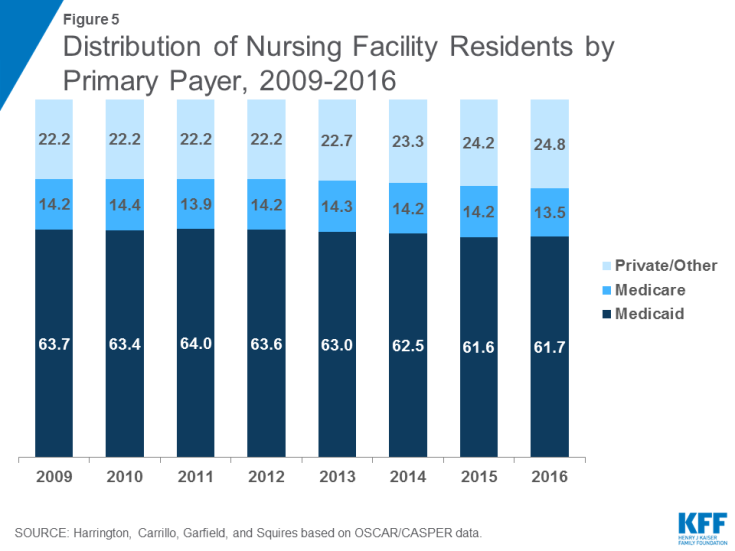
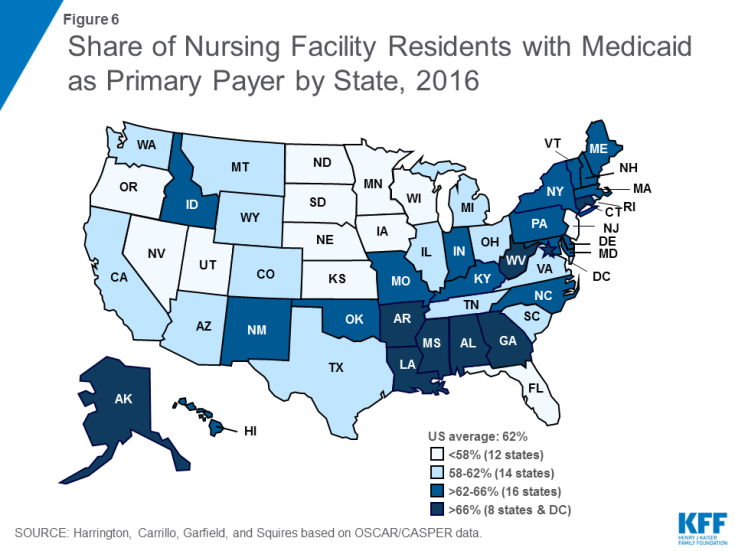
The vast majority (96.2%) of beds were dually certified by both Medicare and Medicaid in 2016, with very few certified for only Medicare (2.3%) or only Medicaid (1.6%) (See Supplemental Tables for additional detail). While most beds are dually certified, Medicaid is the primary payer source for most certified nursing facility residents (Figure 5 and Table 3). Medicaid may become the primary payer of nursing facility services once residents have exhausted or spent down personal assets paying for care. In 2016, 61.7 percent of total residents had Medicaid as their primary payer (down slightly from 63.7 in 2009), which equates to more than 832,000 people nationwide at any given time (Table 4). States in the East, particularly the Southeast, have higher shares of residents with Medicaid as their primary payer than other states (Figure 6). Medicare, which covers only short stays in nursing facilities, was primary payer for 13.5 percent of the total residents in 2016, compared to 14.2% in 2009. Private payers (primarily out-of-pocket payments from residents) and other sources are the primary payer for the remainder of residents (24.8% in 2016).
Ownership and Affiliation
One of the major debates in research circles is whether the proprietary nature of the nursing facility industry affects process and outcomes in terms of quality of care. Research studies of ownership and quality show that for-profit facilities generally have lower overall quality of care.8,9 There are higher rates of deficiencies in for-profit facilities and chains than non-profit and government facilities.10 Thus, proprietary ownership and chains may be associated with lower staffing levels and poorer process and outcome measures.
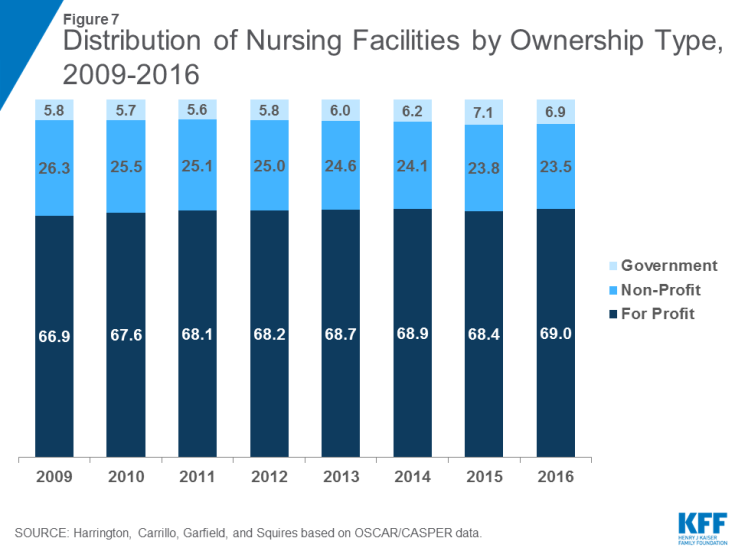
Nursing facility ownership patterns show that the large majority of nursing facilities were proprietary in the 2009-2016 period. In 2016, 69.0 percent of surveyed facilities were for-profit facilities, while 23.5 were non-profit facilities and 6.9 were government owned (Figure 7 and Table 5). The share of nursing facilities that are for-profit has increased slightly over time, while the share that is non-profit has declined slightly over time.
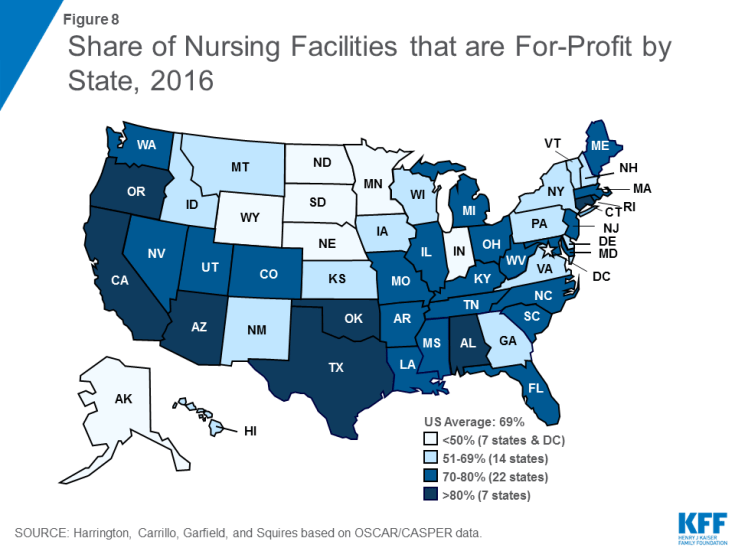
Ownership patterns vary widely across states (Figure 8). Alaska, Indiana, and Wyoming had relatively high shares (>33%) of facilities that were government owned in 2016. More than half of facilities in Alaska, the District of Columbia, Minnesota, North Dakota, and South Dakota were non-profit facilities in 2016. In Alabama, Arizona, California, Connecticut, Oklahoma, Oregon, and Texas, more than 80 percent of facilities were for-profit in 2016.
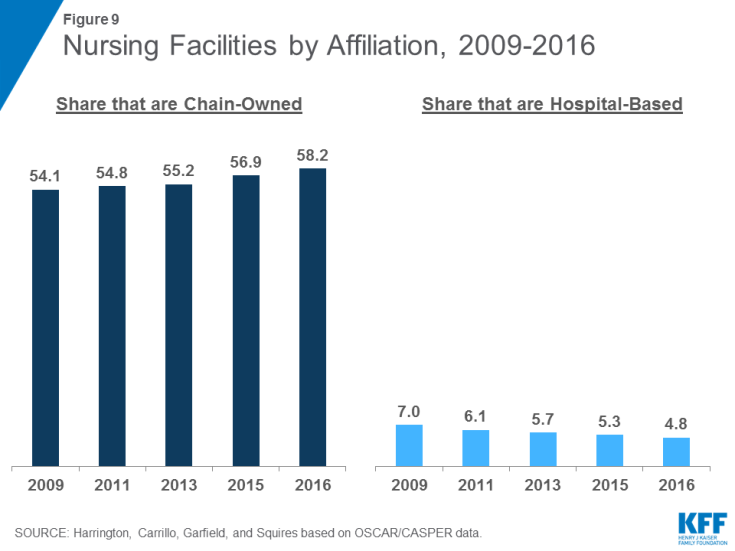
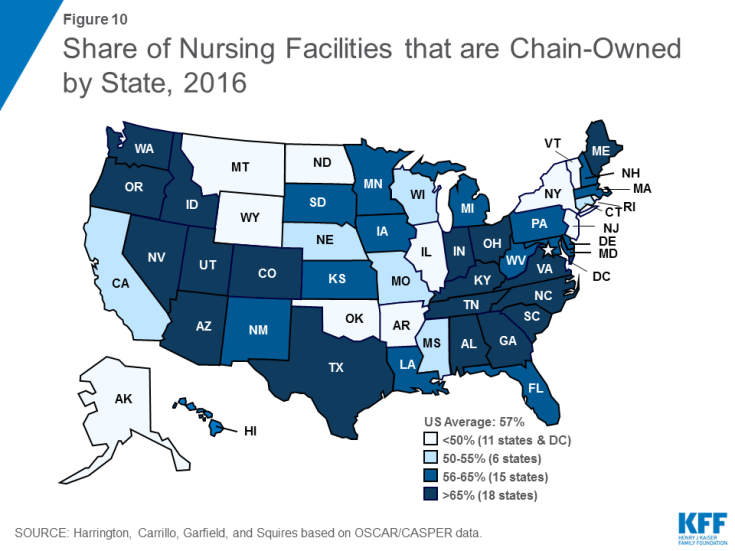
Hospital-based nursing facilities may have higher quality of care because they have more Medicare patients (with associated higher reimbursement rates) and higher staffing levels. The share of facilities that are certified as hospital-based has decreased slightly over time, from 7.0 percent in 2009 to 4.8 percent of all facilities in 2016 (Figure 9). This decline continues an earlier pattern that occurred after the introduction of the Medicare prospective payment system for nursing facilities in 1998. More than half (58.2 percent) of facilities in 2016 were owned or leased by multi-facility organizations (chains that have two or more facilities), a slight increase since 2009 (54.1%). The share of nursing facilities that are chain-owned varies by state (Figure 10).
It is important to note that other facility characteristics are also associated with quality. Having accreditation may be positively associated with higher staffing levels and with higher quality of care. The existence of dedicated special care units, such as those for persons with Alzheimer’s disease, may also be associated with higher quality of care because of higher staffing levels. Large size facilities have been associated with lower quality, although findings are mixed.11 Larger facilities tend to have lower staffing and perhaps have more difficulty in managing the quality of care.
Resident Groups/ Family Groups
Under federal regulations, nursing facility residents have the right to form organized resident groups, which meet regularly to discuss and offer suggestions about policies and procedures affecting residents’ care, treatment, and quality of life; to support each other; to plan resident and family activities; to participate in educational activities or for any other purposes. Facilities also may have organized groups of family members who meet regularly to discuss issues about residents’ care, treatment, and quality of life. In 2016, most facilities (96%) had resident groups (See Supplemental Tables for more detail), though a smaller share (22.6%) report having family groups. The share of facilities with family groups has declined over time. Those facilities with organized residents groups or organized family groups may have higher quality of care.12

