Medicare Part D in Its Ninth Year: The 2014 Marketplace and Key Trends, 2006-2014
Section 1: Part D Enrollment and Plan Availability
Beneficiary Participation in Part D
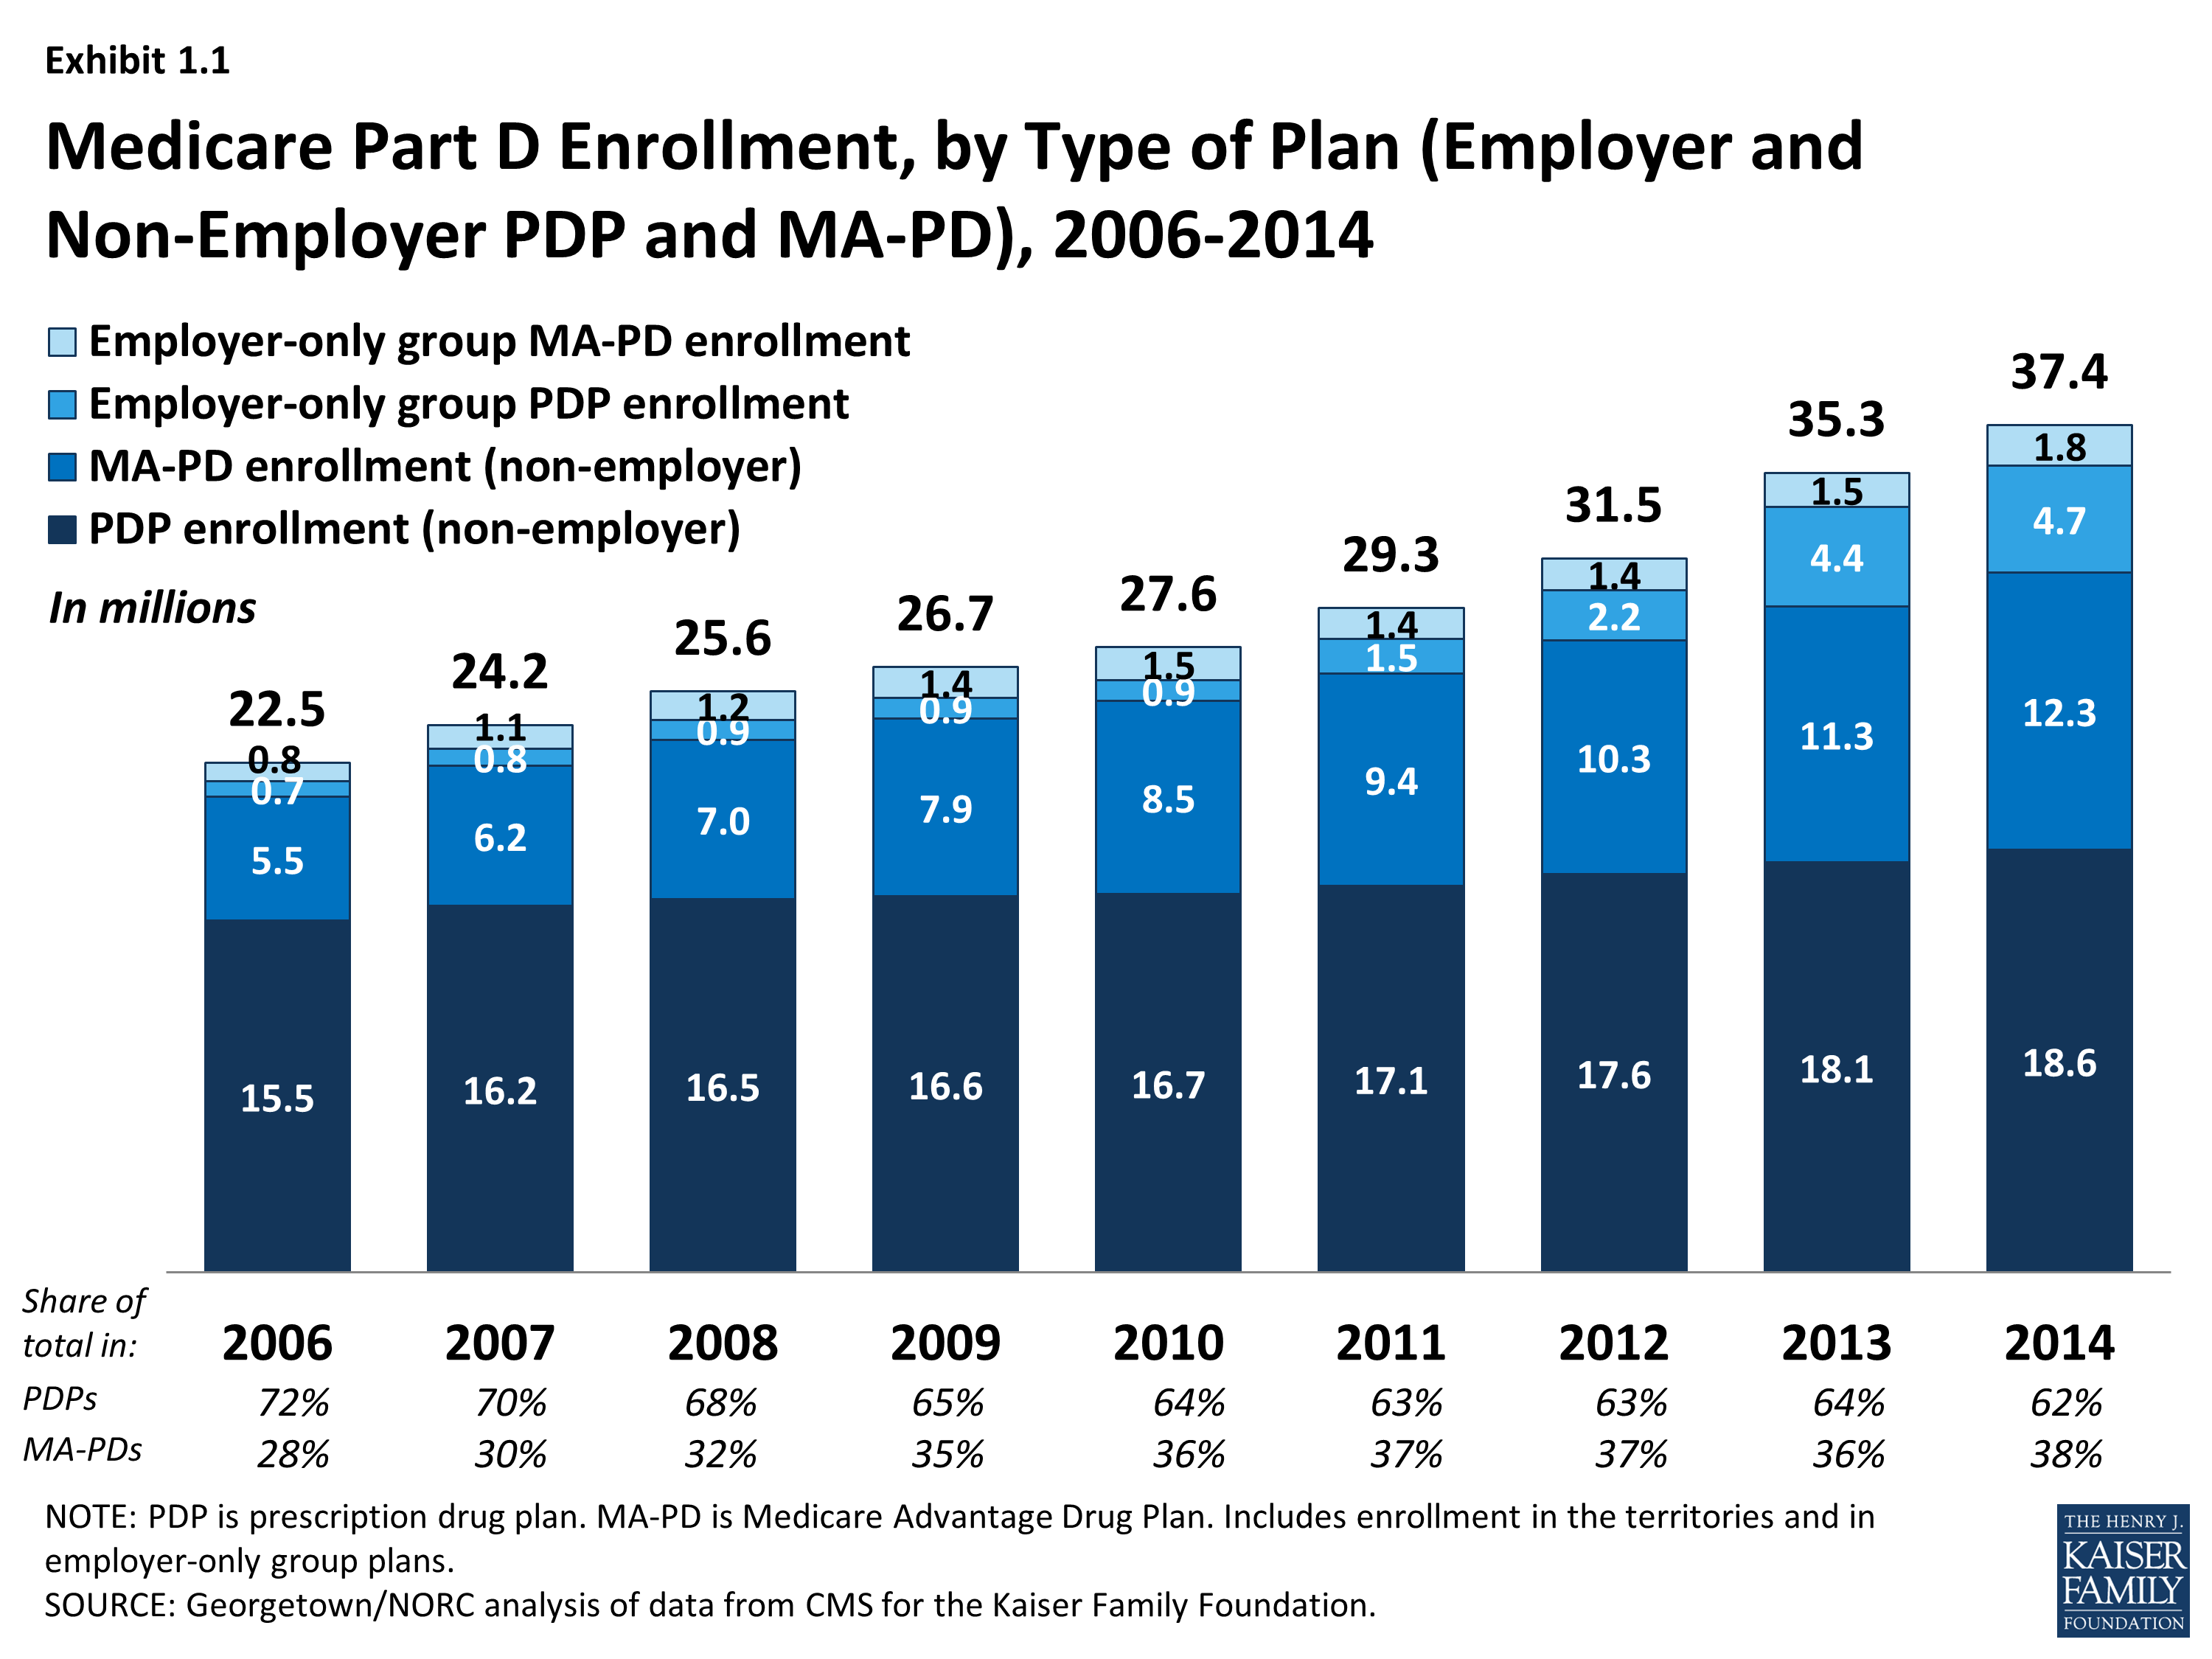
More than 37 million Medicare beneficiaries are enrolled in a Part D plan, either a PDP or MA-PD in 2014, representing 70 percent of all eligible Medicare beneficiaries. This is an increase of 2 million beneficiaries since 2013 and of 15 million beneficiaries since 2006 when only 53 percent of eligible beneficiaries were enrolled (Exhibit 1.1). About half of this increase comes from additional enrollment in MA-PD plans, which is likely a mix of enrollees new to Part D and those who switched from PDPs to MA-PD plans. About one-fourth of the increase in 2014 is higher PDP enrollment, and another one-fourth is enrollment in employer-only Part D plans.
The 5.5 percent enrollment increase from 2013 to 2014 is lower than the average annual increase of 6.5 percent since the program’s start in 2006. Above-average growth in the two previous years was mainly a result of increased enrollment of retirees in employer-only Part D plans.1 Although many beneficiaries who are not enrolled in Part D plans have drug coverage from former employers or some other type of coverage equivalent to Part D, about 12 percent of Medicare beneficiaries are estimated to have no drug coverage whatsoever.2
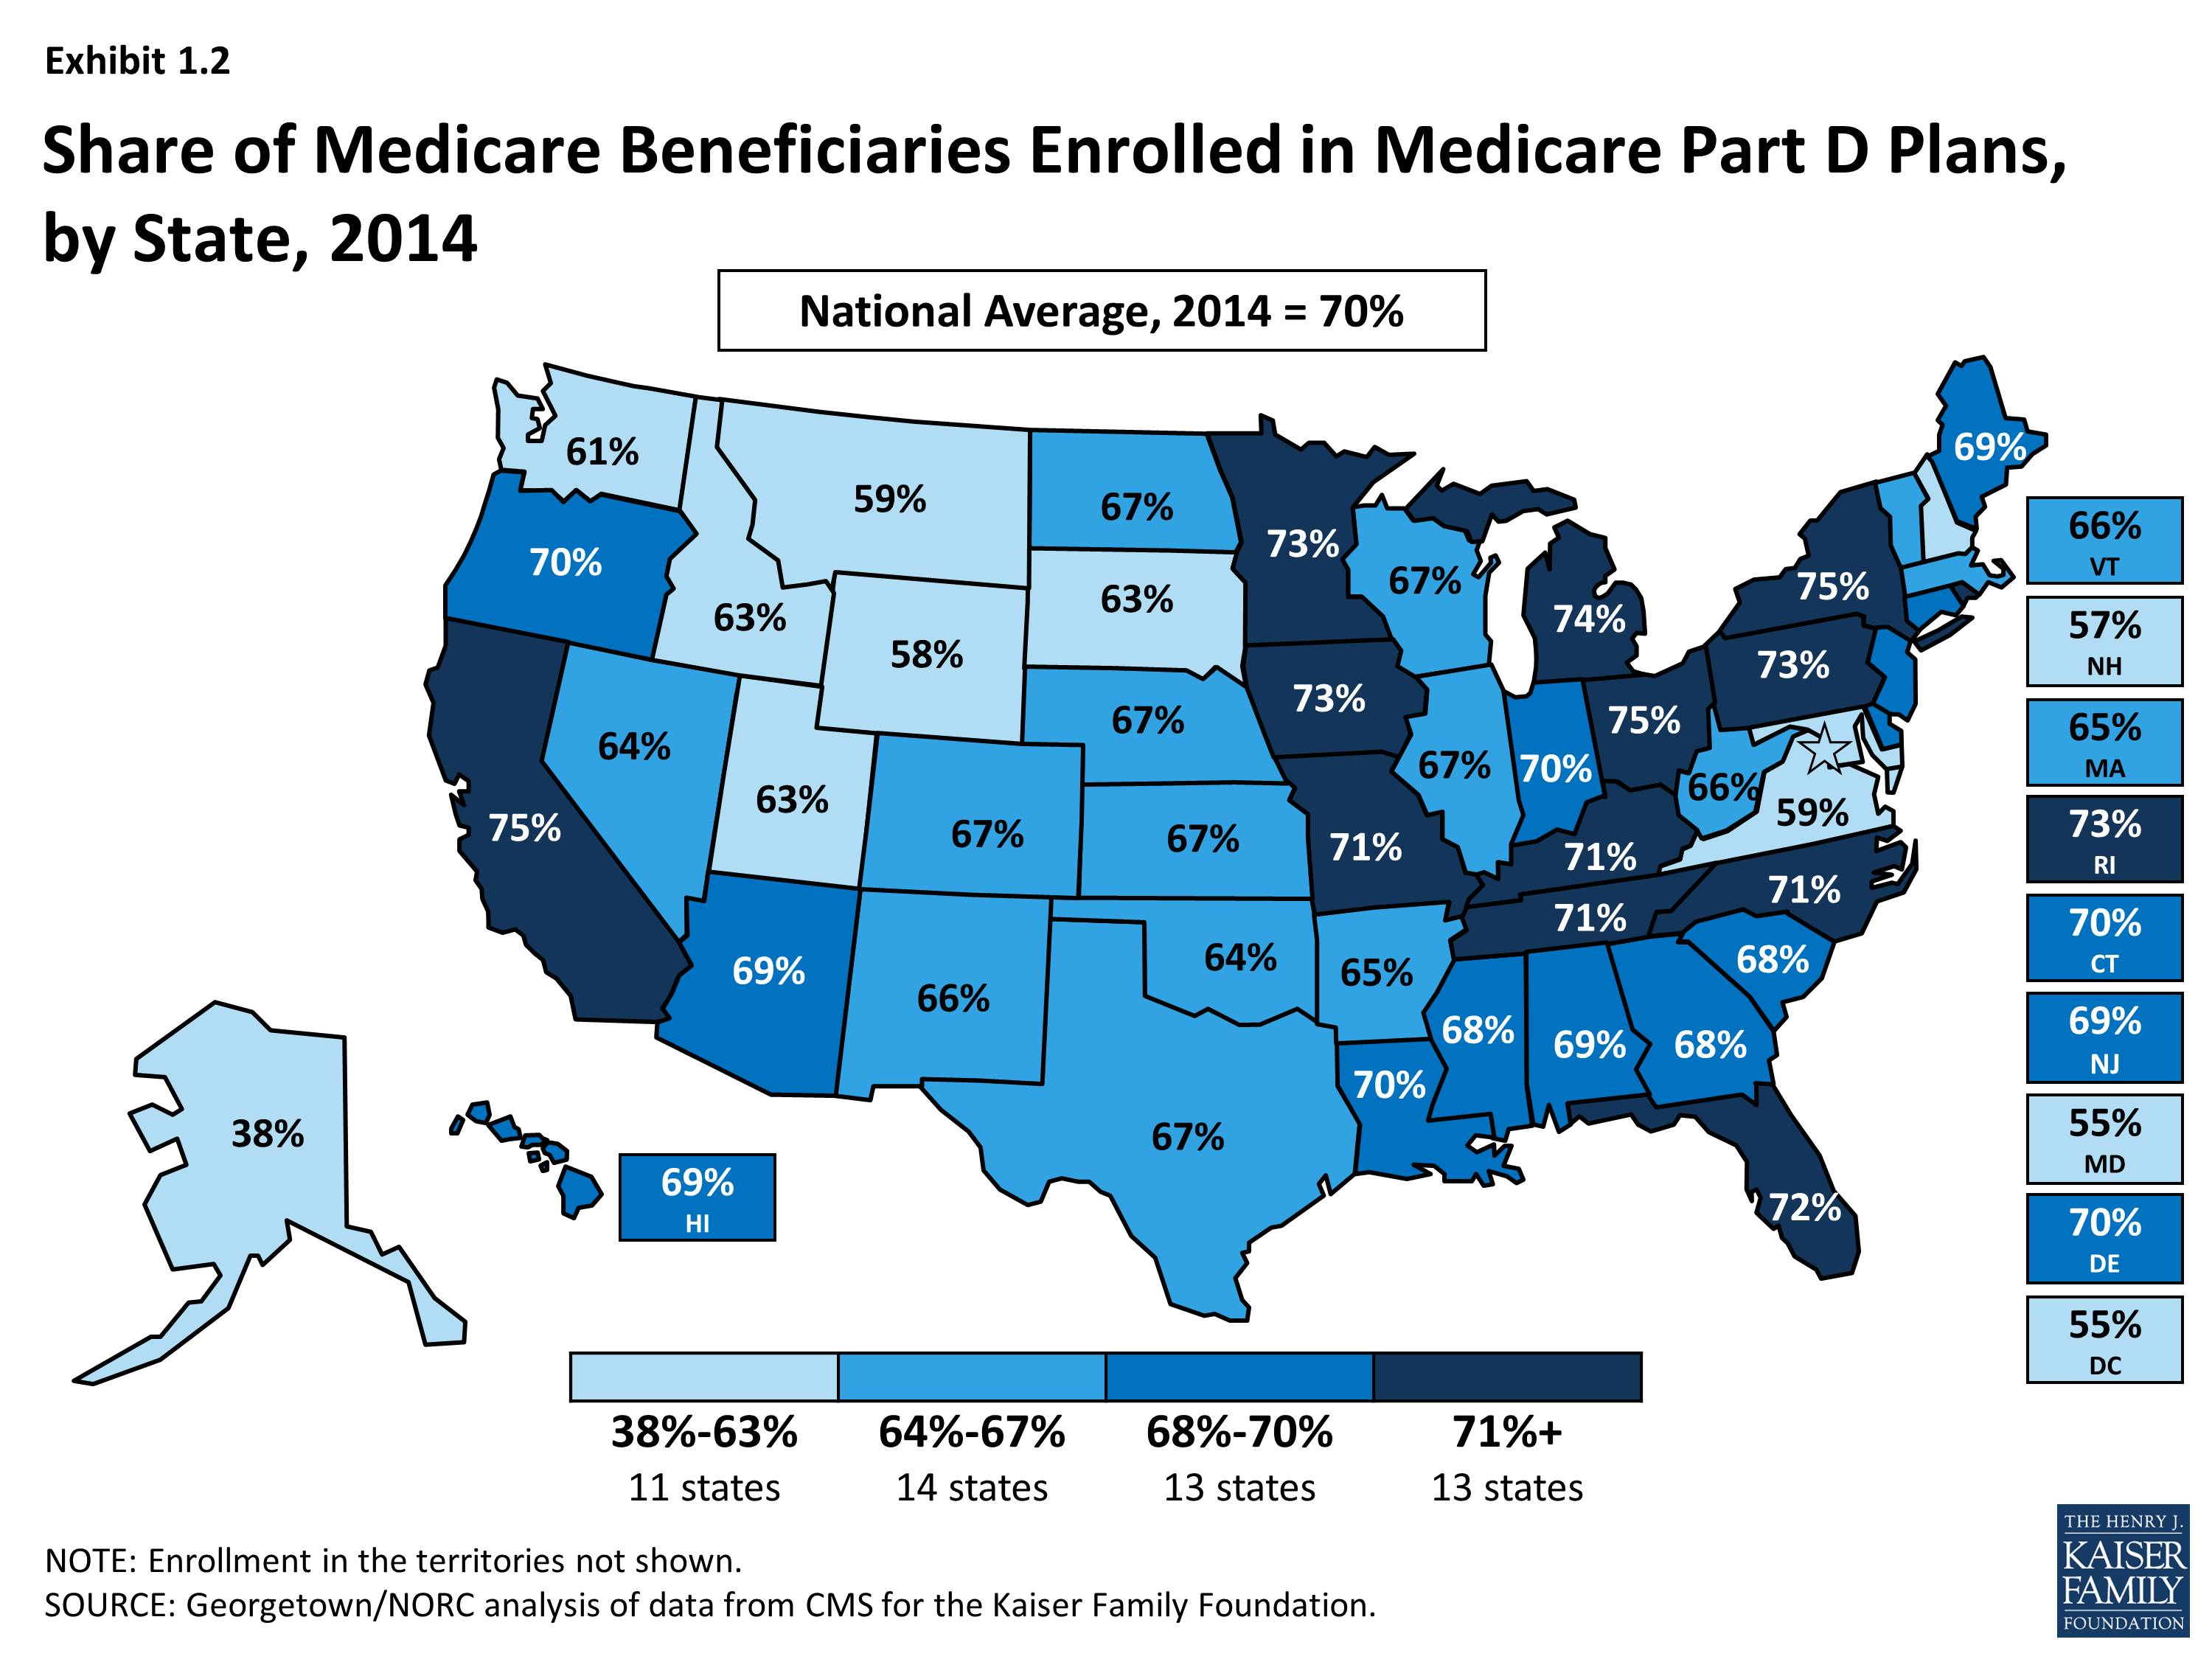
The share of Medicare beneficiaries with Part D coverage varies considerably by state (Exhibit 1.2). States with the highest shares of Part D enrollment are California, New York, and Ohio, each with 75 percent of Medicare beneficiaries in Part D. Six states and the District of Columbia have fewer than 60 percent of their residents on Medicare in Part D plans. These states include several with high shares of federal employment; federal retirees get drug coverage outside Part D through the Federal Employees Health Benefits Program. The lowest level is 38 percent in Alaska.
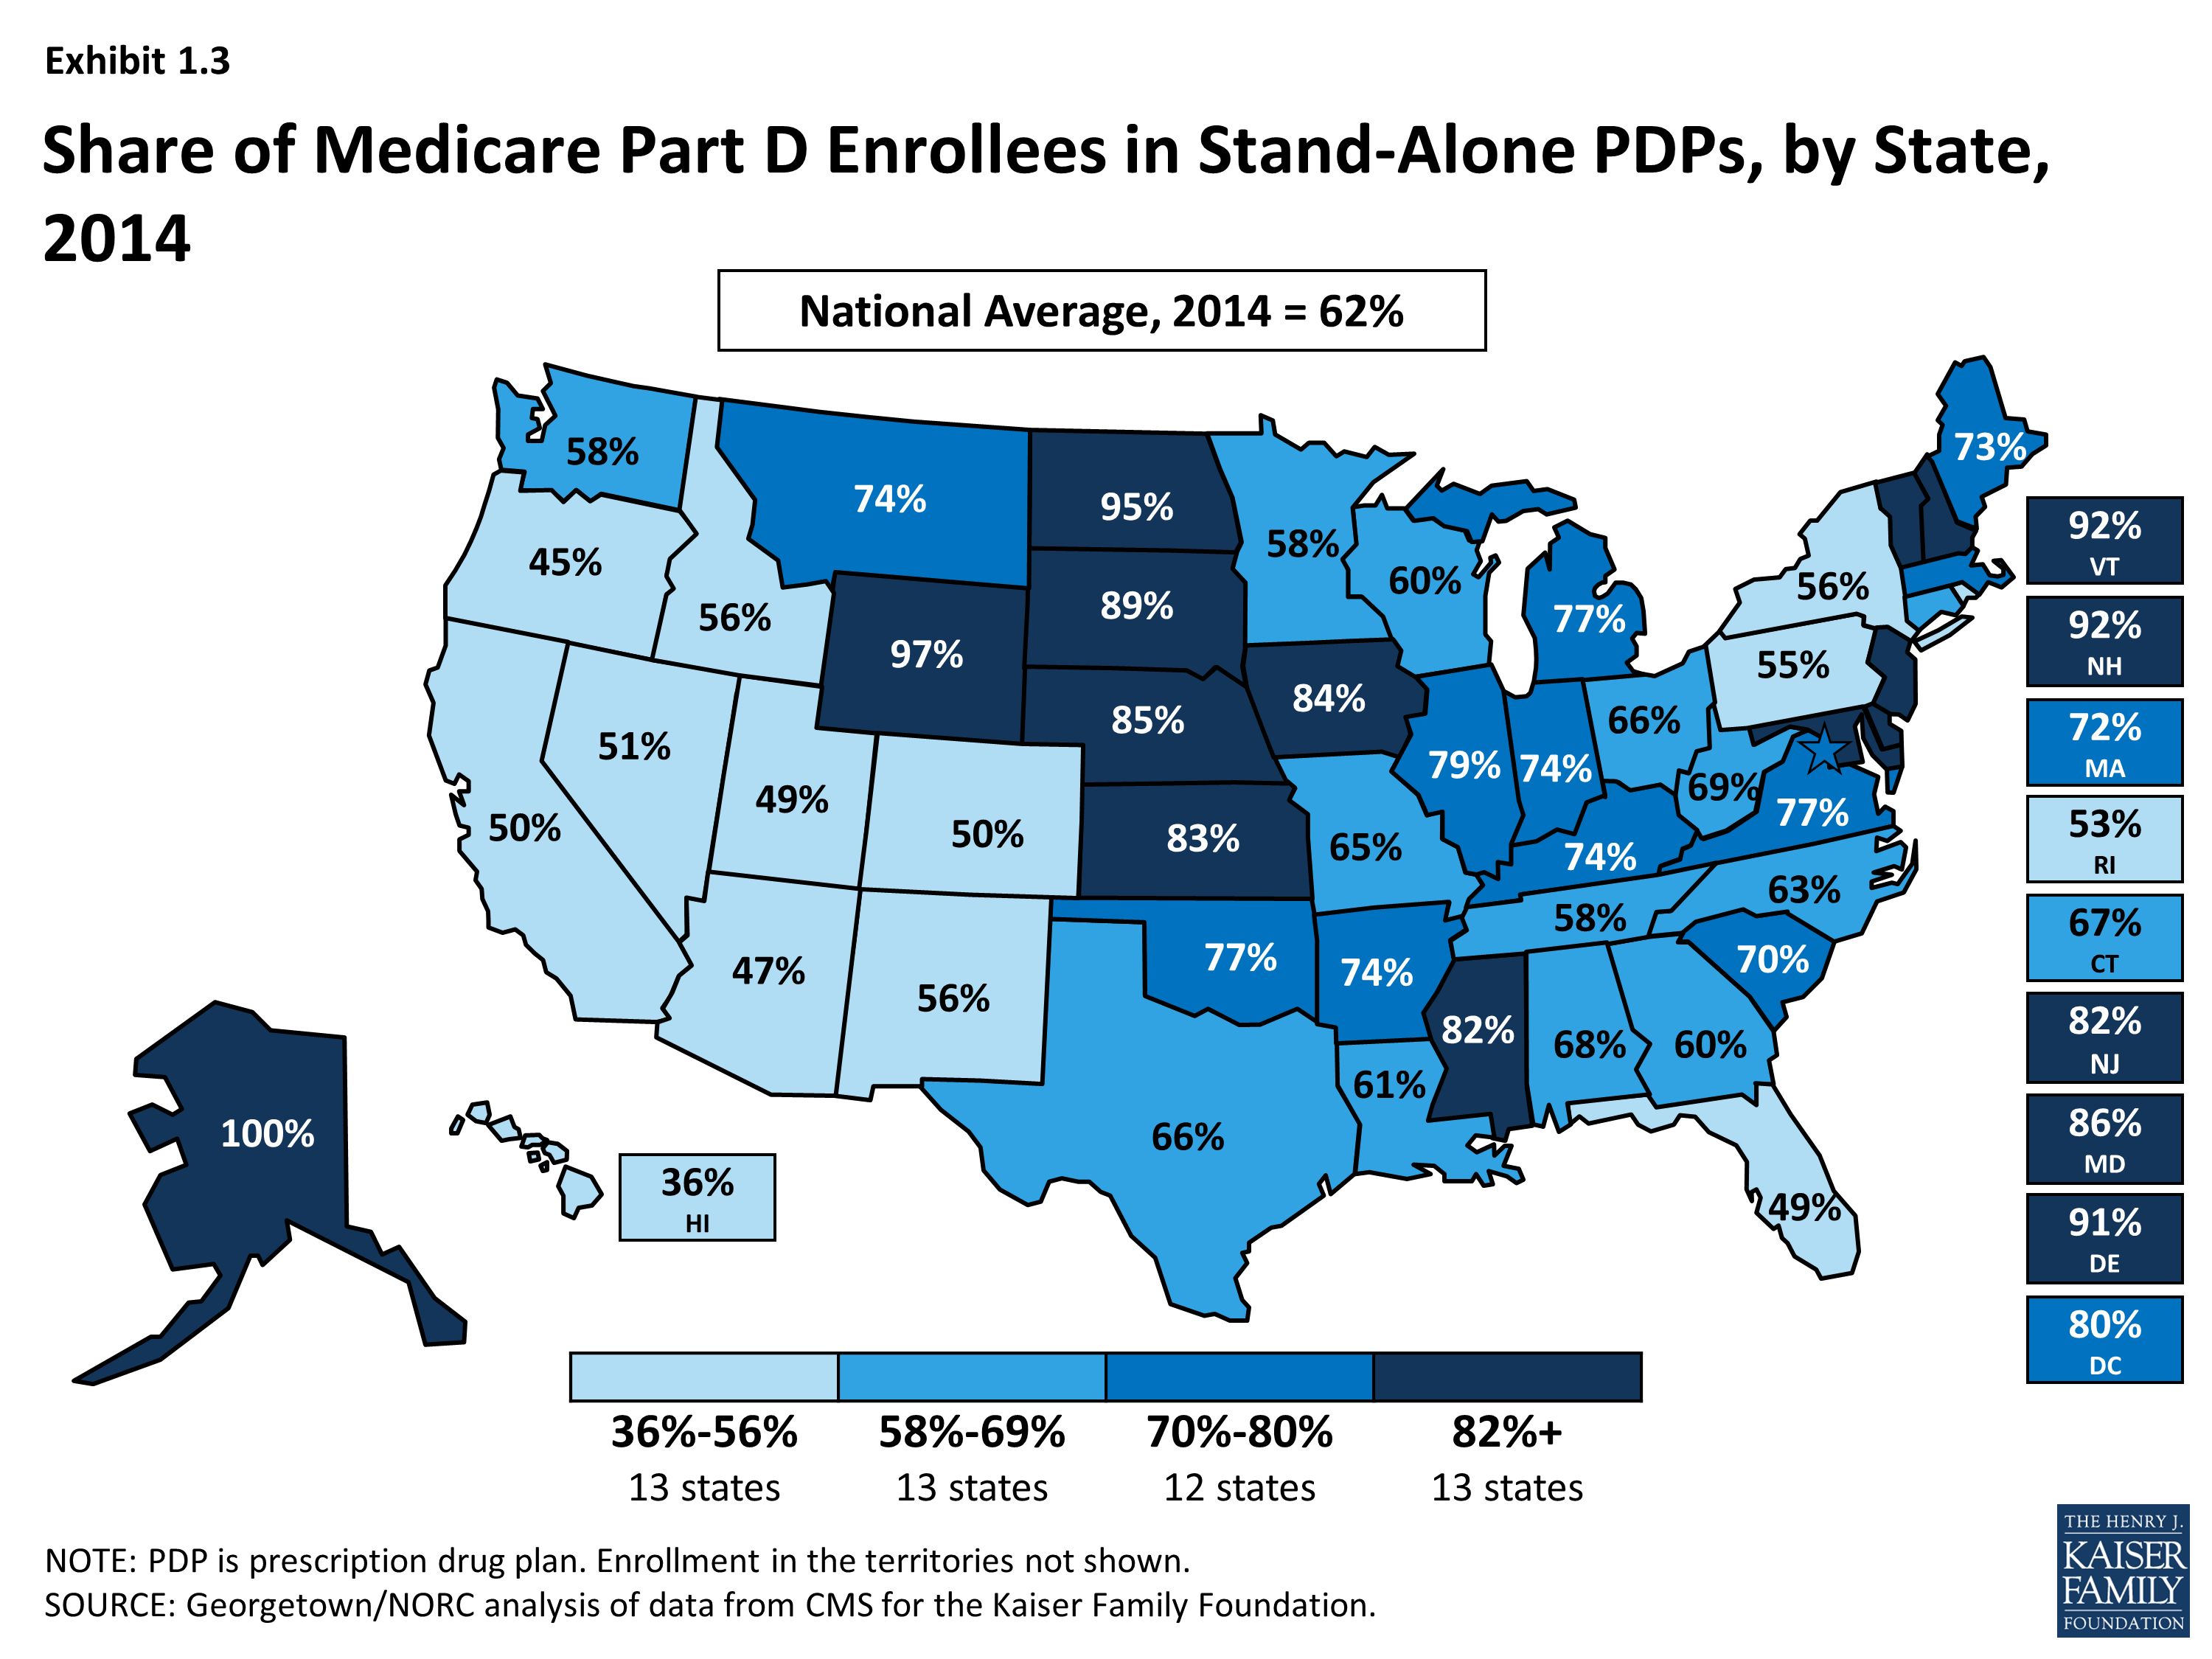
Nationally, about 62 percent of Part D enrollees are in PDPs; the remaining 38 percent are in MA-PDs, with considerable variation by state (Exhibit 1.3), Appendix Table 1, Appendix Table 2. PDP enrollment accounted for 72 percent of total enrollment in 2006, but this share has been declining over time as MA-PD plan enrollment has grown more rapidly than PDP enrollment in recent years. From 2006 to 2014, non-employer MA-PD plan enrollment grew by 10.5 percent annually, whereas non-employer PDP enrollment grew by only 2.3 percent annually. PDPs account for 100 percent of Part D enrollees in Alaska and more than 90 percent of enrollees in five other states with low populations (Delaware, New Hampshire, North Dakota, Vermont, and Wyoming). By contrast, MA-PD plans account for half or more of Part D enrollees in seven states. The highest shares of Part D enrollees in Medicare Advantage drug plans are in California, Florida, and several western states.
Between 2011 and 2014, total enrollment in employer-only Part D plans more than doubled from 2.9 million to 6.5 million beneficiaries (Exhibit 1.4), Appendix Table 2. Total enrollment in employer-only Part D plans in 2014 is more than four times the level in 2006, the program’s first year. The biggest increase was between 2012 and 2013, when enrollment in these plans grew 63 percent. The growth rate slowed in 2014, but enrollment in employer-only plans still grew 10 percent.
The major impetus for this growth was a provision in the ACA that eliminated the tax deductibility of the 28 percent Retiree Drug Subsidy (RDS), effective in 2013.3 This subsidy, paid to employers who provide creditable prescription drug coverage to Medicare beneficiaries, was included in the original Part D legislation to encourage employers to maintain existing drug coverage for their retirees. In 2006, 7.2 million Medicare beneficiaries were covered in retiree health plans that received the RDS (with an average subsidy payment of $527 per person in 2006, rising to a projected $605 in 2014). With the changed tax status of the RDS, enrollment in subsidized retiree plans dropped to 3.3 million in 2012, and the Medicare Trustees project a drop to 0.9 million by 2019.4
Most employers that no longer elected to receive the subsidy after the change in tax treatment have shifted their retirees to employer-only Part D plans. Most of the new enrollment was in employer-only PDPs. In 2013, enrollment was up 99 percent in employer-only PDPs and just 7 percent in employer-only MA-PD plans. In 2014, growth slowed overall, and there was a somewhat greater increase in employer MA-PD plan enrollment.
Continuity of Part D Plan Offerings
About one out of four PDPs that participated in Part D in its first year are still in the market today. There are 398 PDPs operating under the same contract and plan identification number in 2014 as in 2006. About one-fourth of these PDPs operate under the same plan name, while others have similar names. For example, what was originally the AARP MedicareRx Plan, sponsored by UnitedHealth, is now called AARP MedicareRx Preferred. Others have changed as a result of acquisitions; for example, the PDP offered as PacifiCare Comprehensive Plan in 2006 is now UnitedHealth’s AARP MedicareRx Enhanced PDP. About one-third of these continuously operating PDPs have changed their benefit type; in most cases, PDPs originally offering the basic benefit now offer an enhanced benefit.
These continuously operating PDPs accounted for nearly half of all PDP enrollees in 2006, and 57 percent in 2014. Most of the remaining PDP enrollees are in other plans offered by sponsors that have participated in Part D since 2006. Of the six plan sponsors that entered the Part D after the program’s first year, none have attracted a significant market share. The most successful new entrant has been Envision RxPlus, which held a 2.5 percent share of PDP enrollment in 2013, declining to 2 percent in 2014.
Part D Market Concentration
In 2014, the ten largest sponsors of Part D plans account for more than three-fourths of all enrollees, three firms account for half of all enrollees, and UnitedHealth alone accounts for more than one in five Part D enrollees (including 22 percent of PDP enrollees and 21 percent of MA-PD plan enrollees) (Exhibit 1.5).5 This pattern of a few plan sponsors having a substantial share of Part D enrollment has held over the program’s first nine years. The ten largest Part D plan sponsors in 2014 have enrolled 29.5 million beneficiaries in either a stand-alone PDP or an MA-PD plan (Exhibit 1.6).6 The share of enrollment in the ten largest plans in 2014 (79 percent) is higher than in 2006 (69 percent). In 2006, the top three firms also accounted for about half of all enrollees.
Six of the top ten firms in 2014 sponsor both stand-alone PDPs and MA-PD plans. Kaiser Permanente is the only sponsor among the top ten that offers only MA-PD plans, and Wellpoint is the only other firm with more MA-PD enrollees than PDP enrollees. CVS Caremark, Express Scripts, and Envision offer only PDPs. Other than Kaiser Permanente, at least 40 percent of each of the top firms’ enrollment is in PDPs.
Enrollment growth since 2006 for CVS Caremark, Express Scripts, Aetna, and CIGNA is due largely to acquisitions of other plan sponsors. CVS Caremark has used an acquisitions strategy to become the third largest sponsor in the Part D marketplace—despite being suspended for new enrollment in its PDP products in the annual enrollment period for 2014. The parent company now includes 5 of the 18 firms that had the most enrollees in 2006.7 CIGNA and Aetna have grown their Part D market shares through similar acquisitions strategies. Express Scripts has grown both through its recent acquisition of Medco, but also through the overall increase in enrollment in employer-only plans since the RDS tax status change. Four plan sponsors dominate the employer-only segment of the Part D market, collectively accounting for about two-thirds of all enrollees in employer-only Part D plans: Express Scripts (34 percent), CVS Caremark (18 percent), UnitedHealth (8 percent), and Kaiser Permanente (7 percent).
UnitedHealth and Humana have been the two largest Part D plan sponsors from the start of the program, but their combined share of enrollment has dropped from 45 percent in 2006 to 38 percent in 2014. UnitedHealth, due in part to its successful marketing relationship with AARP, has maintained its top position for all nine years of the program and has seen its enrollment grow by about 43 percent since 2006. Humana has maintained a strong Part D presence, due in part to offering the lowest PDP premiums in 2006 and retaining many of those enrollees over time despite premium increases for its older plans. While higher-than-average premium increases and a loss of LIS benchmark status in most regions contributed to a drop in Humana’s Part D enrollment between 2006 and 2010, Humana’s introduction of new PDPs in 2011 and 2014 reversed this decline, contributing to a net enrollment gain of 40 percent in Humana’s Part D plans between 2006 and 2014.
There has been more turnover in the list of top Part D plans than plan sponsors, with only four of the top ten PDPs or MA-PD plans by enrollment in 2014 among the top ten in 2006. These four plans are UnitedHealth’s AARP MedicareRx Preferred PDP, Humana’s Enhanced PDP, CVS Caremark’s SilverScript Basic PDP, and Kaiser Permanente’s Senior Advantage HMO (Exhibit 1.7). Within many plan sponsors’ offerings, there have been significant changes in enrollment, partly due to sponsors adding, dropping, or consolidating plans. Two of the top plans in 2014 (Humana’s Preferred Rx PDP and UnitedHealth’s AARP MedicareRx Saver Plus PDP) are recent entries to the market, featuring low initial premiums and preferred pharmacy networks.
The growth pattern among the largest PDP sponsors illustrates some of the different strategies used since the start of the program (Exhibit 1.8). UnitedHealth has been the largest PDP sponsor since 2006, and Humana has generally been the second largest. CVS Caremark has used an acquisition strategy to move solidly into the third position. Aetna and CIGNA have moved higher up in recent years, also through acquisitions.
Enrollment shifts among the top plans and plan sponsors also have been brought about by automatic re-assignment of LIS beneficiaries. If a plan loses its designation as a benchmark plan (available to LIS beneficiaries for zero premium), CMS reassigns certain beneficiaries to a benchmark plan offered by the same sponsor if one is available; otherwise they are switched at random to a benchmark plan offered by another sponsor.
The most popular plans vary considerably by region. UnitedHealth has the largest PDP in a majority of regions in 2014.8 The firm’s AARP MedicareRx Preferred PDP is the largest PDP in 25 regions, and the SilverScript Basic PDP is the largest in 7 regions. Humana Preferred Rx PDP holds the lead in Colorado, and MedicareBlue Rx Standard PDP has the largest share of enrollment in the seven-state upper Midwest region.
The most popular plans also differ for non-LIS and LIS beneficiaries. In addition to being the largest plan overall, AARP MedicareRx Preferred PDP has enrolled about 30 percent of all non-LIS enrollees nationally and has the most non-LIS enrollees in 31 of 34 PDP regions (Exhibit 1.9). Local Blue Cross Blue Shield PDPs have the largest share of non-LIS enrollment in Arkansas and the upper Midwest region, and Humana’s Enhanced PDP has the most non-LIS enrollees in the Idaho/Utah region.
With the help of its acquisition strategy, CVS Caremark’s SilverScript Basic PDP dominates the LIS market with more than one-fourth of national LIS enrollment and the highest share of LIS enrollees in 26 PDP regions, despite not receiving any new enrollees during the annual enrollment period. PDPs sponsored by Humana, UnitedHealth, Aetna, and CIGNA have the most LIS enrollees in the other 8 PDP regions. Like many PDPs with high LIS enrollment, SilverScript Basic PDP has attracted only a small share (14 percent) of non-LIS enrollees. By contrast, Humana’s Preferred Rx PDP and UnitedHealth’s AARP MedicareRx Saver Plus PDPs have attracted enrollment in nearly equal shares from both non-LIS and LIS beneficiaries, and they are among the top five plans by enrollment in each category. UnitedHealth’s AARP MedicareRx Preferred PDP has more than 600,000 LIS enrollees, despite its status as an enhanced PDP that charges a premium for LIS enrollees and despite the availability of a UnitedHealth PDP with a much lower premium that would be available to LIS beneficiaries for zero premium because it qualifies as a benchmark plan in all 34 regions.
Concentration of enrollment among PDPs nationally (at the plan level), as measured by a statistical measure of market competition, has declined since 2011 as enrollment has grown in the some of the newly offered PDPs. Concentration is greater within regions than at the national level.9 Furthermore, if non-LIS and LIS beneficiaries are treated as separate markets, both are more concentrated—especially within regions.10 The most concentrated regions tend to be in the northeastern and southwestern states.
Plan Availability
Choice remains plentiful in Part D; in 2014, the average Part D enrollee had a choice of 35 PDPs and 15 MA-PD plans. The average number of PDPs per region has come down from a high of 56 in 2007 to 35 in 2014 (weighted by regional enrollment). At least 28 PDPs are offered in every region this year (excluding the territories). In 2014, virtually all beneficiaries have at least one Medicare Advantage option with drug coverage as well, and the average beneficiary has 15 options for Medicare Advantage drug plan enrollment.11
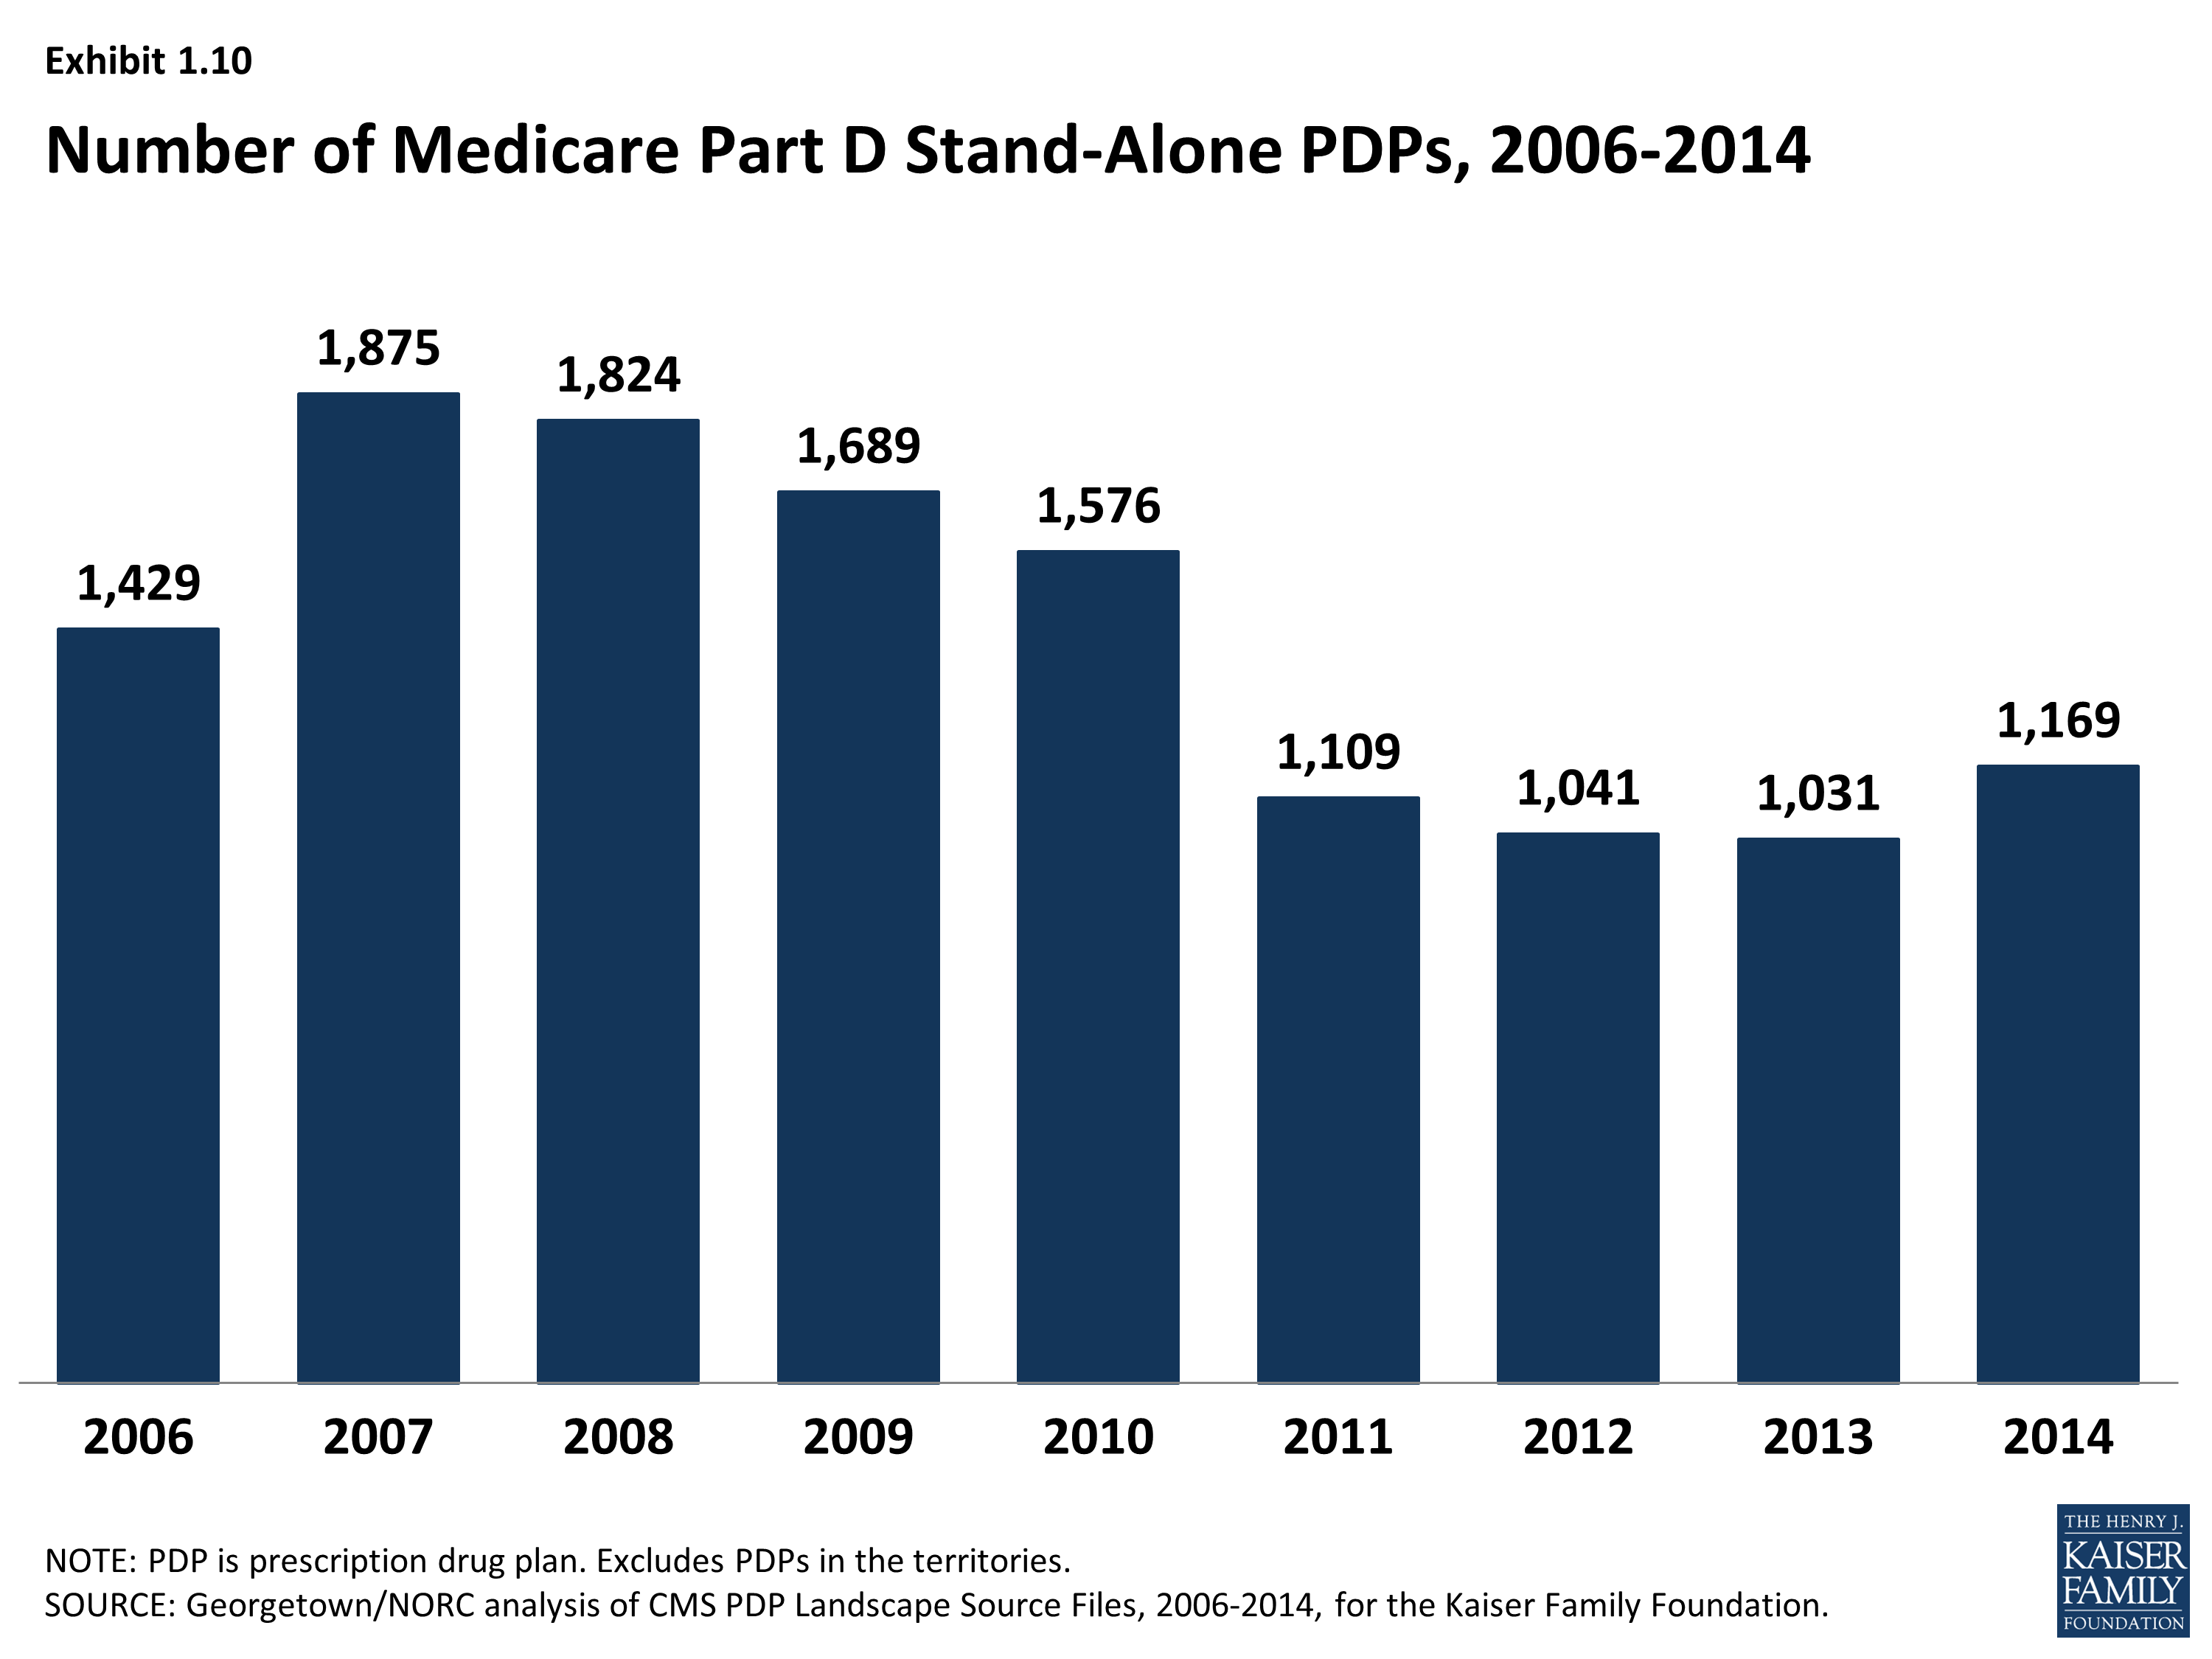
The number of PDPs offered increased somewhat between 2013 and 2014. There are 1,169 PDPs in 2014, up 13 percent compared to 2013, but still well below the number of PDPs offered between 2006 and 2010. While the number of PDPs rose sharply between 2006 and 2007, the number decreased each year until 2014 as a result of both marketplace and policy factors (Exhibit 1.10). Over its first nine years, the Part D market has witnessed several mergers between sponsoring organizations and consolidation of plan offerings by sponsors. In 2010, CMS issued regulations aimed at discouraging duplicative plan offerings and plans with low enrollment. For example, many sponsors now offer just two plan options (one basic and one enhanced) instead of the three options they had offered in previous years.
The modest increase in PDP offerings from 2013 to 2014 reflects new offerings by both existing plan sponsors and sponsors new to the program in 2014 as well as a few offsetting plan terminations. Symphonix Health is offering a new basic PDP in 30 regions, co-branded in some regions with Rite Aid pharmacies. Stonebridge Life Insurance Company offers new basic and enhanced PDPs in 33 regions under the Transamerica MedicareRx name. Together with two smaller plan sponsors, new plan sponsors offered 102 PDPs, but they attracted fewer than 700 enrollees per plan on average. Because some of these plans had premiums below the LIS benchmark amount in some regions, they received some enrollees through random assignments or reassignments by CMS (described in more detail in the section below on the Low-Income Subsidy Program). Existing plan sponsors added another 110 new PDPs to the market (some replacing existing PDPs and others replacing PDPs they had dropped a year earlier). One—Humana’s Walmart Rx PDP—attracted 660,000 enrollees (20,000 per region), but the others attracted only an average of 1,250 enrollees each. In addition, Envision RxPlus dropped the enhanced PDP it first offered in 2007, which did not attract a large number of enrollees.
Current CMS policies suggest that the number of PDPs might decline again in future years. In the call letter issued in early 2014 spelling out the terms of plan participation for the 2015 contract year, CMS reiterated the agency’s authority not to renew plans with low enrollment.12 Currently, 330 PDPs (28 percent of all PDPs in 2014) have fewer than 1,000 enrollees, the level at which CMS urges sponsors to consider plan withdrawal or consolidation; 105 of these PDPs have fewer than 100 enrollees each.13 The low-enrollment PDPs include many plans offered for the first time in 2014.
In addition to its policy on low-enrollment plans, CMS continues to maintain a policy that PDPs offered by the same sponsor must be meaningfully different from the sponsor’s other offerings. This policy encourages plan sponsors to reduce their PDP offerings, thereby simplifying the choice environment in Part D. In a rulemaking notice published in May 2014, the agency noted its intention to continue monitoring its policy on meaningful differences to determine whether changes may be necessary as the coverage gap closes.14
In 2014, 1,610 Medicare Advantage drug plans are offered, essentially the same number as the year before. The number of MA-PD plans increased by about 50 percent between 2006 and 2009, from 1,333 plans to 1,991 plans.15 However, the availability of MA-PD plans has fallen since then; the 1,610 MA-PD plans offered in 2014 is about 19 percent lower than at the peak.
Medicare Part D Enrollment, by Type of Plan (Employer and Non-Employer PDP and MA-PD), 2006-2014
Share of Medicare Beneficiaries Enrolled in Medicare Part D Plans, by State, 2014
Share of Medicare Part D Enrollees in Stand-Alone PDPs, by State, 2014
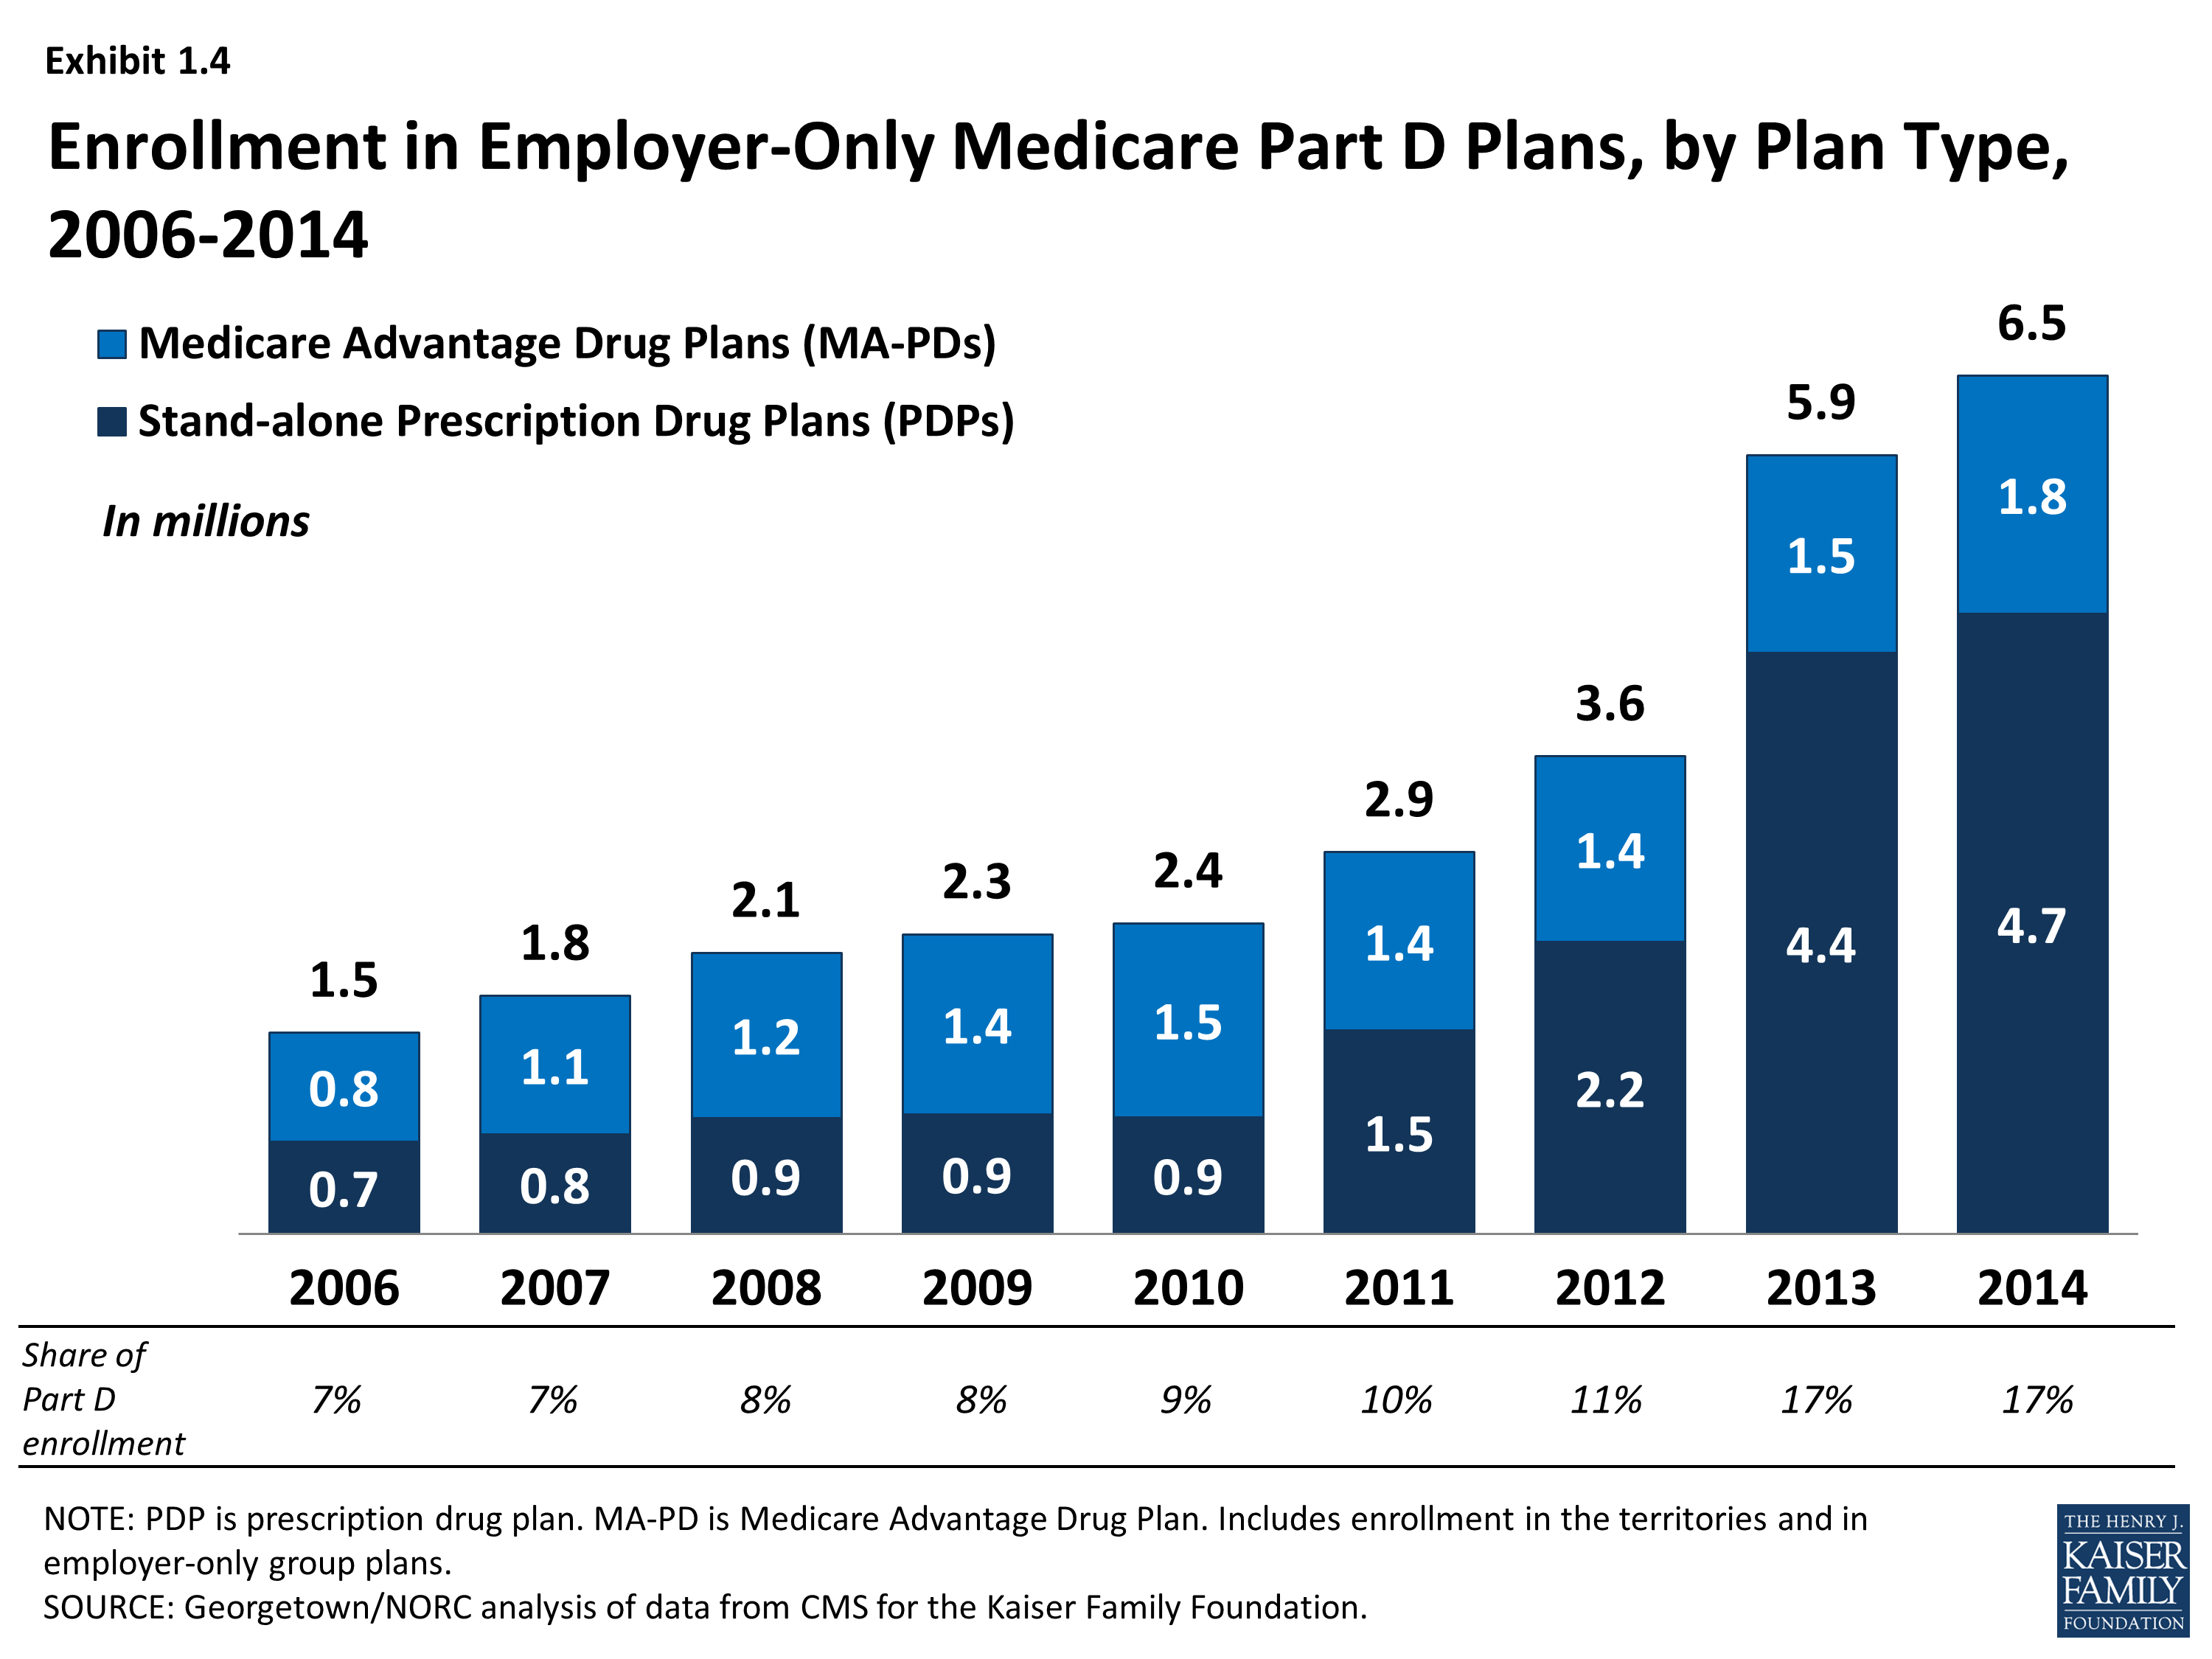
Enrollment in Employer-Only Medicare Part D Plans, by Plan Type, 2006-2014
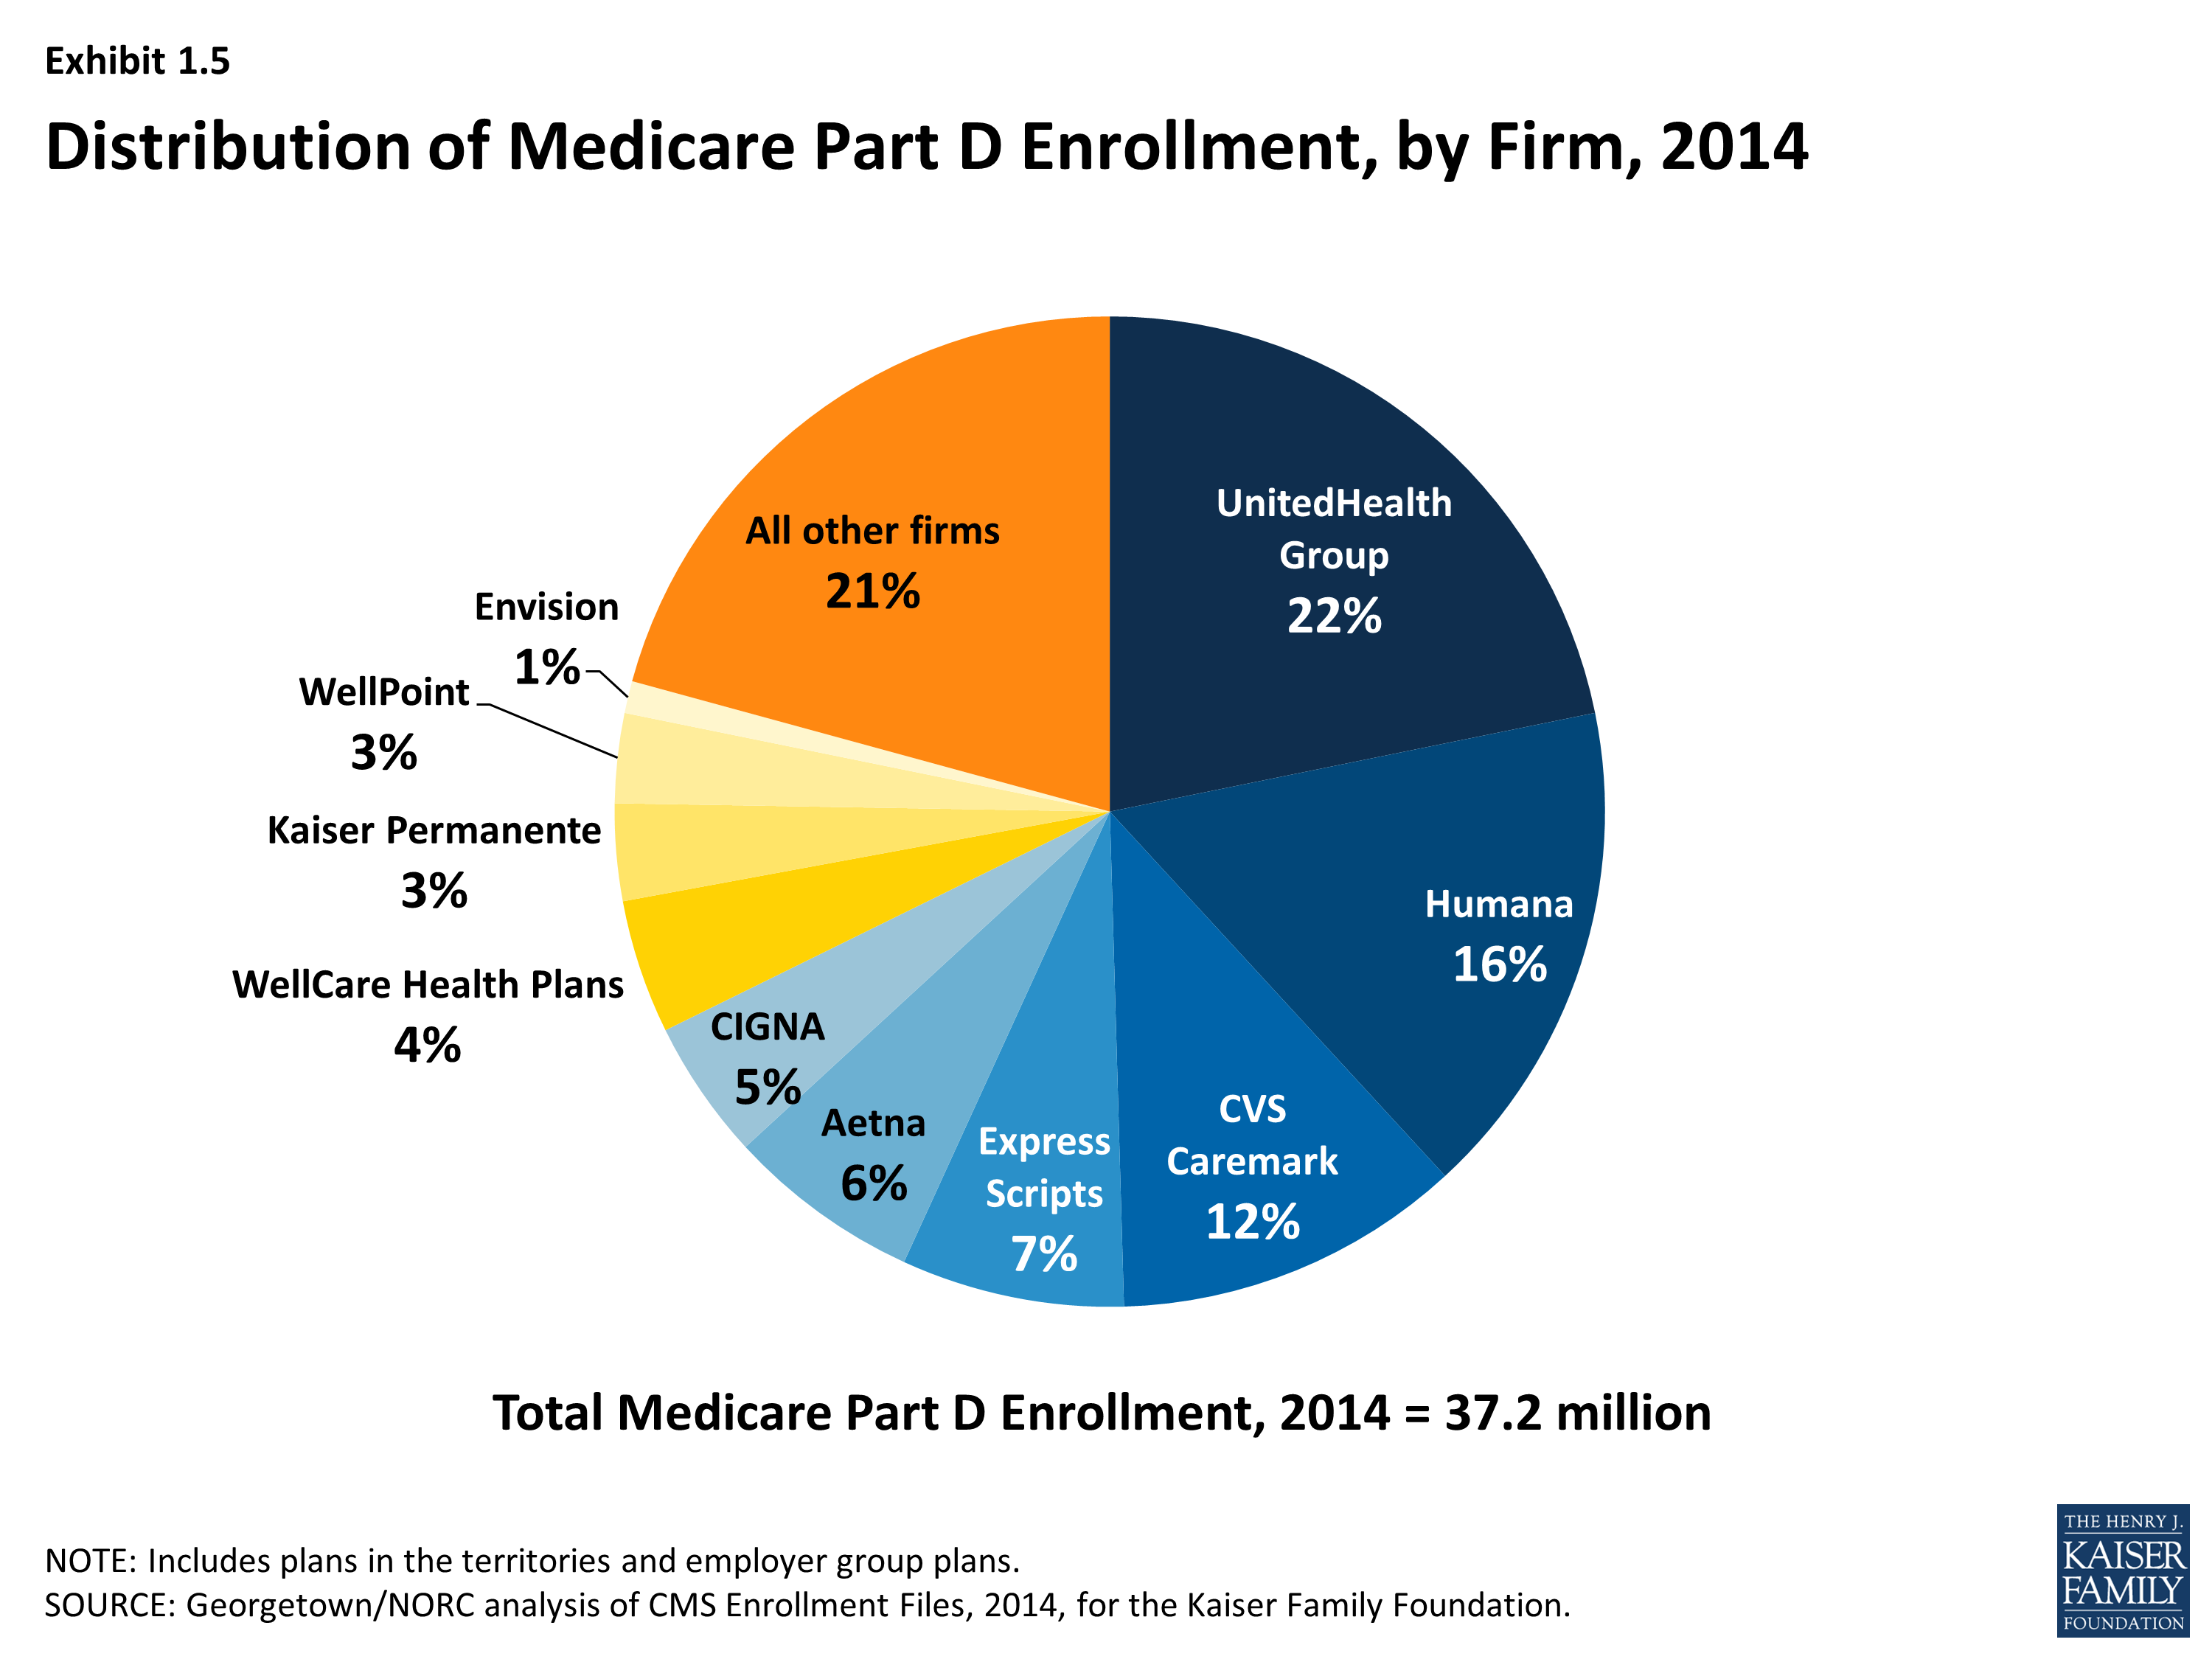
Distribution of Medicare Part D Enrollment, by Firm, 2014
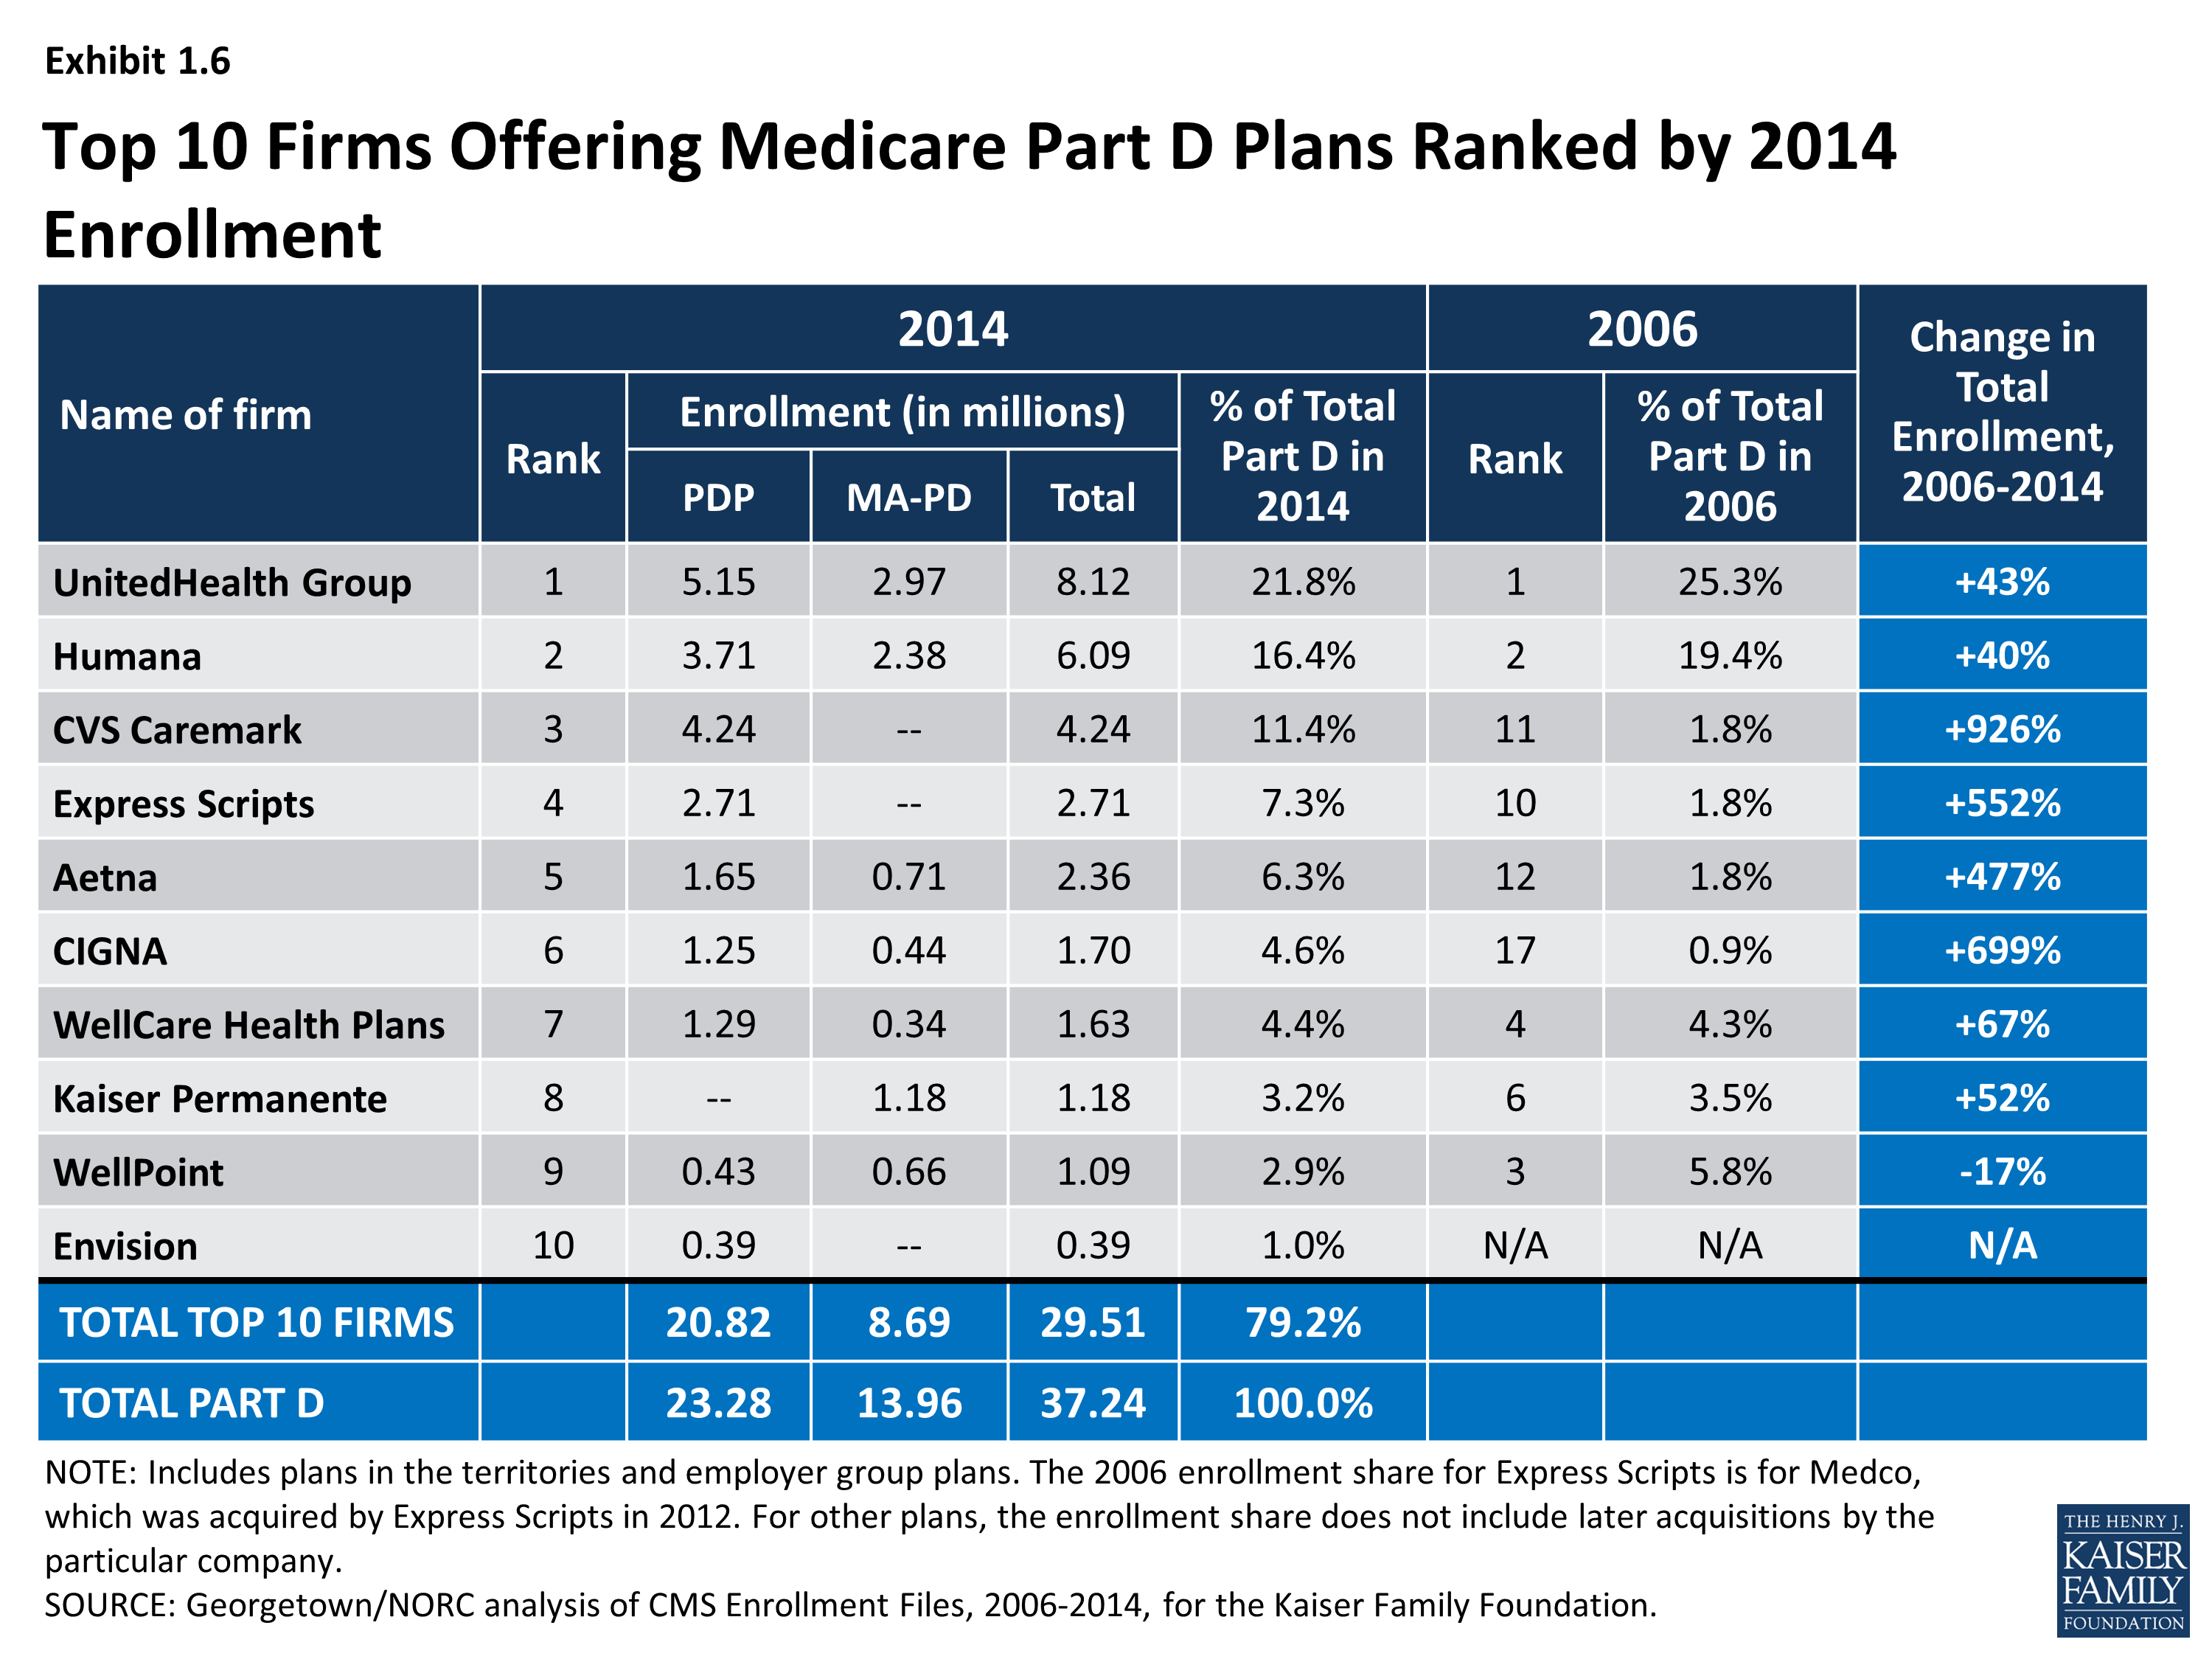
Top 10 Firms Offering Medicare Part D Plans Ranked by 2014 Enrollment

Top 10 Medicare Part D Plans Ranked by 2014 Enrollment
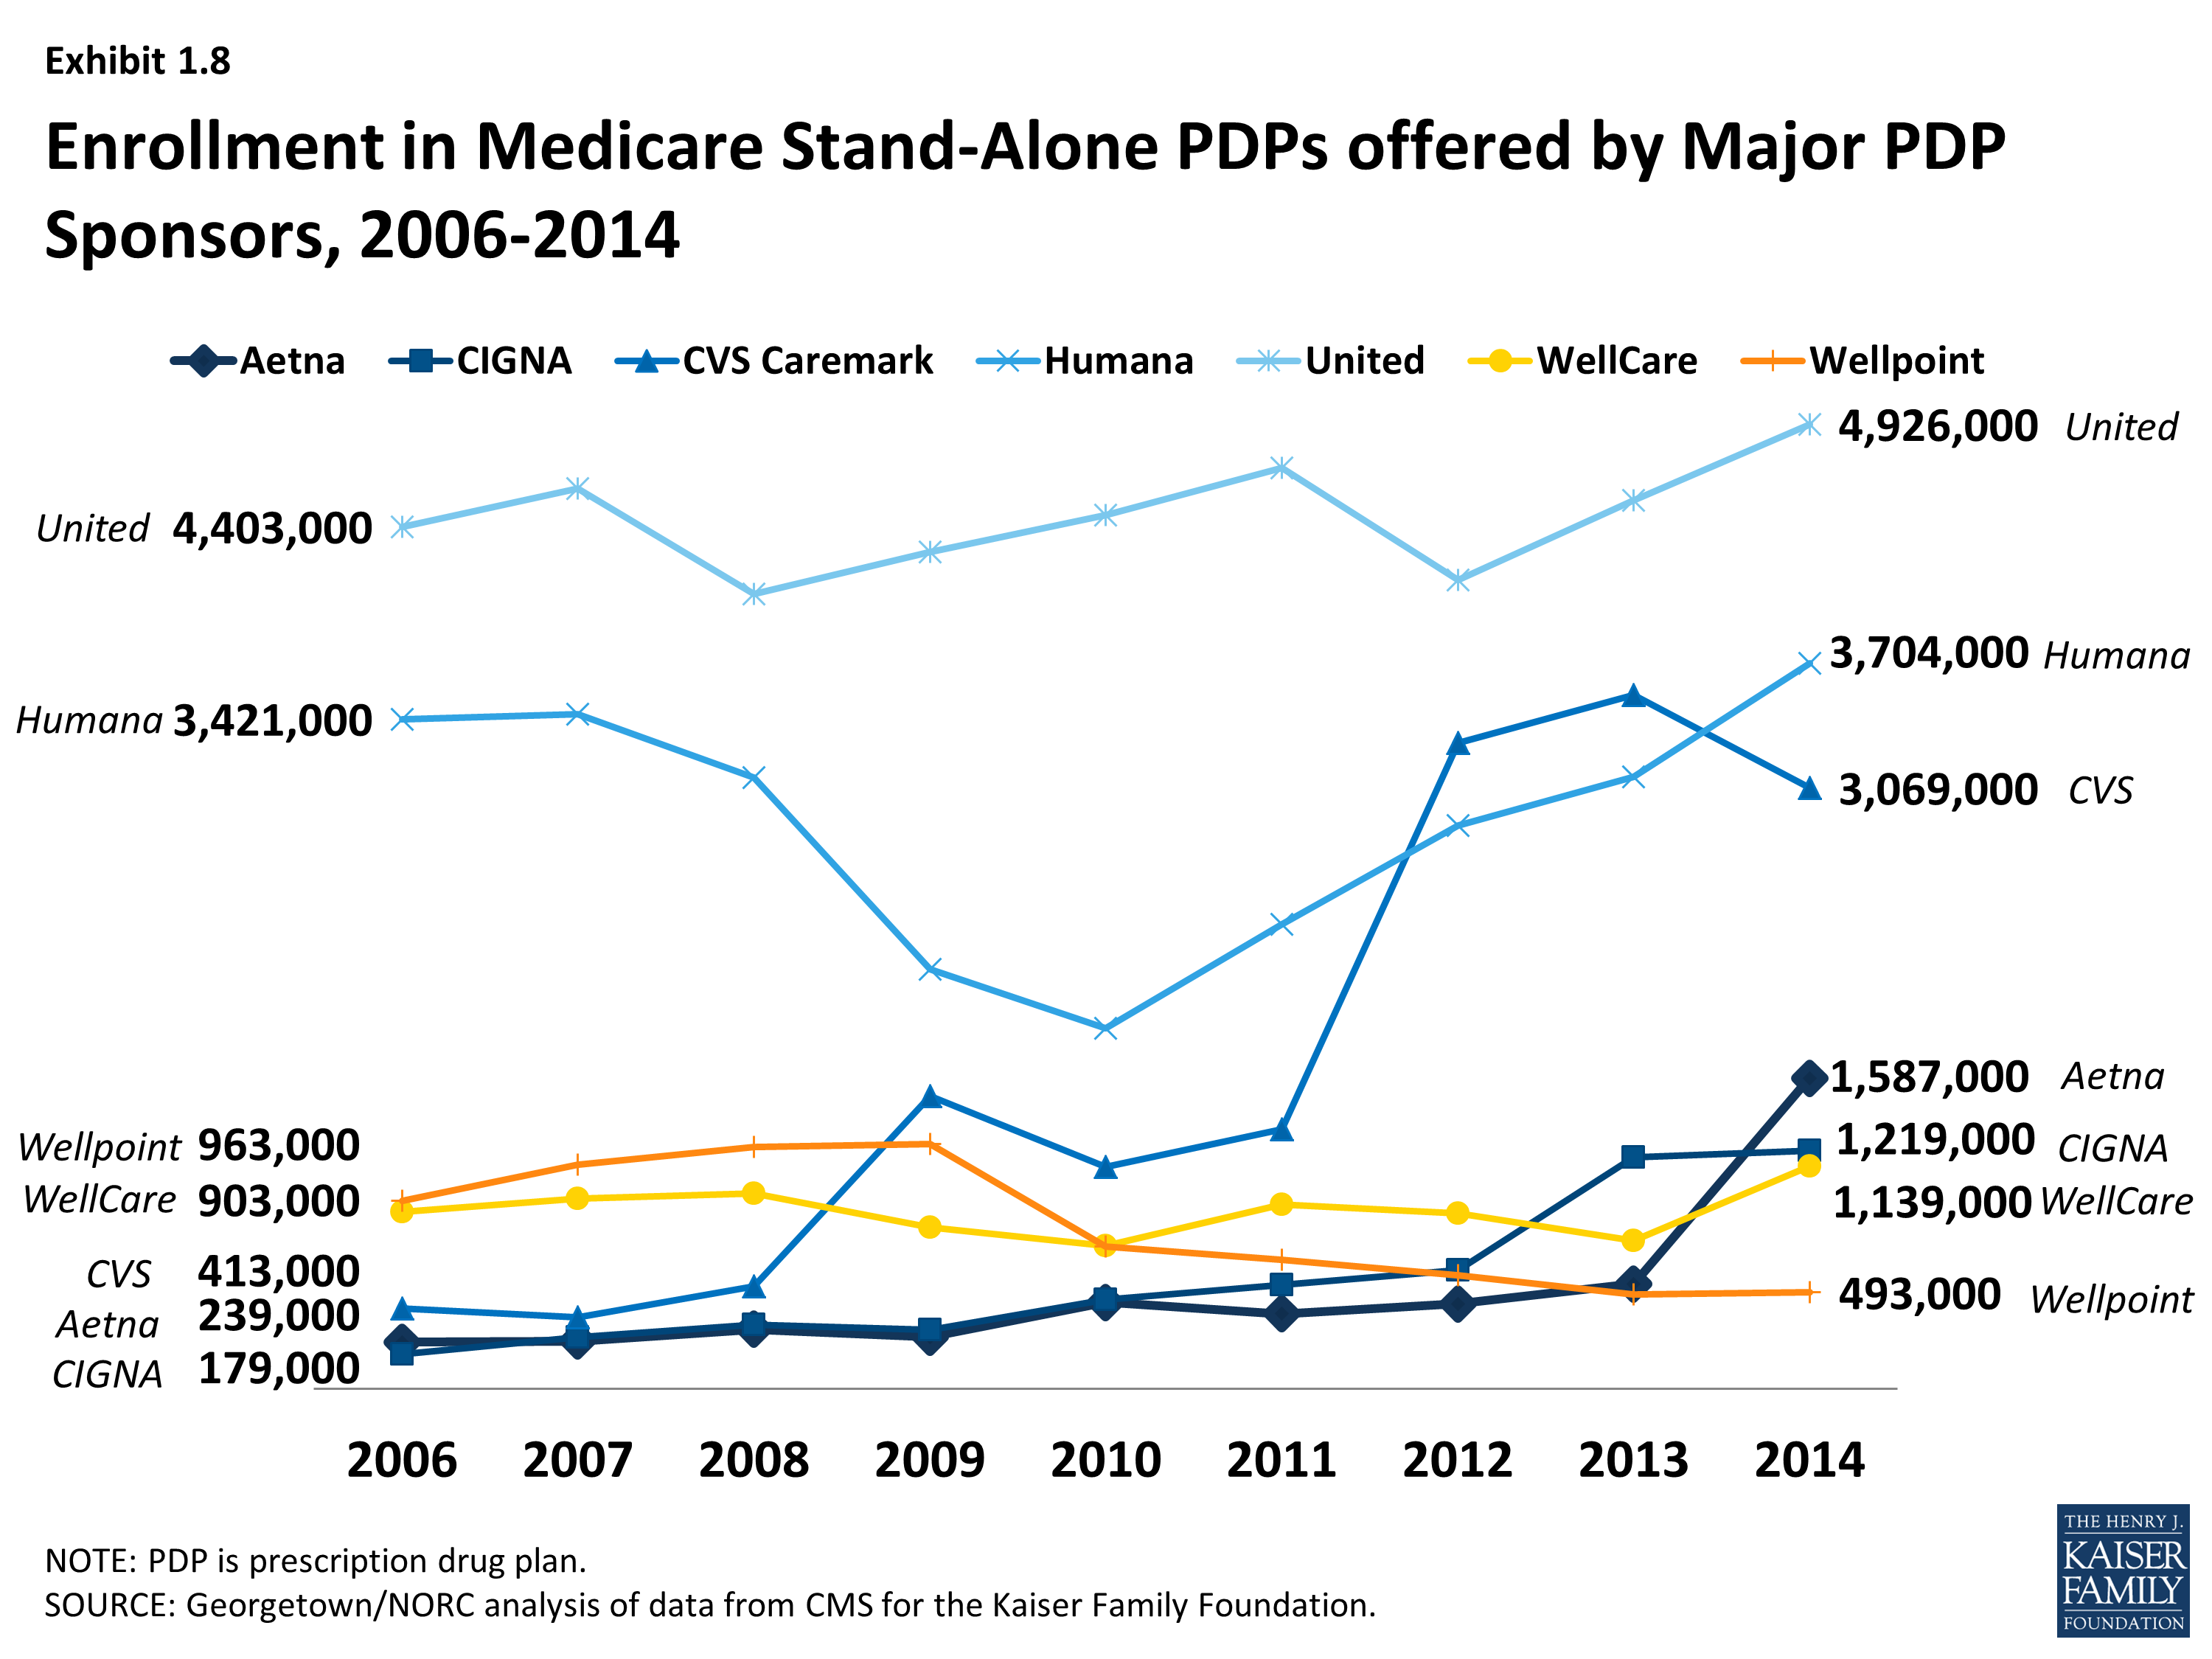
Enrollment in Medicare Stand-Alone PDPs offered by Major PDP Sponsors, 2006-2014
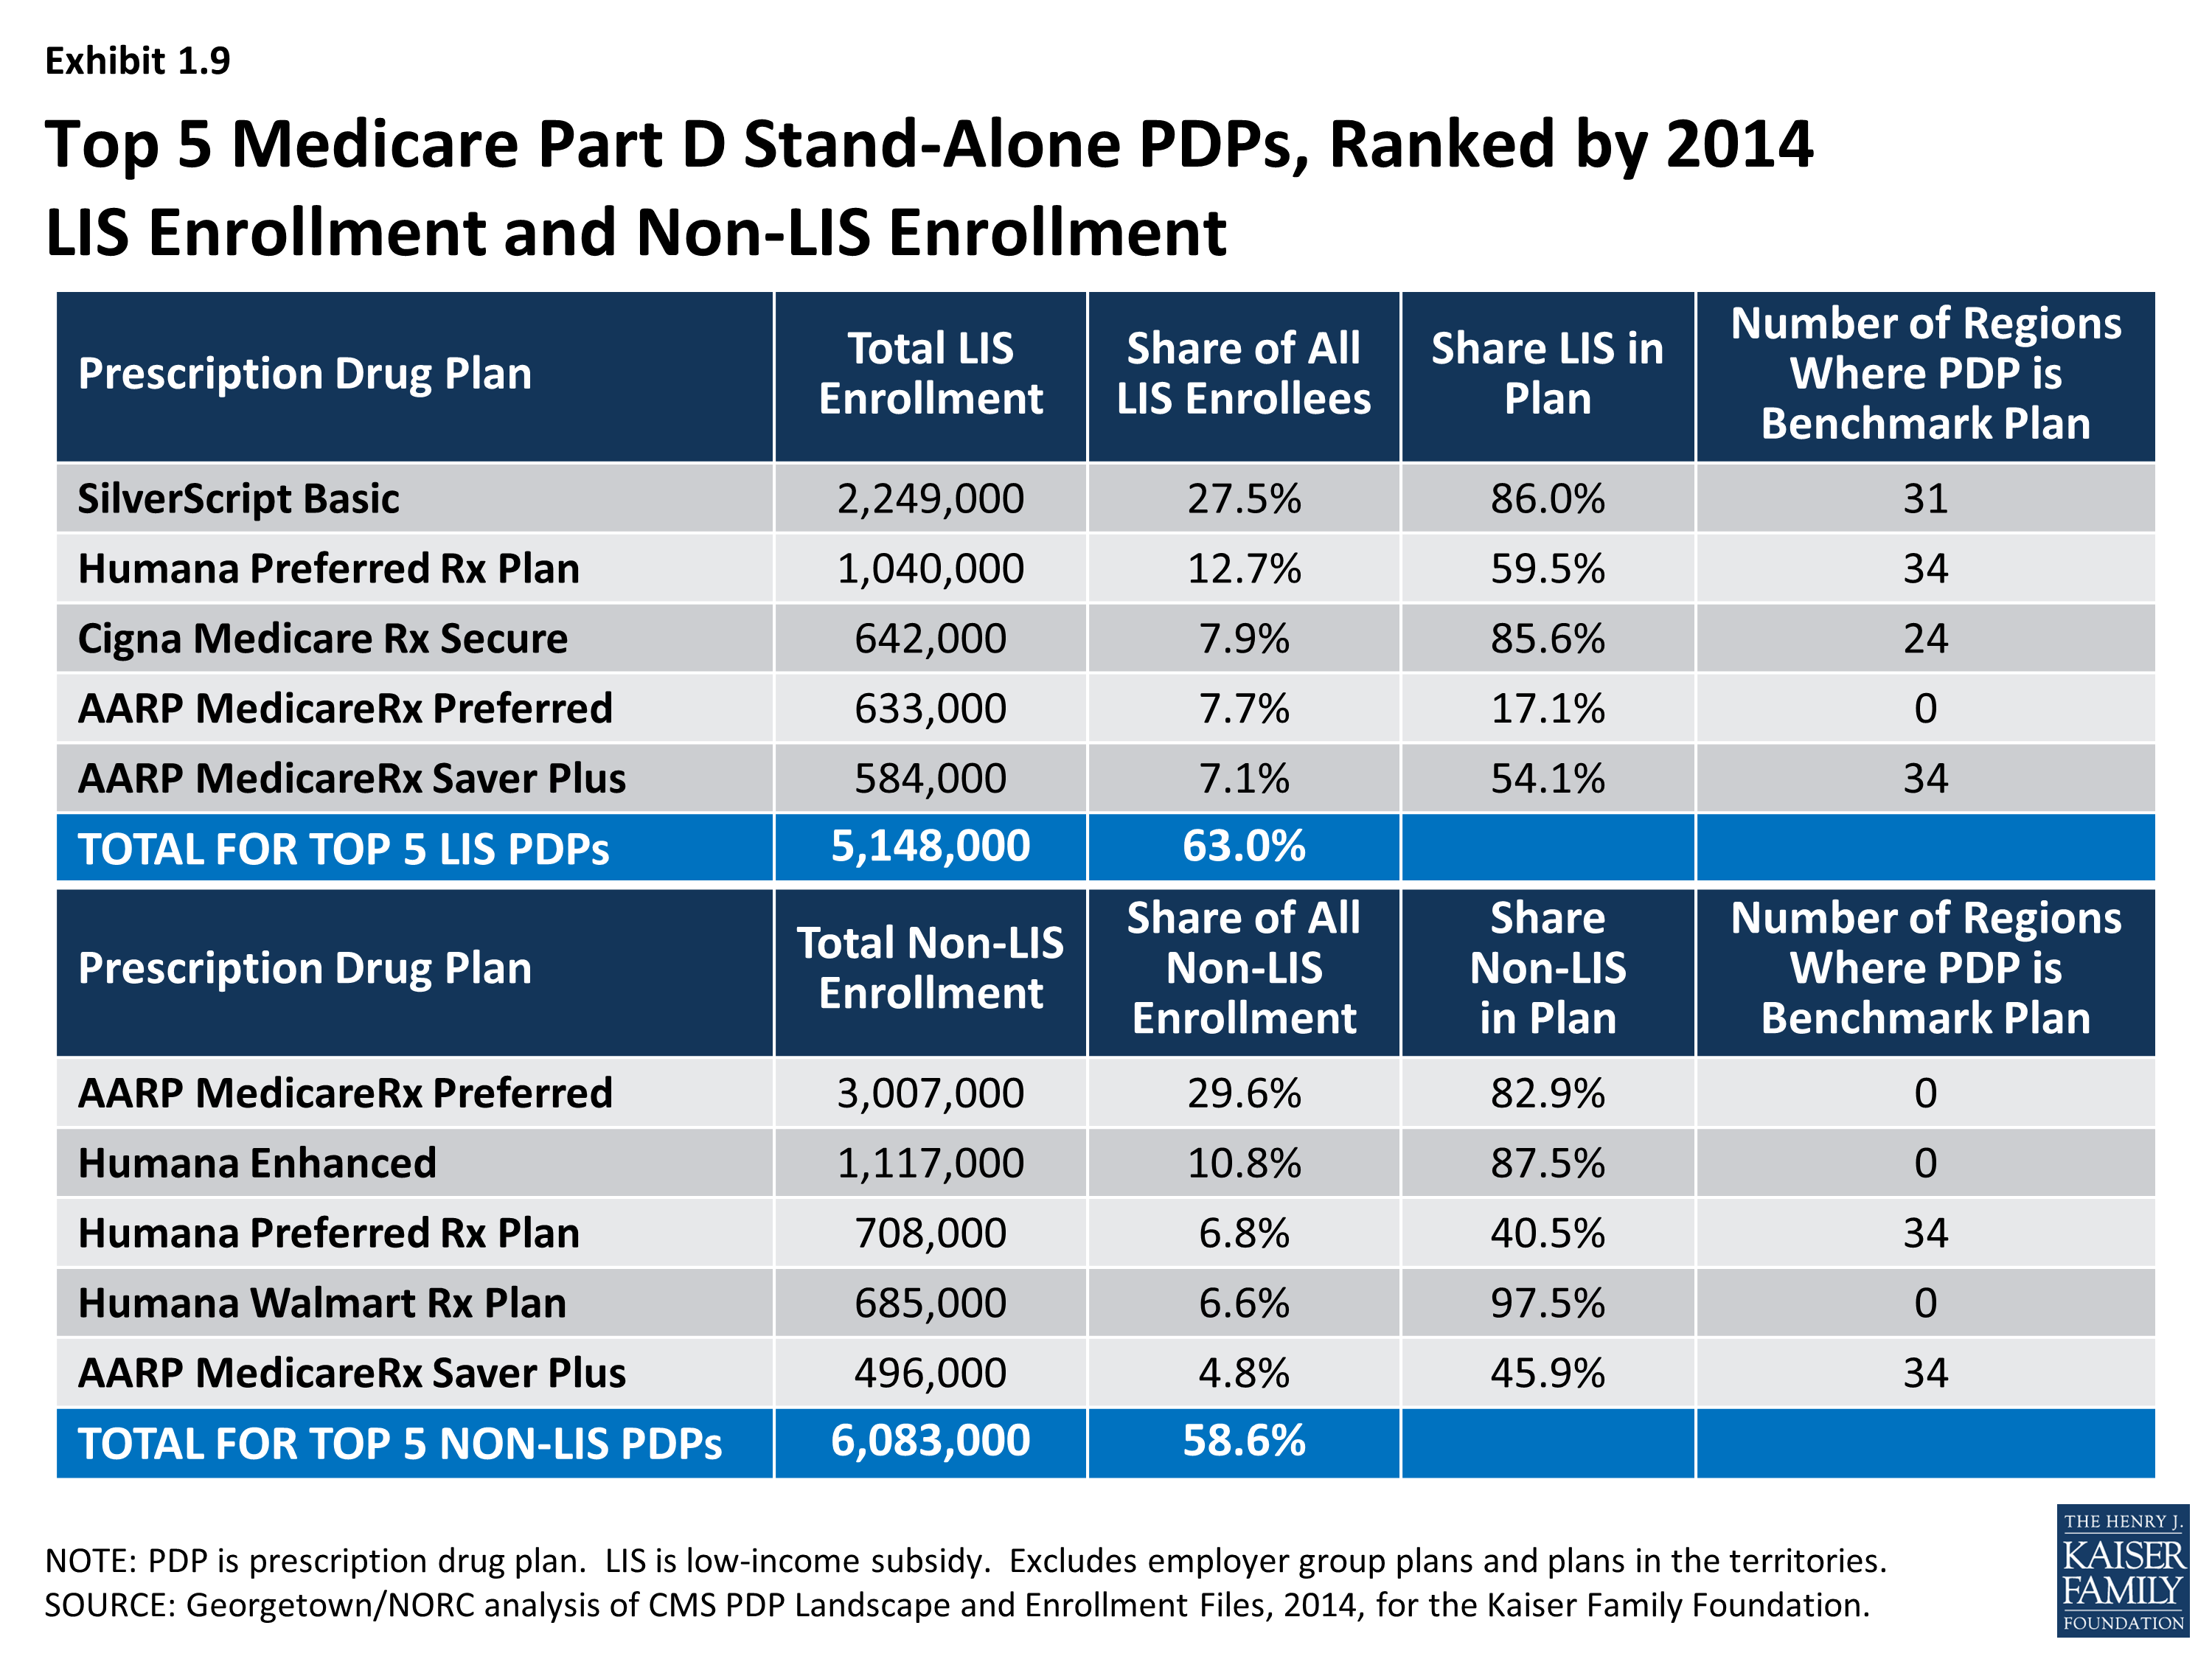
Top 5 Medicare Part D Stand-Alone PDPs, Ranked by 2014 LIS Enrollment and Non-LIS Enrollment