Medicare Part D in 2016 and Trends over Time
Section 3: Part D Benefit Design and Cost Sharing
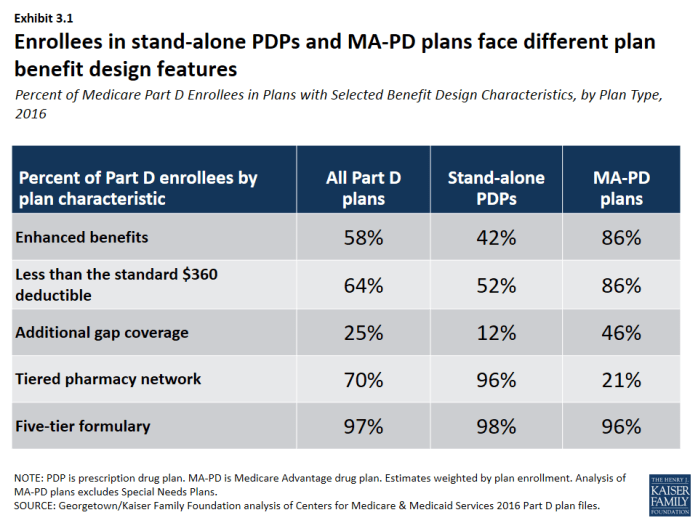
Stand-alone PDPs and MA-PD plans differ along several key characteristics related to benefit design.
- The majority of PDP and MA-PD plan enrollees are in plans with five-tier formularies, tiered pharmacy networks, enhanced benefits, no additional gap coverage, and deductibles below the standard amount of $360. However, a much larger share of MA-PD plan enrollees are in enhanced plans with deductibles less than $360. More PDP enrollees are in plans with tiered pharmacy networks (Exhibit 3.1).
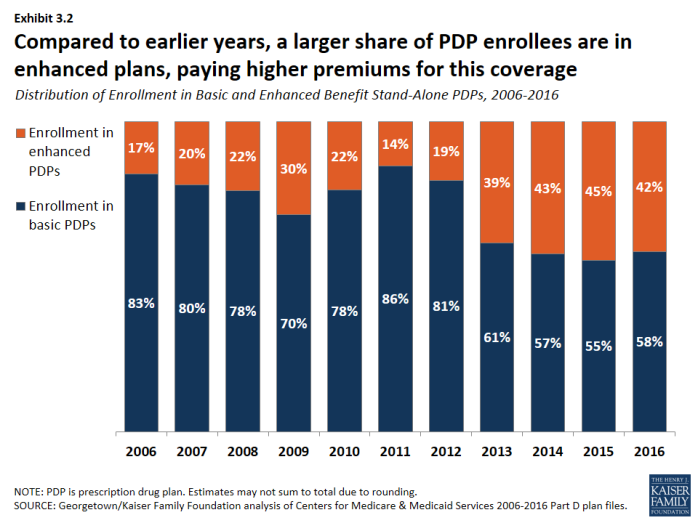
Over half of PDP enrollees are in PDPs offering the basic benefit in 2016.
- In 2016, 58 percent of PDP enrollees—but only 14 percent of MA-PD plan enrollees—are in plans offering the basic (rather than enhanced) benefit, a sizeable reduction from 83 percent of PDP enrollees in basic-benefit plans in 2006 (Exhibit 3.2).
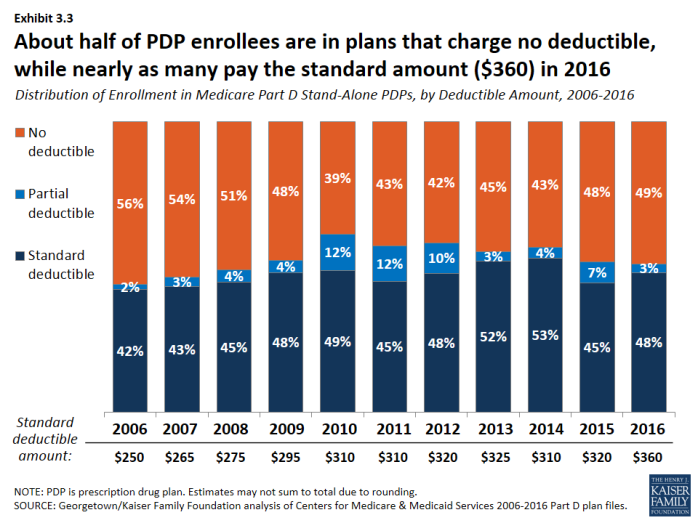
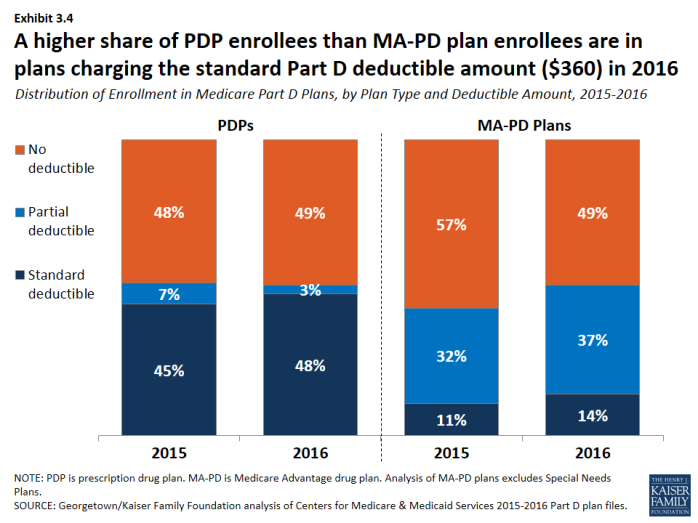
In 2016, about half of all enrollees in PDPs or MA-PD plans are in plans that waive the Part D deductible.
- About 48 percent of PDP enrollees are in plans charging the full standard deductible ($360) in 2016, and 3 percent of PDP enrollees are in plans with a deductible that is smaller than the standard amount (Exhibit 3.3). The shares among MA-PD plan enrollees are 14 percent and 37 percent, respectively (Exhibit 3.4).
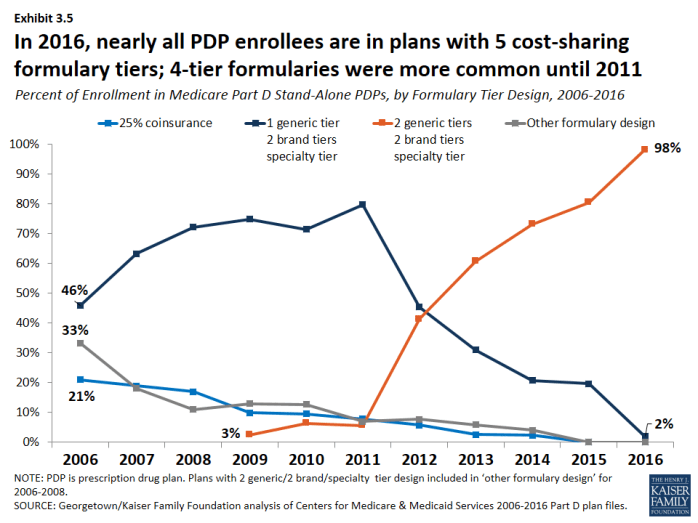
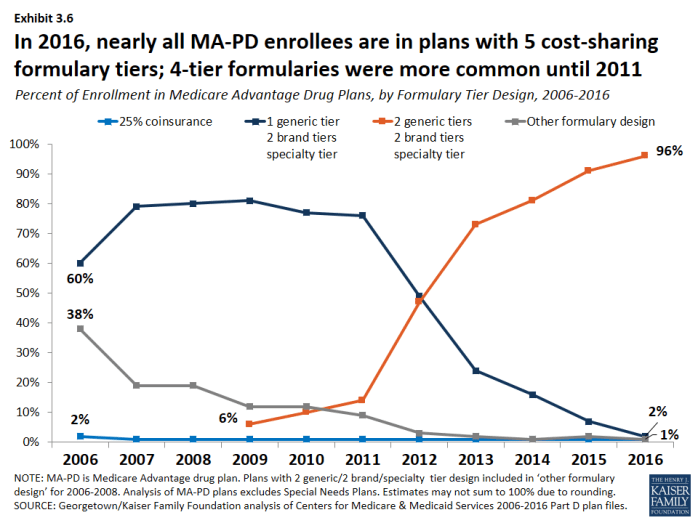
In 2016, nearly all plans use five cost-sharing tiers: preferred and non-preferred generic drugs, preferred and non-preferred brand drugs, and specialty drugs.
- The vast majority of all Part D enrollees (98 percent of PDP enrollees and 96 percent of MA-PD plan enrollees) are in plans that use five cost-sharing tiers for their formularies, a design that gained popularity starting in 2012 (Exhibit 3.5); (Exhibit 3.6). In 2006, most enrollees were in plans with only three or four tiers.
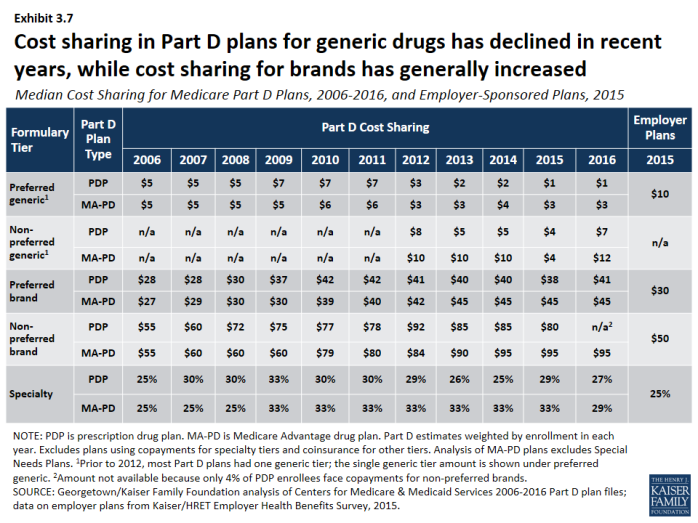
Cost sharing for generic drugs is lower in 2016 than in 2006 for those drugs now placed on preferred generic tiers.
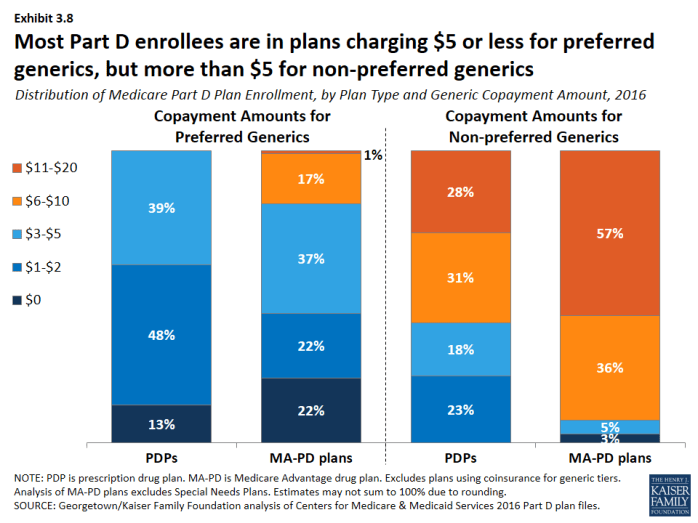
- Median cost sharing for preferred generics is $1 for PDPs and $3 for MA-PD plans in 2016, down from $5 in 2006 (Exhibit 3.7). For drugs on the non-preferred generic tier—a tier that became common in 2012—median cost sharing is $7 for PDPs and $12 for MA-PD plans. In 2016, 13 percent of PDP enrollees and 22 percent of MA-PD plan enrollees are in plans that charge $0 copayment for preferred generics (Exhibit 3.8).
- Unlike Part D plans, most employer plans do not use two generic tiers. Median cost sharing in 2015 for employer plans was $10 for the single generic tier, well above median copayments for generics in Part D.
Cost sharing for PDP enrollees for brand-name drugs increasingly takes the form of coinsurance instead of copayments.
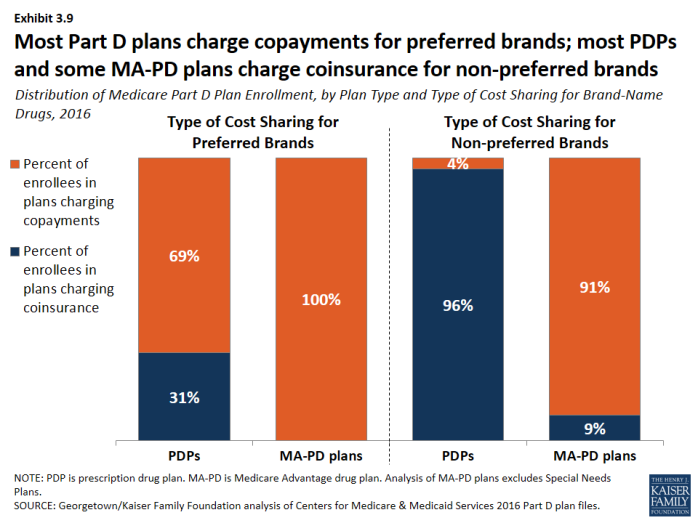
- In 2016, many PDP enrollees are in plans that charge coinsurance instead of copayments: 31 percent of enrollees now face coinsurance for preferred brand drugs and 96 percent do so for non-preferred brand drugs (Exhibit 3.9). By contrast, nearly all PDPs and MA-PD plans charge copayments for generic tiers, and most MA-PD plans use copayments for all tiers except the specialty tier.
Cost sharing for brand-name drugs has been relatively stable in recent years, but is much higher in 2016 than in 2006.
- Median cost sharing for preferred brands increased between 2006 and 2016 by about 46 percent ($28 to $41) for PDP enrollees and by nearly 70 percent ($27 to $45) for MA-PD plan enrollees. For PDP enrollees who face coinsurance for preferred brands, the median coinsurance rate is 20 percent. Copayments for brand-name drugs in Part D are higher than those typically charged by large employer plans.
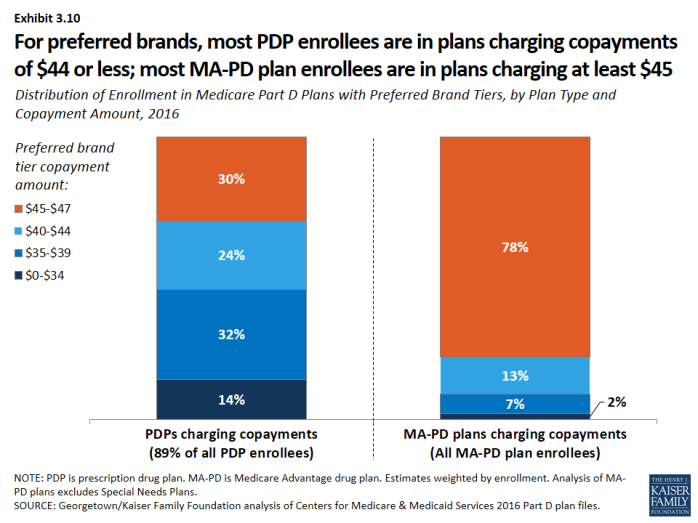
- Among PDP enrollees in plans that use copayments for preferred brands, a majority (70 percent) are in plans charging between $29 and $44, while most MA-PD plan enrollees (78 percent) are in plans charging at least $45 for preferred brands (Exhibit 3.10).
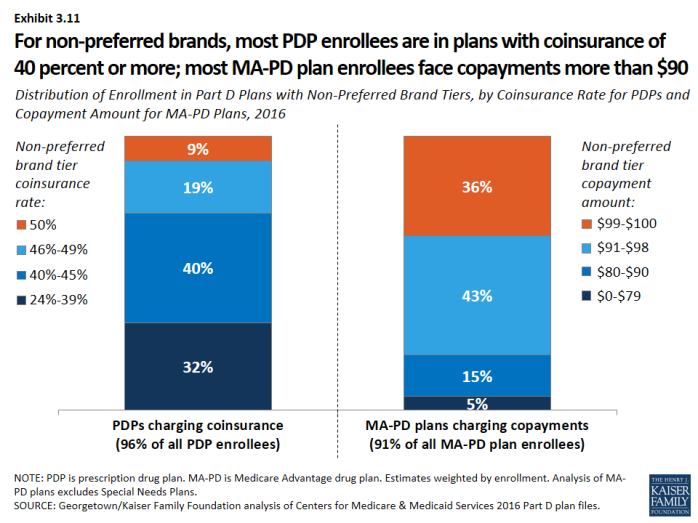
- For non-preferred brands, most PDP enrollees are in plans charging coinsurance of 40 percent or more; most MA-PD plan enrollees are in plans charging copayments more than $90 (Exhibit 3.11). For PDP enrollees, the median coinsurance rate for non-preferred brands is 40 percent, while for MA-PD plan enrollees, the median copayment amount is $95.
Nearly all Part D plans use specialty tiers for high-cost drugs and charge coinsurance of 25 percent to 33 percent during the benefit’s initial coverage period.
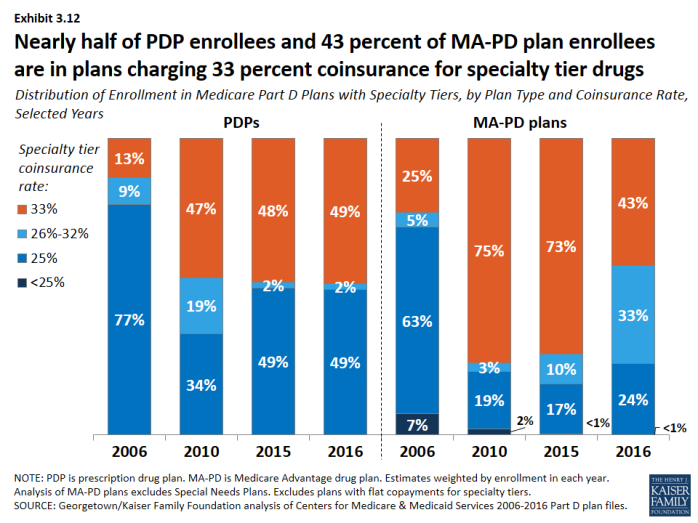
- Nearly half of PDP enrollees (49 percent) and more than 4 in 10 MA-PD plan enrollees (43 percent) are in plans that charge the maximum 33 percent coinsurance rate for specialty drugs, defined by CMS as those that cost at least $600 per month (Exhibit 3.12). Between 2015 and 2016, the share of MA-PD plan enrollees facing 33 percent specialty tier coinsurance declined. Only those plans that waive some or all of the standard deductible are permitted to set specialty tier coinsurance above 25 percent.
The use of tiered pharmacy networks has grown rapidly in recent years and is now the norm in PDPs.
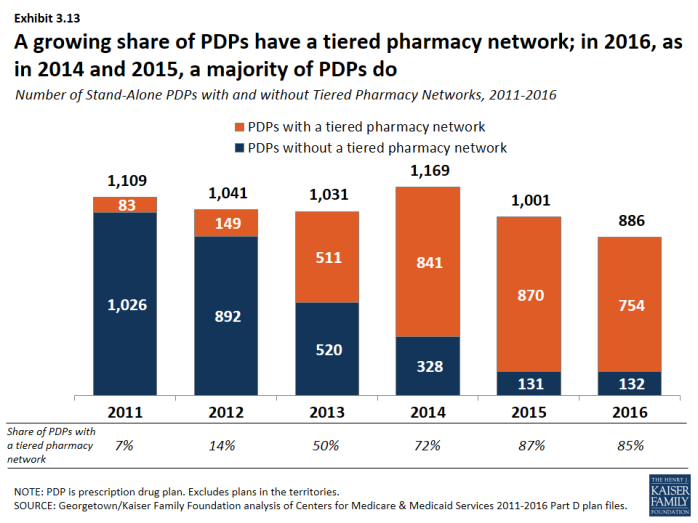
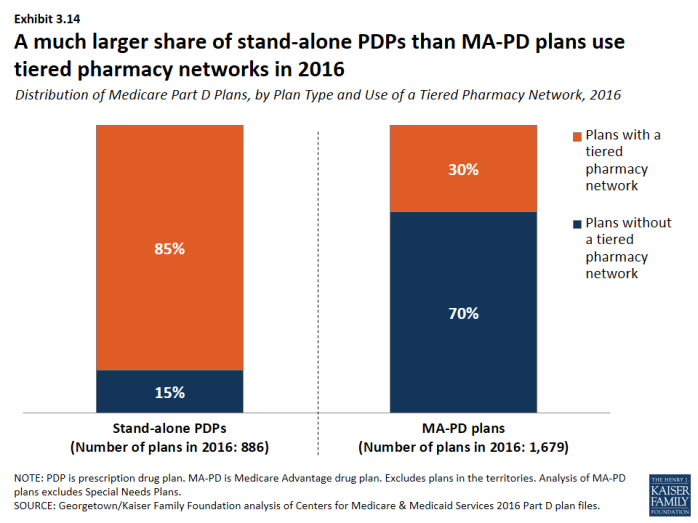
- The share of stand-alone PDPs with tiered pharmacy networks grew from 7 percent in 2011 to 85 percent in 2016 (Exhibit 3.13). These plans have 96 percent of PDP enrollees. By contrast, only 30 percent of MA-PD plans, with 21 percent of MA-PD plan enrollees, use tiered pharmacy networks (Exhibit 3.14).
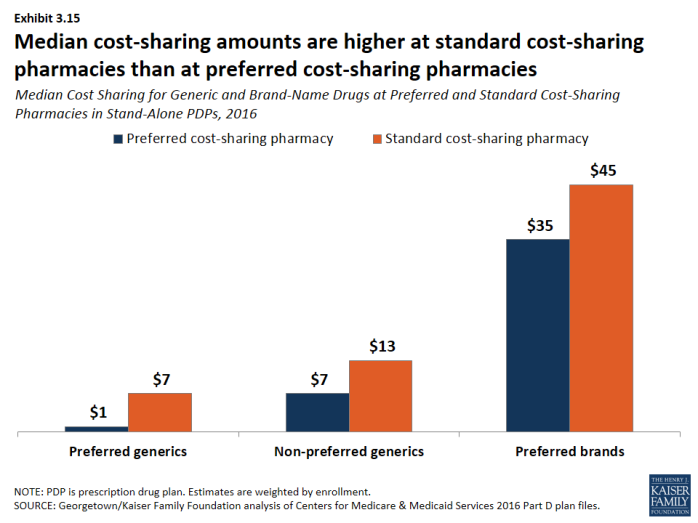
- Non-LIS enrollees in plans with tiered pharmacy networks pay lower cost sharing in pharmacies offering preferred cost sharing and higher cost sharing in other pharmacies (Exhibit 3.15). The largest differences are for preferred generic drugs: a median copayment of $1 at pharmacies offering preferred cost sharing versus $7 at other pharmacies ($7 versus $13 for non-preferred generic drugs). Differences are more modest for preferred brand drugs: $35 versus $45 for PDPs using copays and 25 percent versus 35 percent for PDPs using coinsurance.
Most Part D enrollees are in plans without additional gap coverage beyond what is provided in the standard benefit as the coverage gap is being phased out.
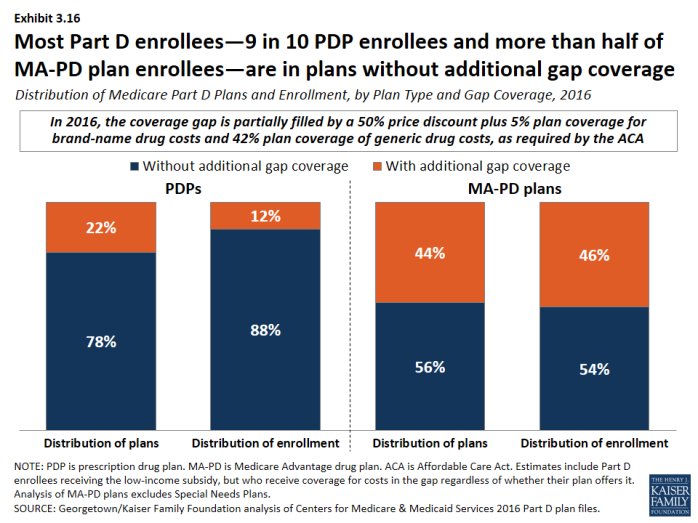
- In 2016, 88 percent of PDP enrollees and 54 percent of MA-PD plans enrollees are in plans without additional gap coverage (Exhibit 3.16). Although CMS no longer reports on the share of formulary drugs for which additional gap coverage is provided, gap coverage typically applies only to generic drugs and at most a small share of brand drugs, based on data from earlier years.
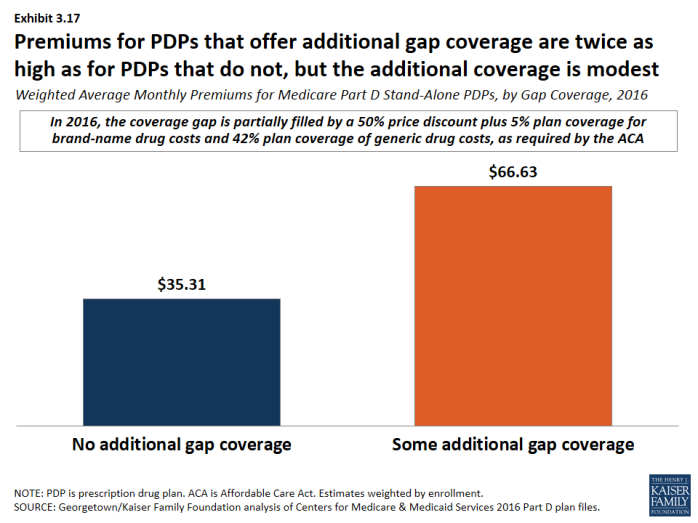
- Monthly premiums for PDPs that offer additional gap coverage are twice the premium amount for PDPs that lack additional coverage, despite the modest additional gap coverage offered in these PDPs (Exhibit 3.17).
x
Exhibit 3.1
x
Exhibit 3.2
x
Exhibit 3.3
x
Exhibit 3.4
x
Exhibit 3.5
x
Exhibit 3.6
x
Exhibit 3.7
x
Exhibit 3.8
x
Exhibit 3.9
x
Exhibit 3.10
x
Exhibit 3.11
x
Exhibit 3.12
x
Exhibit 3.13
x
Exhibit 3.14
x
Exhibit 3.15
x
Exhibit 3.16
x

