Medicare Advantage Plan Switching: Exception or Norm?
Overview
Each year, Medicare Advantage enrollees have the opportunity to change plans during an annual enrollment period. This opportunity is important because Medicare Advantage plans can make changes in their benefits, cost-sharing, provider networks, and premiums each year, and beneficiaries’ health needs may change from one year to the next. The open enrollment period allows enrollees to compare plans, stick with their current plan, switch to another plan, or shift to traditional Medicare. It is also the time when beneficiaries in traditional Medicare can switch to Medicare Advantage plans.
Little is known about the extent to which Medicare Advantage enrollees change plans during the annual open enrollment period. Prior research shows that roughly the same share of beneficiaries, 5 percent, shift between Medicare Advantage and traditional Medicare each year,1 that most enrollees tend to stay in a Medicare Advantage plan once in Medicare Advantage,2 and that switching rates from Medicare Advantage to traditional Medicare are higher among high-need, high-cost patients.3 ,4
This analysis focuses on enrollees in Medicare Advantage plans with prescription drug coverage (MA-PDs) who change plans when given the opportunity. It also analyzes the variation in the rate of plan switching by enrollee and plan characteristics and whether people who voluntarily switch plans tend to move to plans with lower premiums, lower out-of-pocket limits, or higher quality ratings. The analysis is based on a five percent sample of Medicare claims data merged with plan data from 2007 to 2014 (see Methods).
Issue Brief
Switching Rates
About one in ten Medicare Advantage plan enrollees (11 percent) in 2013 voluntarily switched to another plan in 2014 (Figure 1). Another two percent of enrollees voluntarily switched to traditional Medicare5 and another five percent were required to switch (involuntarily switched) plans because their plan exited the market.
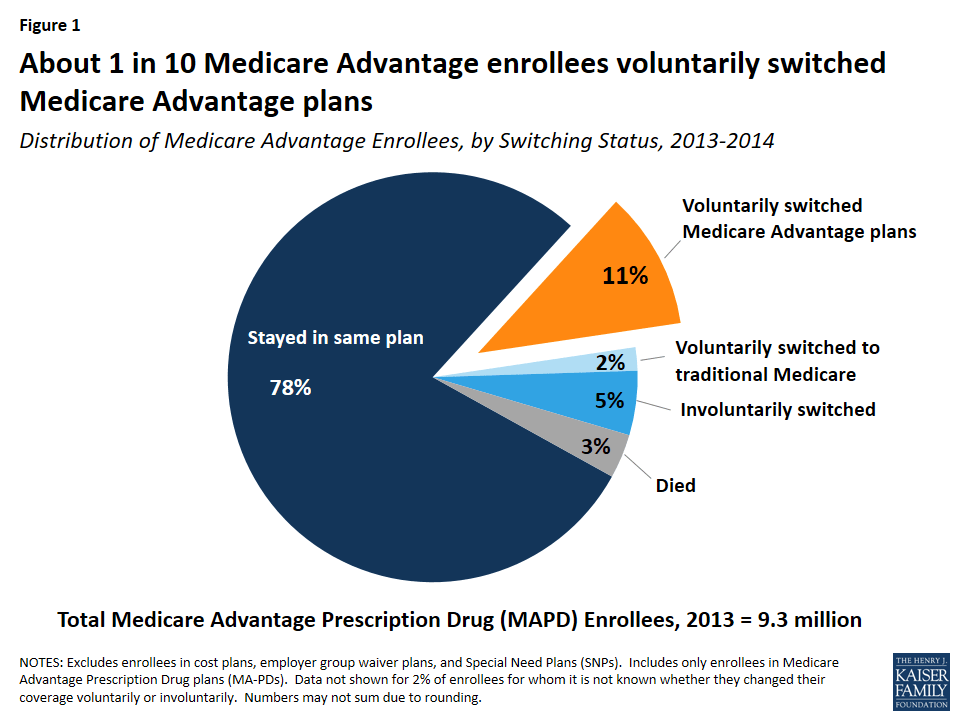
Of the five percent of involuntary switchers, four percent switched to a different Medicare Advantage plan, and about one percent elected coverage under traditional Medicare. Another three percent of enrollees in 2013 died before the start of the 2014 calendar year. Overall, 78 percent of Medicare Advantage enrollees did not change their source of coverage between 2013 and 2014.
Switching Rates, by Year
The share of Medicare Advantage enrollees switching plans has been virtually the same each year between 2007 and 2013, averaging 9 percent annually (Figure 2). The relatively constant rate of voluntary plan switching is noteworthy given the number of changes in Medicare Advantage policies and payments implemented during this time frame, including the establishment of new network requirements for private fee-for-service (PFFS) plans enacted as part of the Medicare Improvements for Patients and Providers Act (MIPPA) and implemented in 2011, as well as the reductions in federal payments to plans enacted as part of the Affordable Care Act of 2010.
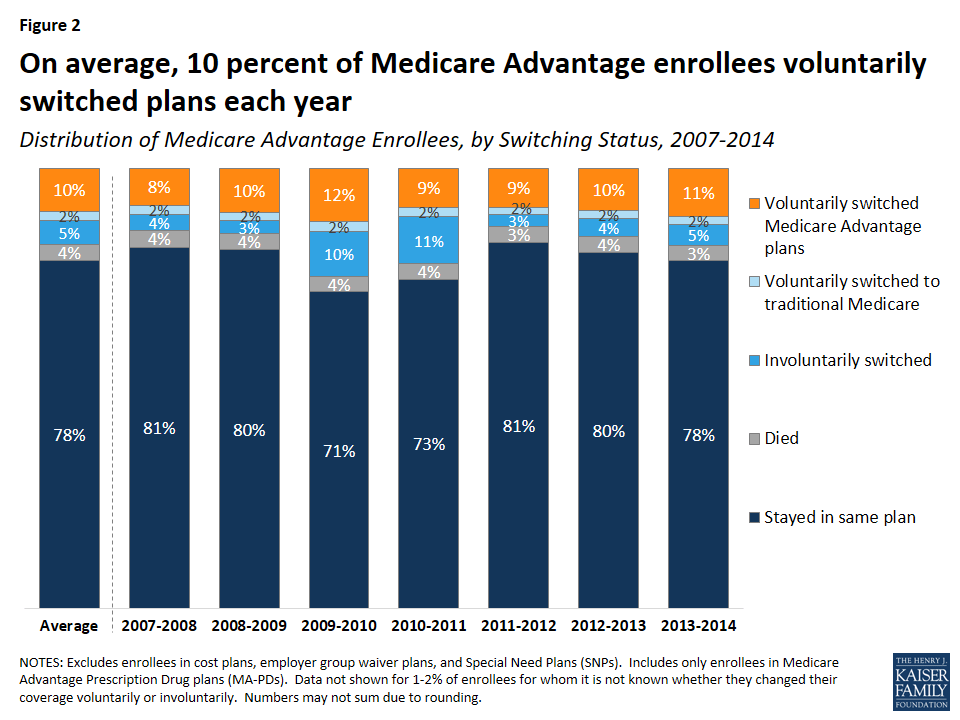
Voluntary switching rates were slightly higher between 2009 and 2010 and between 2013 and 2014 than in other years. The slight increase between 2009 and 2010 may have been due to PFFS plans encouraging their enrollees to switch to another plan offered by their firm in anticipation of terminating their PFFS plans in 2011 due to new provider network requirements for PFFS plans.6 Involuntary switching rates were also higher between 2009 and 2011.
Switching Rates, By Firm
Switching rates among enrollees were not consistently higher or lower in one large firm compared to another, with the exception of plans offered by Kaiser Permanente, which had consistently low switching rates relative to all other firms (Figure 3). Switching rates by firm fluctuated over the years. Higher switching rates in some years may have been due to PFFS plans exiting markets, a larger share of people switching out of regional PPOs, or other firm-specific factors.
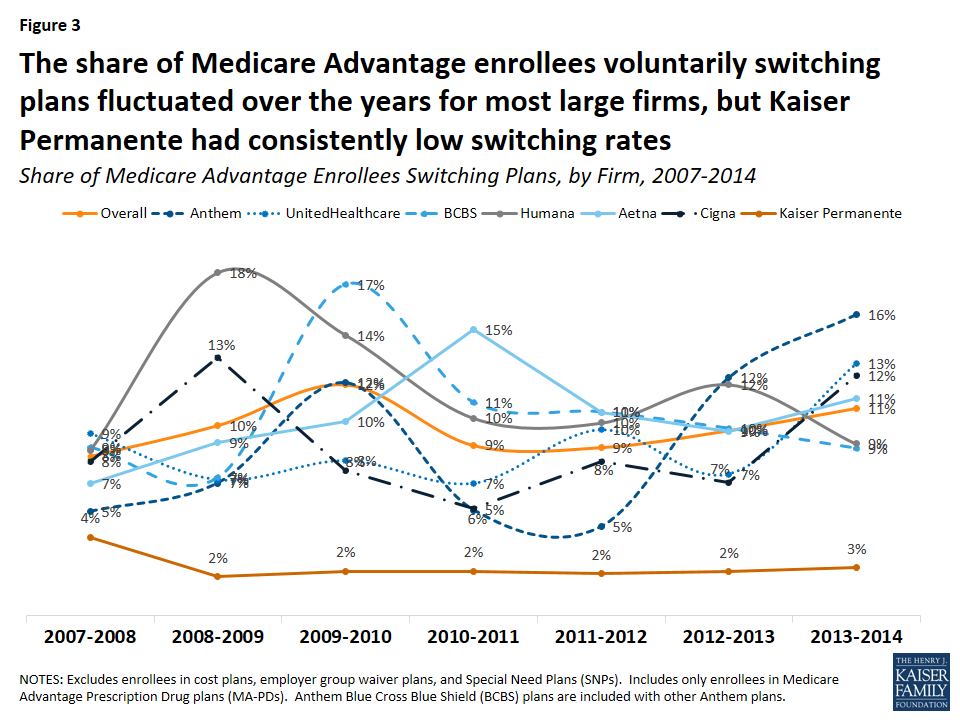
Between two percent and four percent of Kaiser Permanente enrollees switched Medicare Advantage plans between 2007 and 2014 – far lower than the overall average of ten percent. The low voluntary switching rate among enrollees in Kaiser Permanente plans could be partly due to its integrated delivery system, which would require enrollees to change doctors if they switched to a plan offered by another firm.
Comparison of Switching Rates Across Markets
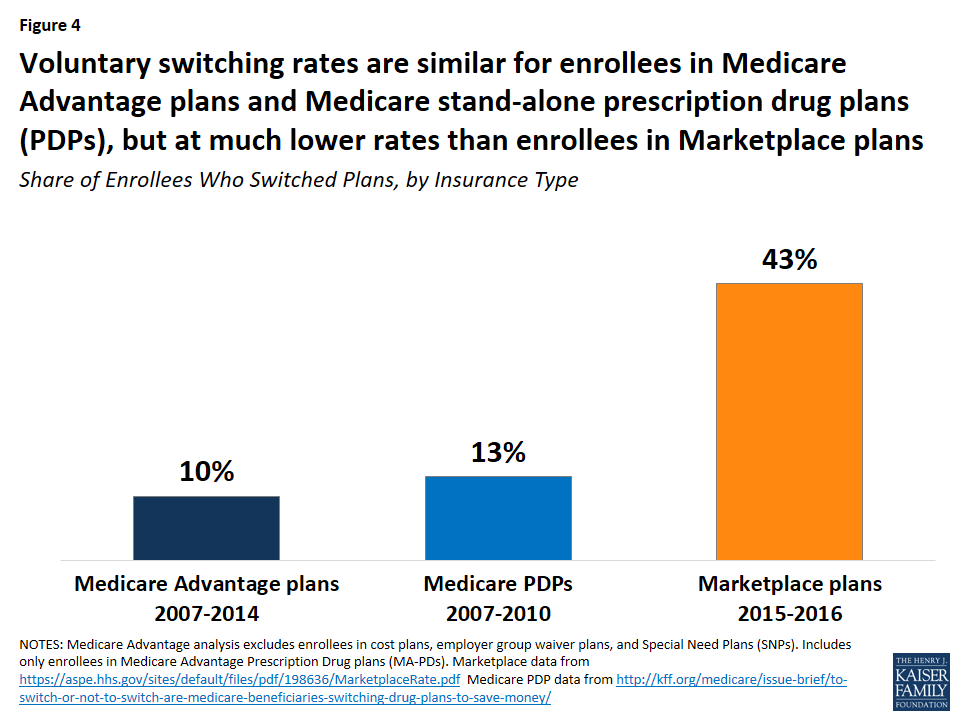
Medicare Advantage enrollees switch plans at similar rates as Medicare prescription drug plan (PDP) plan enrollees but at much lower rates than enrollees in ACA Marketplace plans (Figure 4). Between 2006 and 2010, 13 percent of Medicare PDP enrollees voluntarily switched plans (excluding enrollees receiving Low Income Subsidies),7 similar to the share of Medicare Advantage enrollees switching plans between 2007 and 2014. A much higher share of Marketplace enrollees – 43 percent – switched plans between 2015 and 2016.8 Even when all plan switchers, both voluntary and involuntary, are included, the rate (17 percent) is still much lower among Medicare Advantage than Marketplace enrollees.9
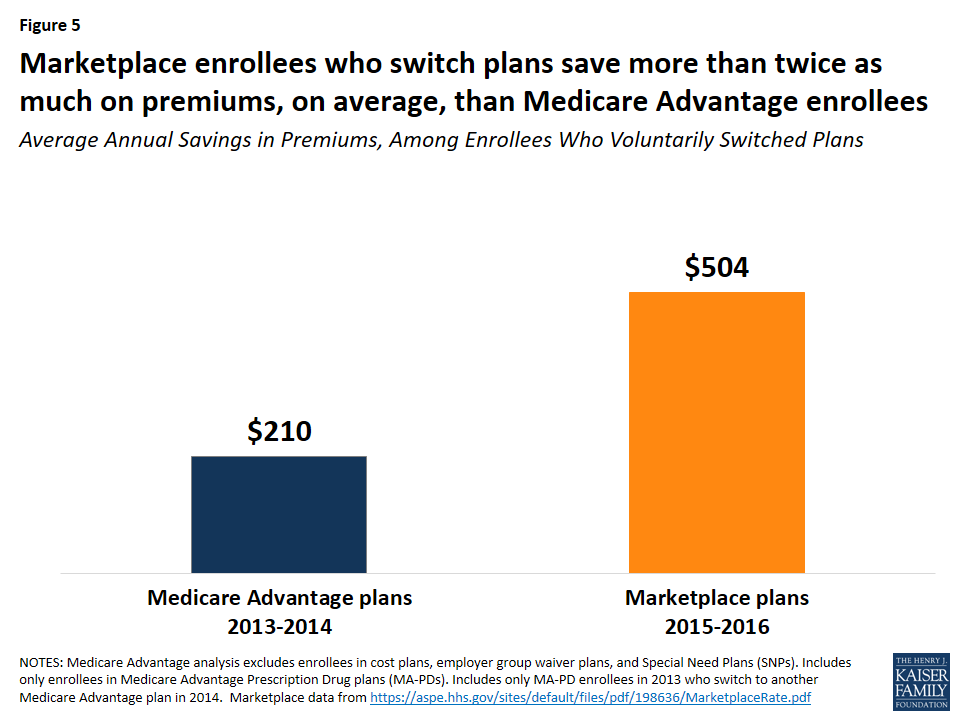
The lower switching rate among Medicare Advantage enrollees may be due to a number of factors. Marketplace enrollees save more in premiums when they switch plans than Medicare Advantage enrollees. Between 2015 and 2016, for example, Marketplace enrollees saved more than twice as much on annual premiums (saving $504 per year, on average) than Medicare Advantage enrollees saved by switching plans in 2014 (saving $210 per year, on average; Figure 5).10 Other factors influencing the difference in switching rates could include the anchoring of subsidies to the second lowest cost silver plan in the Marketplaces, more news coverage about the importance of switching Marketplace plans, greater volatility in premiums among the Marketplace plans, more technology savviness among younger Marketplace enrollees,11 and better tools available to help Marketplace enrollees shop for plans.
Factors Associated with Voluntarily Switching Plans
Beneficiary Characteristics
Age
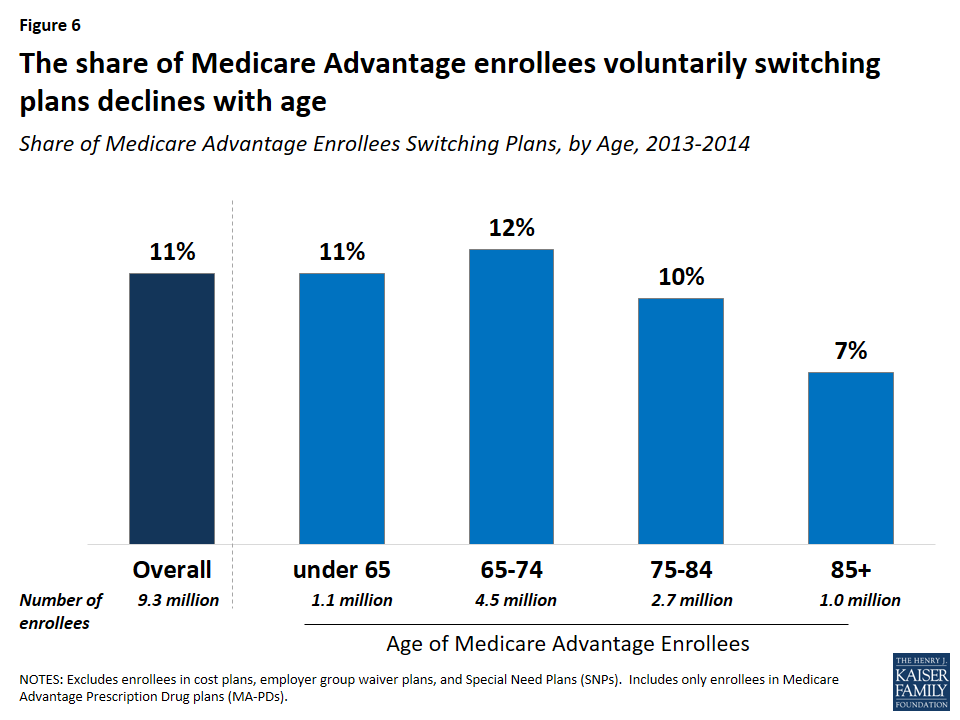
Switching rates among enrollees were somewhat higher among beneficiaries who were relatively young (ages 65 to 75). Plan switching declined with age, from 12 percent (ages 65-74) to 7 percent (ages 85 and older) between 2013 and 2014 (Figure 6).
Dual Eligibles
A somewhat larger share of enrollees dually eligible for Medicare and Medicaid (13 percent) than other Medicare Advantage enrollees (10 percent) switched plans. One possible explanation for this is that dually eligible beneficiaries are permitted to switch plans at any time during the year, unlike other Medicare Advantage enrollees, while another possible explanation is that dually eligible beneficiaries feel their needs are not being met by their current plan. Other research has also noted that a larger share of dually eligible beneficiaries than other Medicare beneficiaries switch from Medicare Advantage to traditional Medicare.12
Switching rates were lower among dual eligibles in Medicare Advantage Special Needs Plans (SNPs), which are for beneficiaries who are either dually eligible for Medicare and Medicaid, require an institutional level of care, or have specific chronic conditions. Between 2013 and 2014, about nine percent of dually eligible beneficiaries in SNPs switched to another Medicare Advantage plan compared to 13 percent of dual eligibles in non-SNP Medicare Advantage plans and 11 percent of all dual eligibles in Medicare Advantage plans.13
Other Characteristics
Switching rates among Medicare Advantage enrollees did not vary by gender, nor were they consistently higher or lower than among enrollees in metropolitan or non-metropolitan areas.14 Due to data limitations, this analysis does not examine whether switching rates differed by enrollees’ health status, chronic conditions, or use of health care services.
Plan Characteristics
Premiums
Switching rates were higher among Medicare Advantage enrollees who faced higher increases in premiums between 2013 and 2014. Among Medicare Advantage enrollees who faced a premium increase of less than $20, about 11 percent switched plans, but switching rates were much higher among enrollees who faced a premium increase of $20 or more and switching rates rose with premium increases (Figure 7). About one in five (21 percent) enrollees who faced a premium increase of $20 to $29 switched plans, one in four (24 percent)enrollees who faced a premium increase of $30 to $39 switched plans, and three in ten (29 percent) enrollees who faced a premium increase of $40 or more switched plans.15 Notably, nine percent of enrollees who faced a premium reduction switched plans – similar to the switching rates for enrollees with premium increases between $0 and $19.
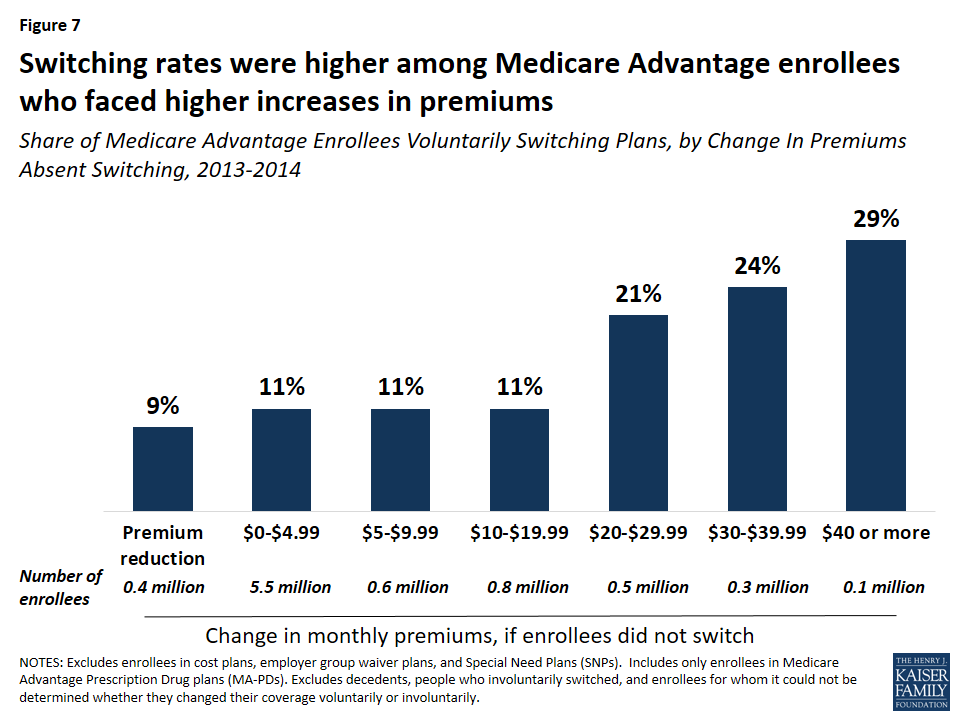
Most (79 percent) Medicare Advantage enrollees in 2013 faced premium increases of less than $10, which may have influenced their decision to stay in their plan. Conversely, 11 percent of Medicare Advantage enrollees faced premium increases of $20 or more, and more than 20 percent of these enrollees elected to change plans. As noted in more detail later, Medicare Advantage enrollees who switched plans tended to change to a plan with a lower premium, on average.
Quality Ratings
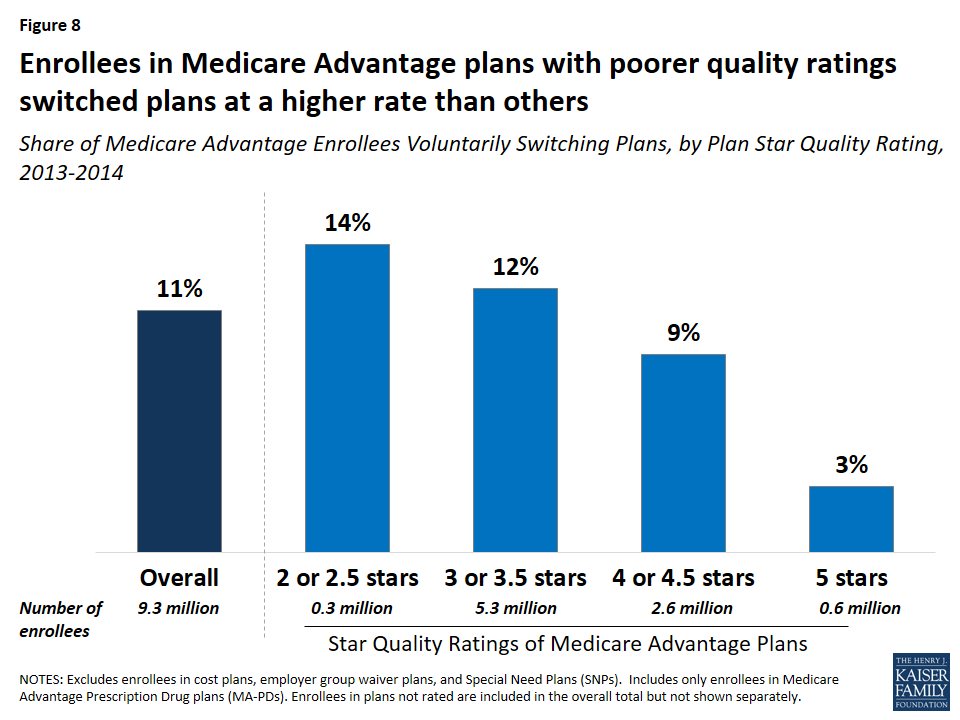
Medicare Advantage enrollees who voluntarily switched plans were disproportionately in plans with lower quality ratings. Between 2013 and 2014, one in seven (14 percent) enrollees in plans with 2 or 2.5 star quality ratings switched plans compared to one in ten (9 percent) enrollees in plans with 4 or 4.5 stars and only one in thirty (3 percent) enrollees in 5 star plans (Figure 8). These findings suggest that factors related to the star ratings may cause some beneficiaries to switch plans. However, as noted later, enrollees who switched plans ended up in a plan with only modestly higher quality ratings.
Plan Type
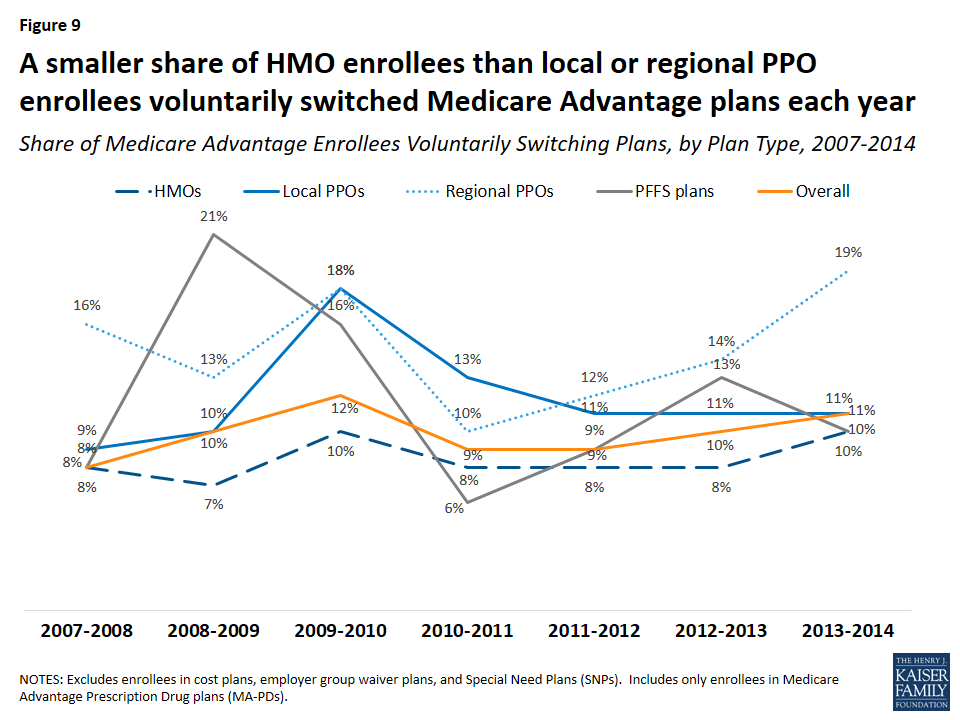
For most years between 2007 and 2014, a larger share of enrollees in regional PPOs than enrollees in other plan types voluntarily switched plans (Figure 9). In contrast, the switching rate was generally lowest among HMO enrollees.
Age of Contract
Switching rates from enrollees in plans under relatively new contracts (beginning in 2006 or more recent) were higher than among enrollees in plans under older contracts. Between 2013 and 2014, nine percent of enrollees in contracts that began before 2000 switched plans compared to 15 percent of enrollees in contracts that began in 2006 or later. However, these differences are intertwined with the types of plans that were available in a given year. For example, regional PPOs, which have higher switching rates than other plan types, could not be offered prior to 2006. Similarly, most of the contracts prior to 2000 were for HMOs.
County Characteristics
Voluntary switching rates did not differ across the county characteristics that were examined, including the number of plans available or the Medicare Advantage payment quartile for the county.
Changes in Premiums, Out-of-Pocket Limits, Quality Ratings, Firms, and Plan Types
Premiums
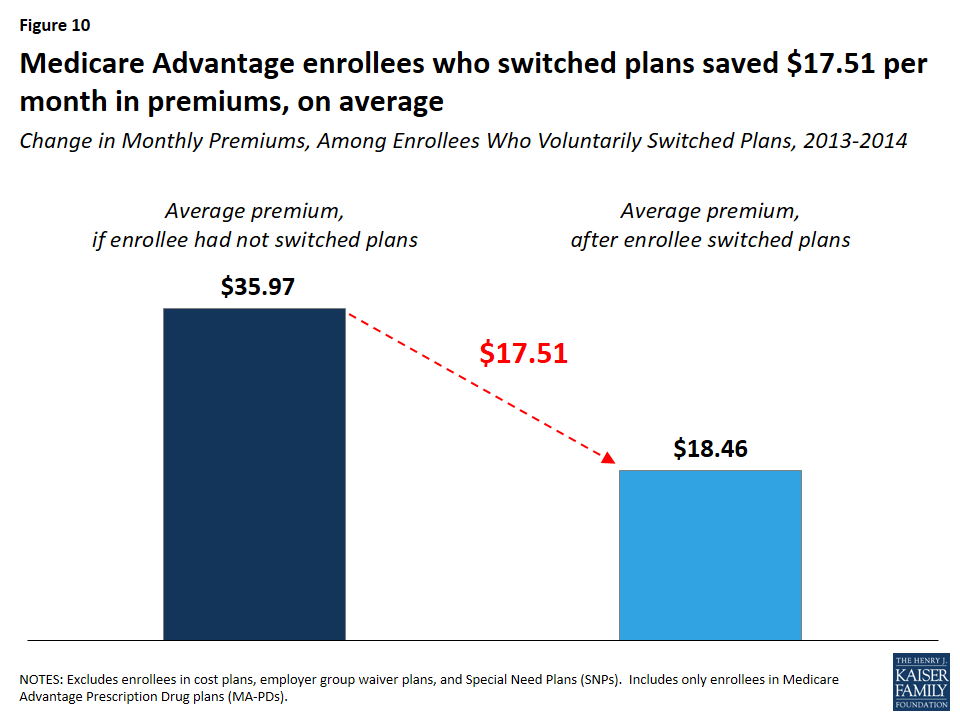
Enrollees who switched plans saved $15.87 per month in premiums, on average. Enrollees who switched plans would have paid $35.97 per month in premiums, on average, had they stayed in the same plan, but instead paid $18.46 per month, on average, after switching to another plan, saving $17.51 per month, on average (Figure 10). In contrast, enrollees who stayed in the same plan paid $4.26 more per month in premiums, on average. As noted earlier, switching rates were higher among Medicare Advantage enrollees who faced higher premium increases, particularly among enrollees with monthly premium increases of $20 or more.
Out-Of-Pocket Limits
Enrollees who switched plans lowered their out-of-pocket limit by $401, on average (Figure 11). Medicare Advantage enrollees who switched plans between 2013 and 2014 would have seen their out-of-pocket spending limits rise by $728, from $4,508 to $5,236, on average, had they stayed in the same plan. By switching plans, enrollees got better catastrophic protection, with lower out-of-pocket spending limits ($4,835, on average), a difference of $401.
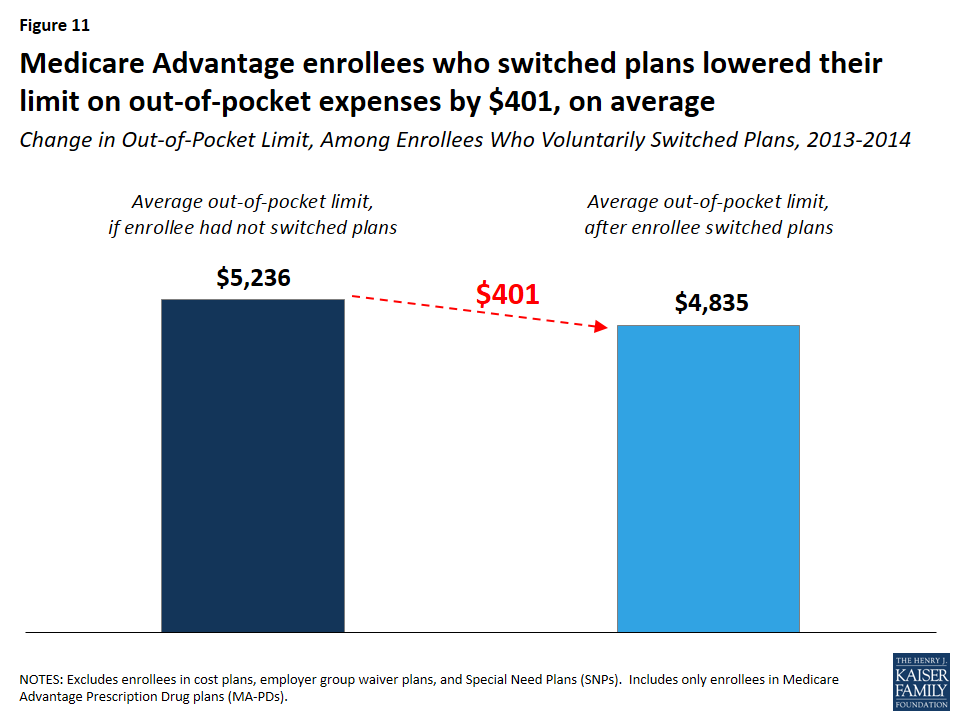
Since 2011, all Medicare Advantage plans have been required to limit enrollees’ out-of-pocket expenses on Medicare Part A and B services to no more than $6,700 and are encouraged by the Centers for Medicare and Medicaid Services (CMS) to have limits of $3,400 or less.
Quality Ratings
Medicare Advantage enrollees who voluntarily switched plans changed to plans with slightly higher star ratings than their original plan, but the improvement was a modest 0.11 stars, on average. Between 2013 and 2014, Medicare Advantage enrollees who switched plans moved from a plan with 3.51 stars in 2014, on average, to a plan with 3.79 stars in 2014, on average –0.28 points higher than their prior plan. Had they stayed in the same plan, they would have seen their plan’s rating increase 0.17 points, on average, the same as the increase in quality ratings for enrollees who did not switch plans.
Firm and Plan Type
Among enrollees who voluntarily switched plans between 2013 and 2014, seven in 10 (71 percent) switched to a plan offered by a different firm (Table 1). Among enrollees who switched to a different firm, most chose a plan of the same type as their original plan. The fact that most people who switched plans moved to a plan offered by a different firm could be an indication that brand loyalty was not a strong factor in their plan choice.
| Table 1: Share of Medicare Advantage Enrollees Switching Plans, by Differences in Firm and Plan Type | |||
| Same Firm | Different Firm | Total | |
| Same Plan Type | 18% | 44% | 62% |
| Different Plan Type | 11% | 27% | 38% |
| Total | 29% | 71% | 100% |
Most (62 percent) Medicare Advantage enrollees who voluntarily switched plans changed to a plan of the same type as their original plan, even if from a different firm. Yet, most of the loyalty to plan type was among the HMO enrollees. The majority of HMO enrollees who switched plans shifted to another HMO (81 percent), while a majority of local PPO, regional PPO, and PFFS enrollees who switched plans changed to a different type of Medicare Advantage plan between 2013 and 2014.
Discussion
Relatively few Medicare Advantage enrollees, roughly one in ten, voluntarily switch from one MA-PD to another MA-PD each year, suggesting that plan switching among seniors is more the exception than norm. The takeaway from this analysis for beneficiaries is not entirely clear. On the one hand, our analysis shows some price sensitivity among Medicare Advantage enrollees: switching rates were higher among the minority of enrollees with relatively big premium increases. On the other hand, the findings confirm that the vast majority of enrollees do not change plans, and that plan “stickiness” may come at a cost, in terms of higher premiums and higher out-of-pocket spending limits.
Enrollees may be sticking with their plan for a number of reasons. They may be satisfied with their coverage. They may decide they would rather pay a bit more in premiums to avoid the hassle and time involved with making a change, particularly because most face a premium increase of less than $10 on average, in 2014. In focus groups, seniors have said that they appreciate the opportunity to change plans but often feel that the differences across plans are not important enough to warrant the time and effort it takes to compare and change plans.16 Some enrollees may place a higher value on other factors, such as having access to specific doctors or the comfort of sticking with a plan that is familiar. They may find that the information they need to compare plans is not readily available or that the process of comparing premiums, benefits, and provider networks across plans is too tedious.
For plans, the relatively high enrollee retention rate could strengthen incentives to keep their enrollees relatively healthy with low medical costs over the course of many years. However, it could also send a signal to plans that the risk of losing enrollees to a competitor is low as long as they do not drastically increase enrollees’ costs or disrupt their care arrangements.
For policymakers, these findings underscore the importance of tools and other support to help beneficiaries choose plans that are most likely to meet their individual needs. For instance, the Medicare Plan Finder could be improved to allow beneficiaries to more easily compare provider networks, cost-sharing, and benefits. Additionally, support could be strengthened for counselors and others who help Medicare beneficiaries with these increasingly complex decisions. Efforts that aim to make it easier for Medicare beneficiaries to evaluate their options could increase competition among plans and improve beneficiaries’ satisfaction with their coverage. The fact that most Medicare Advantage enrollees are not changing plans may not be cause for concern, but it does raise questions about whether the Medicare Advantage market is working as well as it could for consumers, especially those who are relatively old or with significant health care needs.
Methods
This analysis focuses on enrollees in Medicare Advantage Prescription Drug plans (MA-PDs) who switched plans when they had the option of remaining in the same plan (voluntary switchers) rather than Medicare Advantage enrollees who had no choice but to switch because their plan exited the market (involuntary switchers) or beneficiaries who switched from Medicare Advantage to traditional Medicare. The brief uses claims data from a 5 percent sample of Medicare beneficiaries from the Master Beneficiary Summary Files of CMS’s Chronic Conditions Data Warehouse for 2007 through 2014, the latest year of data available. The data was used in conjunction with the Medicare Advantage landscape file, Medicare Advantage crosswalk file, and Medicare Advantage enrollment file for each year. Some plans that were in the claims data and the Medicare Advantage landscape file were not in the Medicare Advantage crosswalk file, thus it could not be determined for a small share of Medicare Advantage enrollees (1-2 percent, depending on the year) whether they switched plans voluntarily or were forced to switch plans because their plan withdrew from the market (involuntary switching). The analysis excluded 4.96 million Medicare Advantage enrollees in 2013 because they were in plans that are not available for general enrollment (employer group waiver plans, Special Needs Plans, and demonstrations), in plans that are structured differently from Medicare Advantage plans (cost plans), or in plans that did not offer prescription drug coverage and are not marketed for general enrollment.
Gretchen Jacobson and Tricia Neuman are with the Kaiser Family Foundation. Anthony Damico is an independent consultant.
The authors appreciate the helpful review and comments that Marsha Gold provided on this paper.
Endnotes
- Jacobson, Gretchen A., Patricia Neuman, and Anthony Damico, “At Least Half Of New Medicare Advantage Enrollees Had Switched From Traditional Medicare During 2006-11,” Health Affairs (Milwood), 34(1): 148-55, January 2015. ↩︎
- Riley, Gerald F., “Impact of Continued Biased Disenrollment from the Medicare Advantage Program to Fee-for-Service” Medicare & Medicaid Research Review 2(4): E1-E16, 2012. Available at: https://www.cms.gov/mmrr/Downloads/MMRR2012_002_04_A08.pdf. ↩︎
- McWilliams, J. Michael, John Hsu, and Joseph P. Newhouse. “New Risk-Adjustment System Was Associated with Reduced Favorable Selection in Medicare Advantage.” Health Affairs (Milwood) 31(12): 2630-2640, December 2012. Available at: http://content.healthaffairs.org/content/31/12/2630.full.pdf+html. ↩︎
- Newhouse, Joseph P., Mary Price, Jie Huang, J. Michael McWilliams, and John Hsu. “Steps to Reduce Favorable Risk Selection in Medicare Advantage Largely Succeeded, Boding Well for Health Insurance Exchanges.” Health Affairs (Milwood), 31(12): 2618-2628, December 2012. Available at: http://content.healthaffairs.org/content/31/12/2618.full.pdf+html. ↩︎
- A prior analysis found a higher rate of switching between Medicare Advantage and traditional Medicare. The rate is somewhat lower in this analysis because it excludes beneficiaries enrolled in Medicare Advantage plans that did not offer prescription drug coverage, employer group waiver plans, and Special Needs Plans (n=4.78 million beneficiaries in 2013). In total, 4.78 million beneficiaries who would have been included in the other analysis were excluded from this analysis for 2013. For the other analysis, see Jacobson, Gretchen A., Patricia Neuman, and Anthony Damico, “At Least Half Of New Medicare Advantage Enrollees Had Switched From Traditional Medicare During 2006-11,” Health Affairs (Milwood), 34(1): 148-55, January 2015. ↩︎
- For more information about the change in plans available between 2009 and 2010, see Gold, Marsha, Dawn Phelps, Gretchen Jacobson, and Tricia Neuman. “Medicare Advantage 2010 Data Spotlight: Plan Enrollment Patterns and Trends.” Kaiser Family Foundation, June 2010. Available at: https://modern.kff.org/medicare/issue-brief/medicare-advantage-2010-data-spotlight-plan-enrollment/. ↩︎
- Hoadley, Jack, Elizabeth Hargrave, Laura Summer, Juliette Cubanski, and Tricia Neuman. “To Switch or Not to Switch: Are Medicare Beneficiaries Switching Drug Plans To Save Money?” Kaiser Family Foundation, October 2013. Available at: https://modern.kff.org/medicare/issue-brief/to-switch-or-not-to-switch-are-medicare-beneficiaries-switching-drug-plans-to-save-money/. ↩︎
- Office of the Assistant Secretary for Planning and Evaluation. “Health Insurance Marketplace Premiums After Shopping, Switching and Premium Tax Credits, 2015-2016.” ASPE Issue Brief, April 2016. Available at: https://aspe.hhs.gov/sites/default/files/pdf/198636/MarketplaceRate.pdf. ↩︎
- The rates of plan switching in the Federal Employees Health Benefits (FEHB) Program was 12 percent between 2000 and 2001. See Atherly, Adam, Curtis Florence, and Kenneth E. Thorpe. “Health Plan Switching Among Members of the Federal Employees Health Benefits Program.” Inquiry, 42: 255-265, Fall 2005. Available at: http://inq.sagepub.com/content/42/3/255.full.pdf. Approximately 6 percent of CalPERS members switched health plans between 2014 and 2015, which was higher than previous years. See CalPERS Pension and Health Benefits Committee. “Health Open Enrollment Results.” February 18, 2015. Available at: https://www.calpers.ca.gov/docs/board-agendas/201502/pension/item-10.pdf. ↩︎
- Office of the Assistant Secretary for Planning and Evaluation. “Health Insurance Marketplace Premiums After Shopping, Switching and Premium Tax Credits, 2015-2016.” ASPE Issue Brief, April 2016. Available at: https://aspe.hhs.gov/sites/default/files/pdf/198636/MarketplaceRate.pdf. ↩︎
- Levine, David M., Stuart R. Lipsitz, and Jeffrey A. Linder. “Trends in Seniors’ Use of Digital Health Technology in the United States, 2011-2014.” JAMA, August 2016. Available at: http://jama.jamanetwork.com/article.aspx?articleid=2540389. ↩︎
- Jacobson, Gretchen A., Patricia Neuman, and Anthony Damico, “At Least Half Of New Medicare Advantage Enrollees Had Switched From Traditional Medicare During 2006-11,” Health Affairs (Milwood), 34(1): 148-55, January 2015. ↩︎
- While most SNP enrollees are dual eligibles, not all dually eligible beneficiaries who are enrolled in Medicare Advantage plans are in SNPs: about 1.2 million dual eligibles were enrolled in SNPs and about 1.1 million dual eligibles were enrolled in other Medicare Advantage plans in 2013. ↩︎
- Notably, a larger share of enrollees in non-metropolitan areas (8 percent) than metropolitan areas (4 percent) were forced to switch plans (involuntary switching) because their plan exited the market between 2013 and 2014. This difference in involuntary switching rates was consistent across all years of this study. ↩︎
- For another example and discussion of price elasticity in plan choice, see Buchmueller, Thomas C. and Paul J. Feldstein. “The Effect of Price on Switching Among Health Plans.” Journal of Health Economics, 16(2): 231-247, April 1997. ↩︎
- Jacobson, Gretchen, Christina Swoope, Michael Perry, and Mary C. Slosar. “How are Seniors Choosing and Changing Health Insurance Plans?” Kaiser Family Foundation, May 2014. Available at: https://modern.kff.org/medicare/report/how-are-seniors-choosing-and-changing-health-insurance-plans/. ↩︎