Medicare Advantage 2014 Spotlight: Plan Availability and Premiums
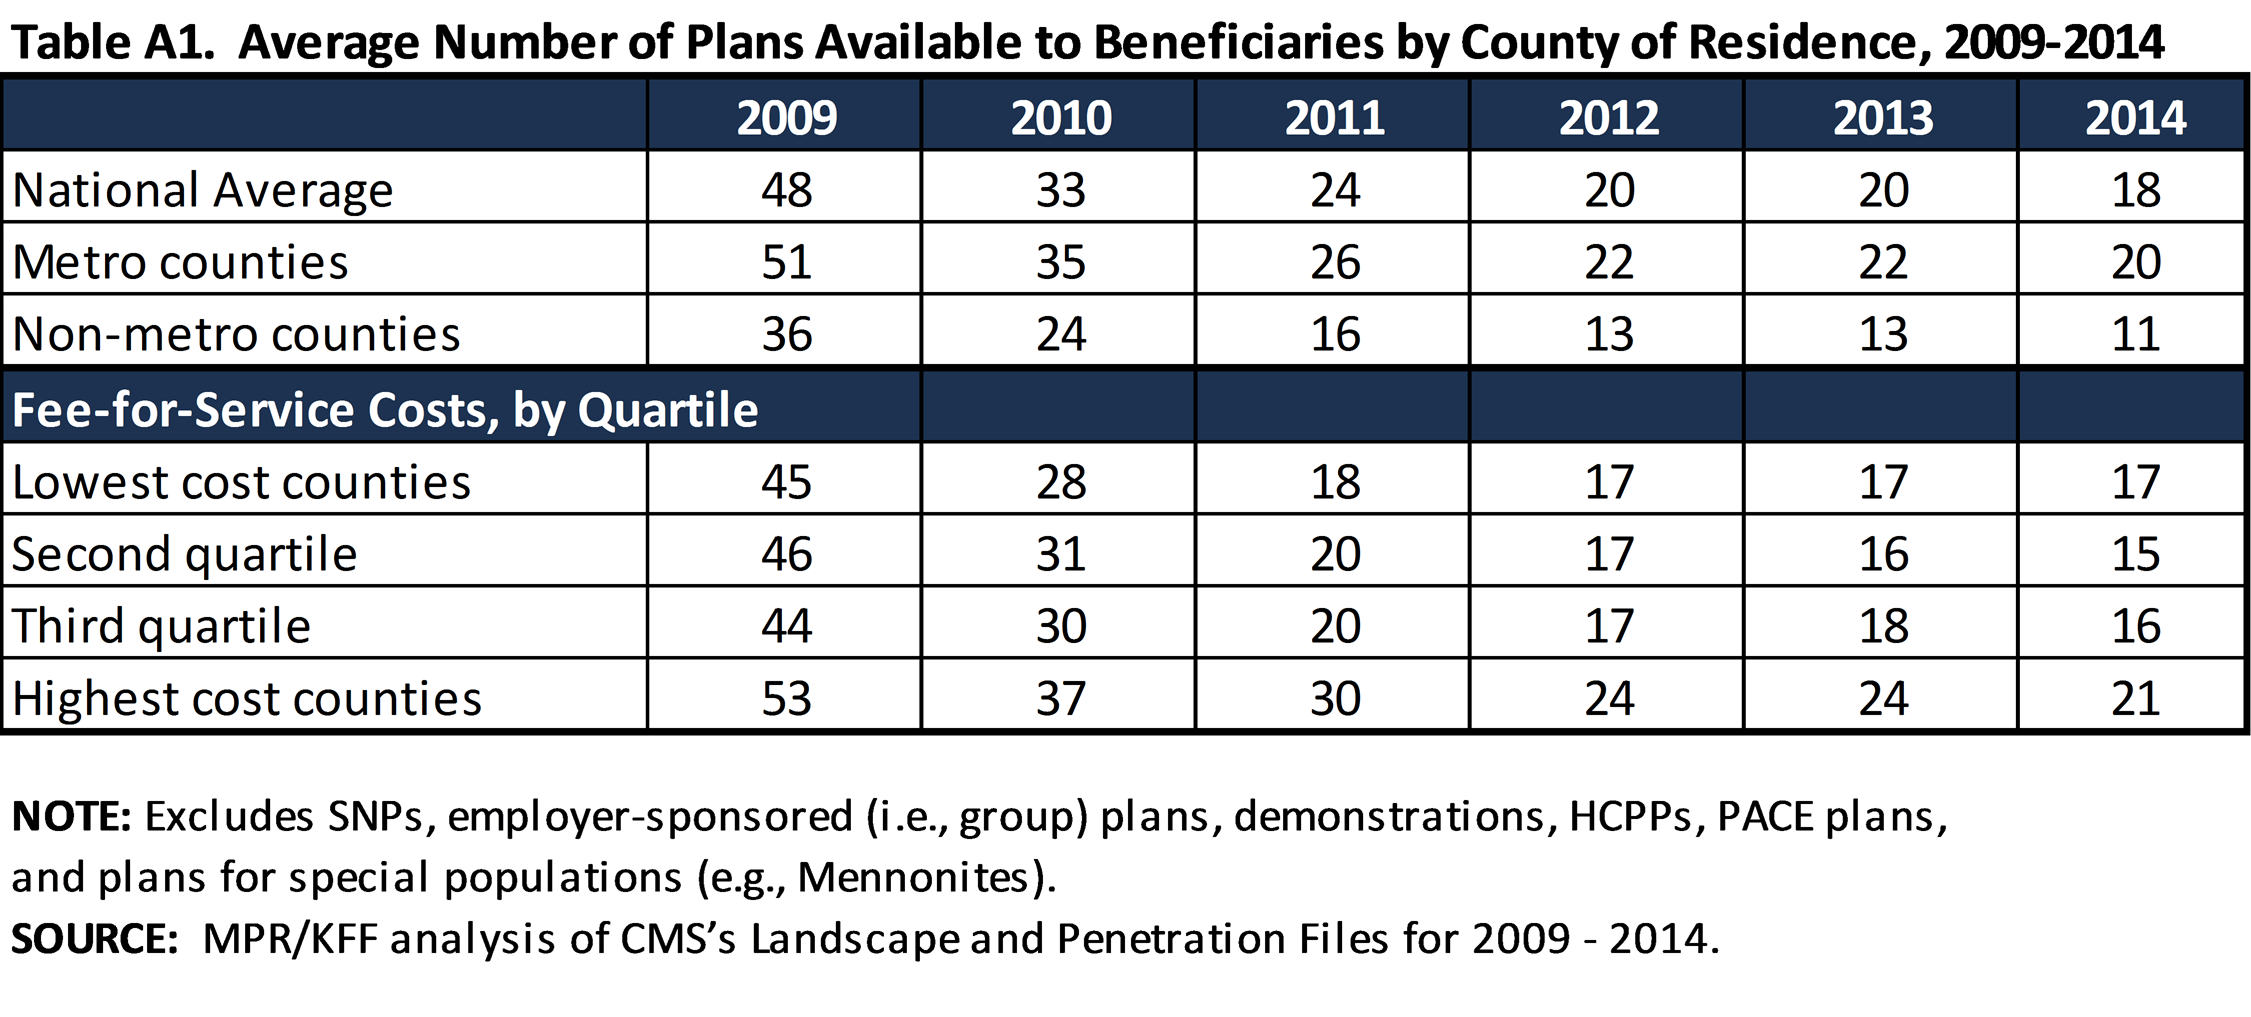
Average Number of Plans Available to Beneficiaries by County of Residence, 2009-2014
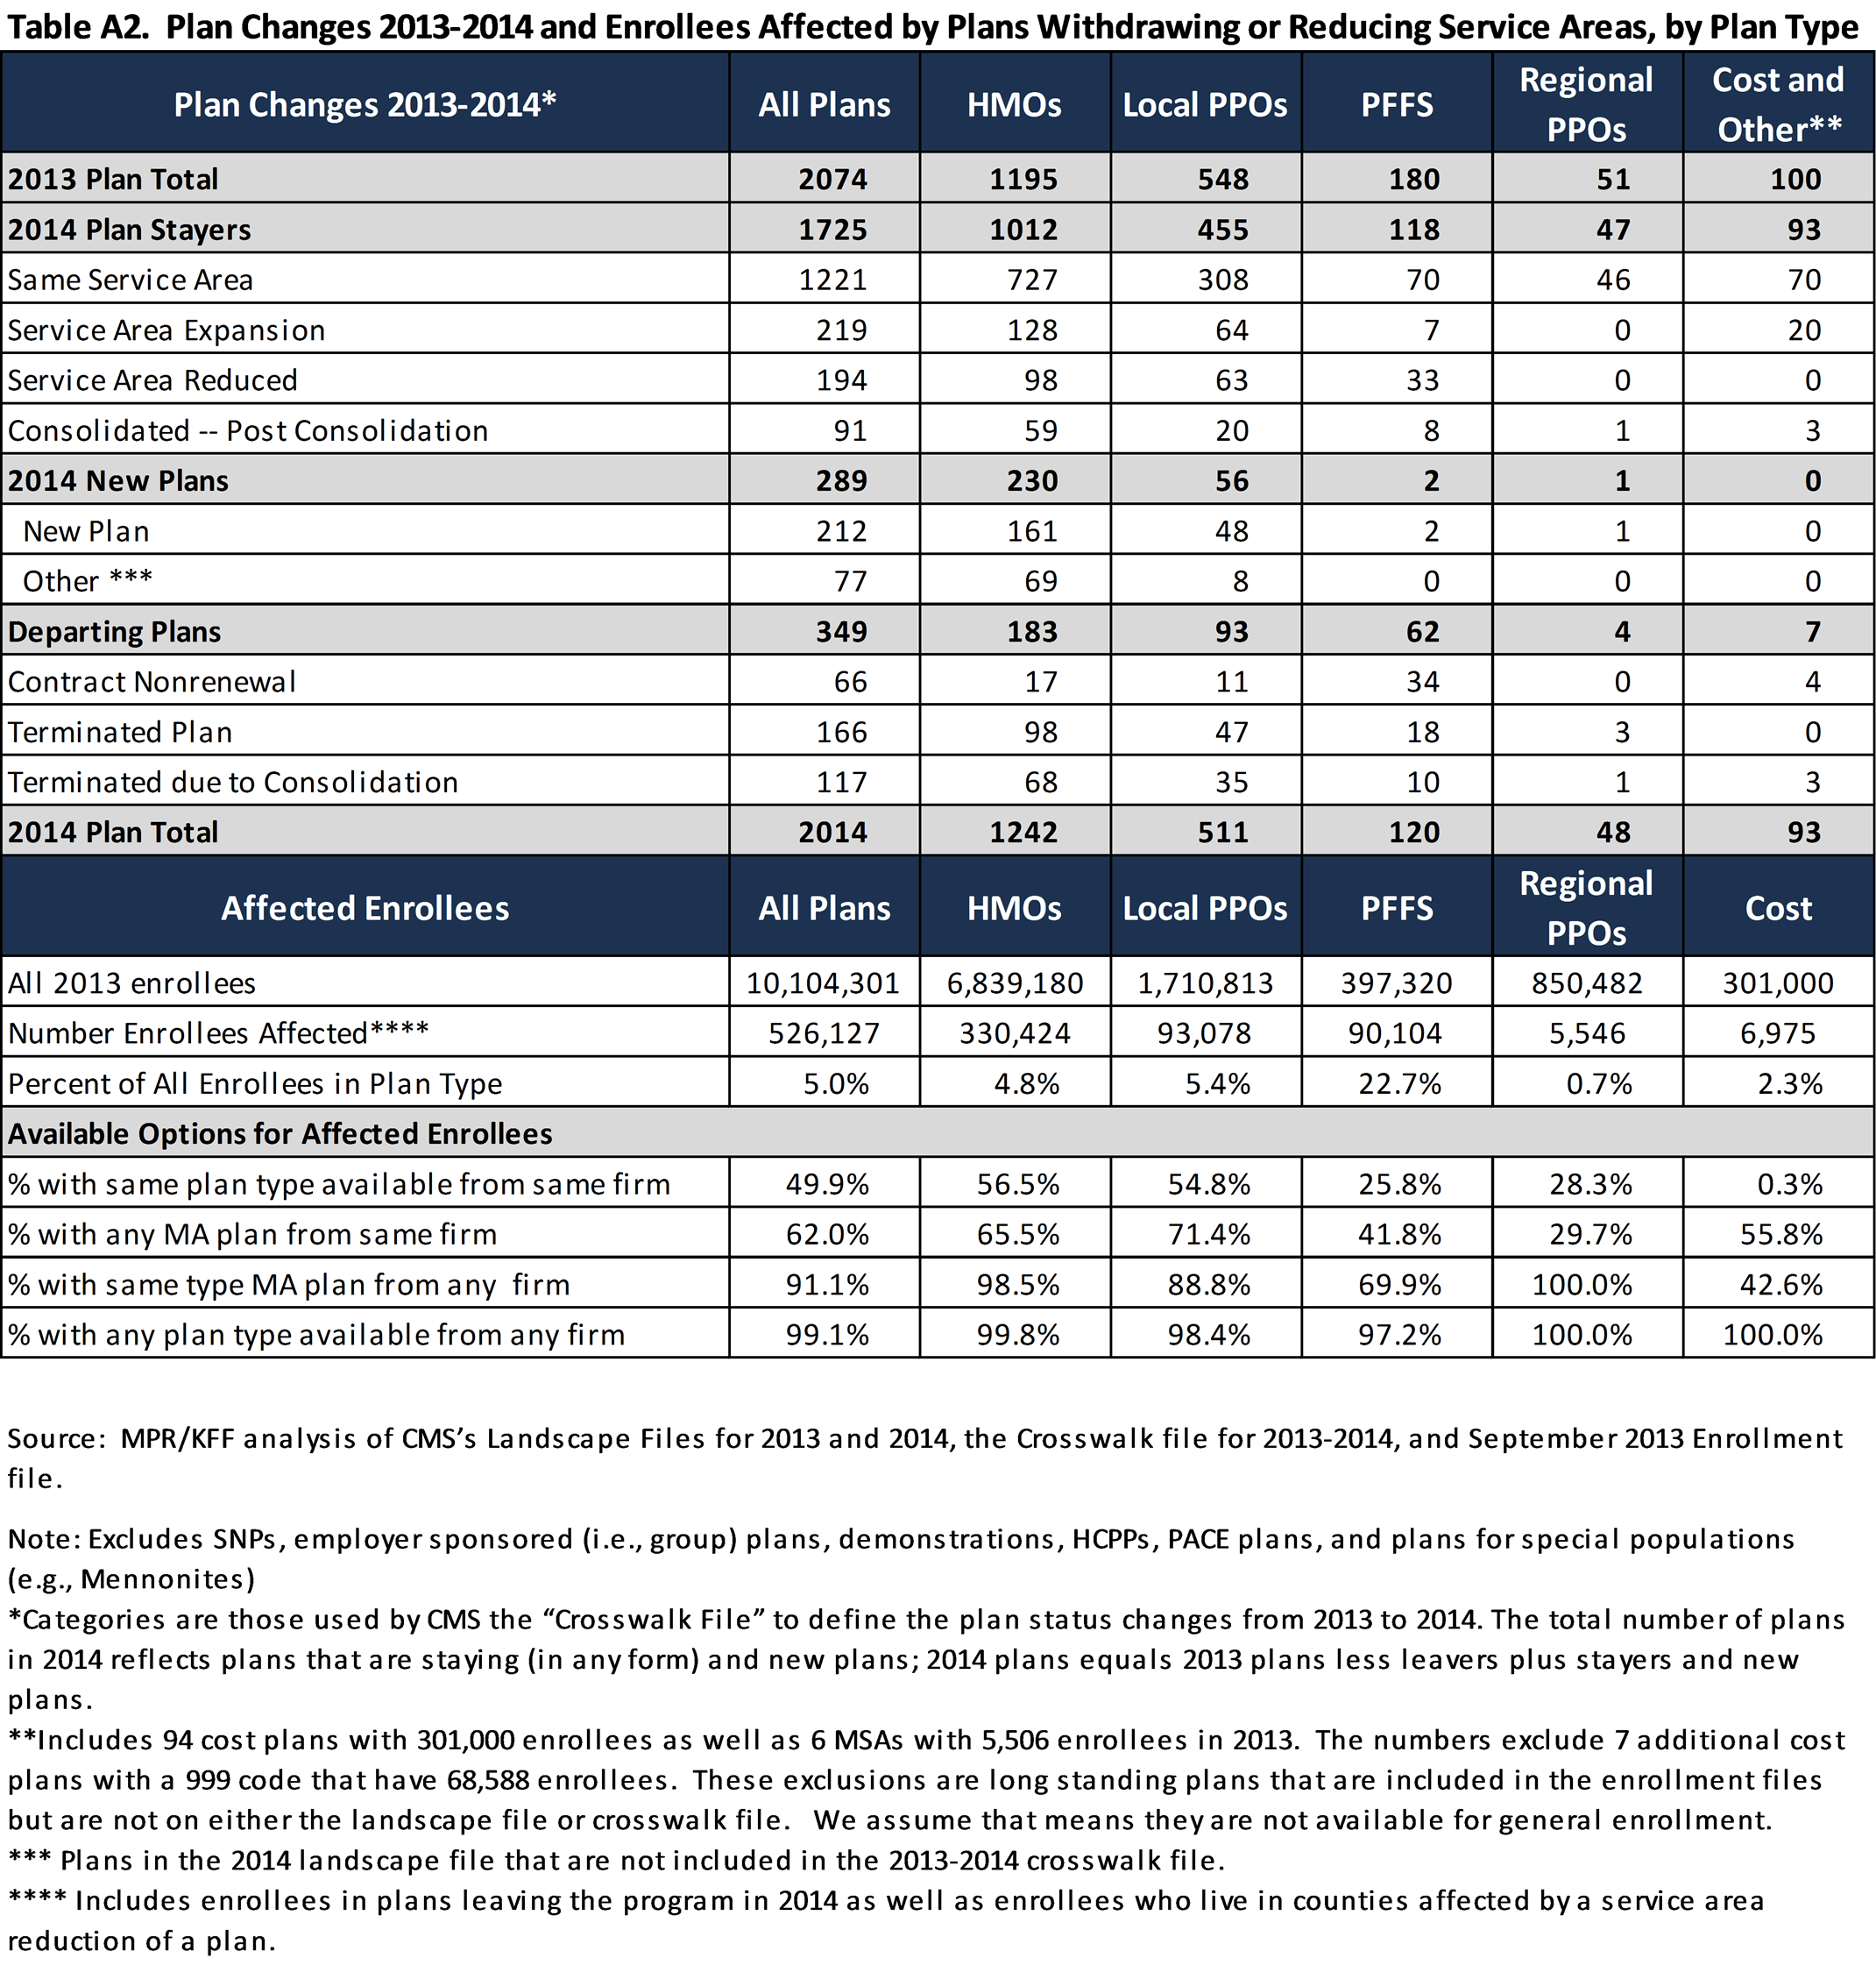
Plan Changes 2013-2014 and Enrollees Affected by Plans Withdrawing or Reducing Service Areas, by Plan Type
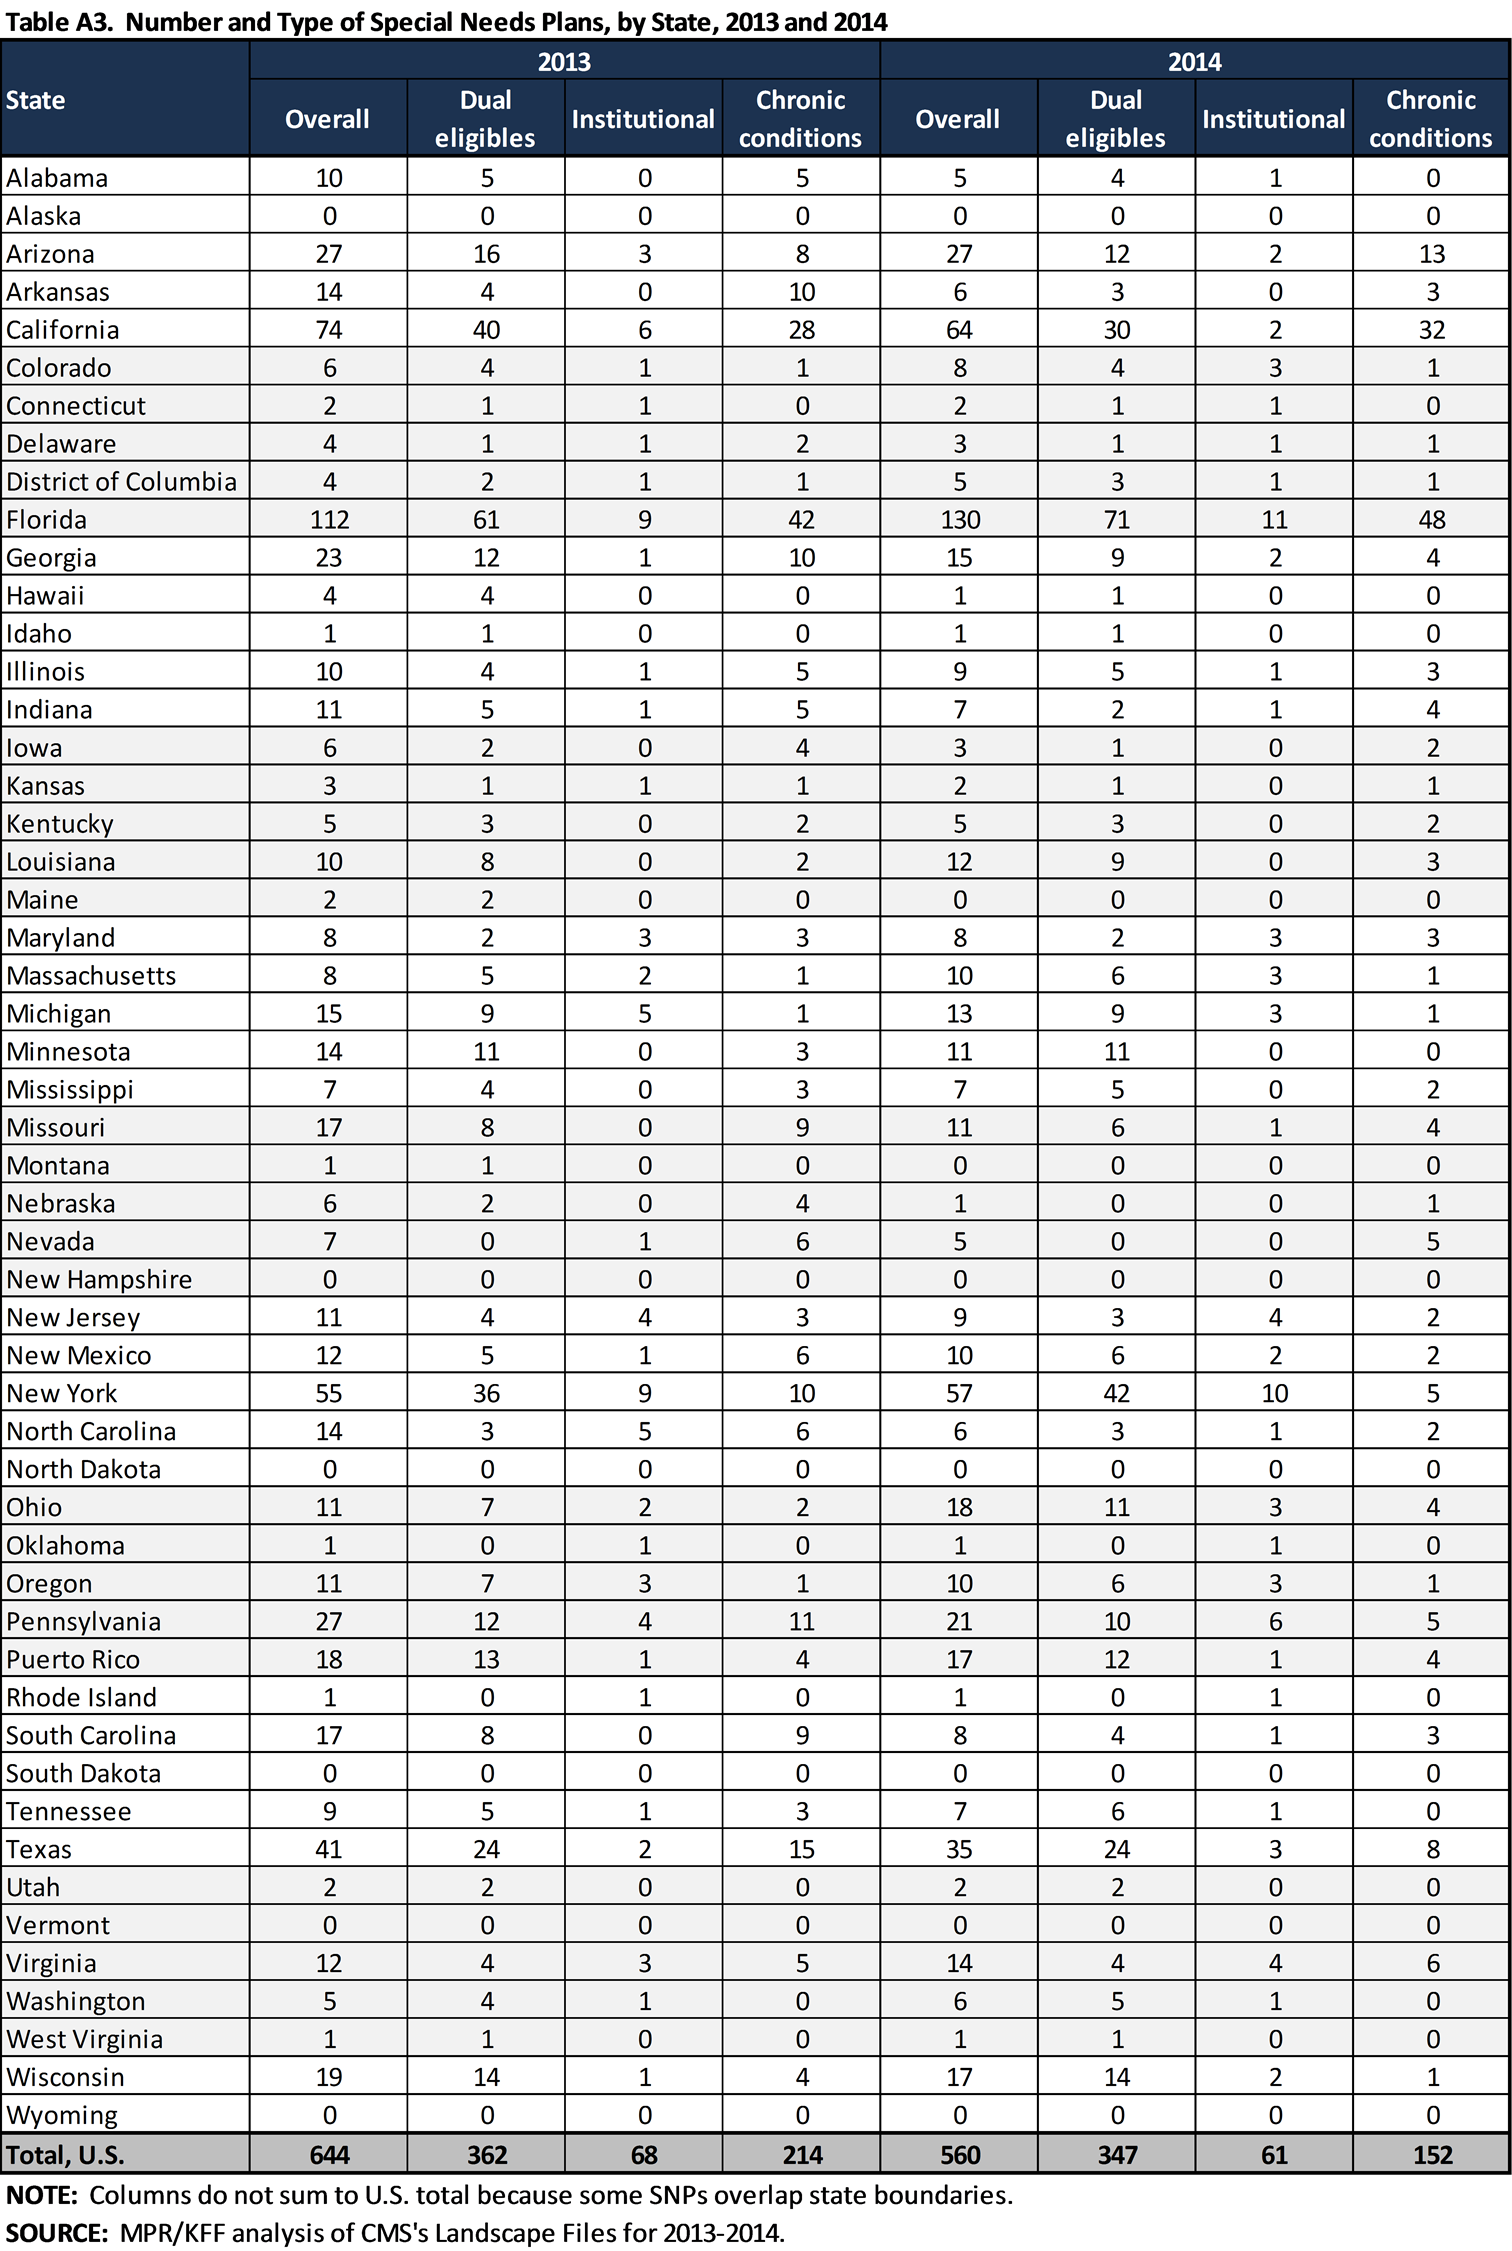
Number and Type of Special Needs Plans, by State, 2013 and 2014
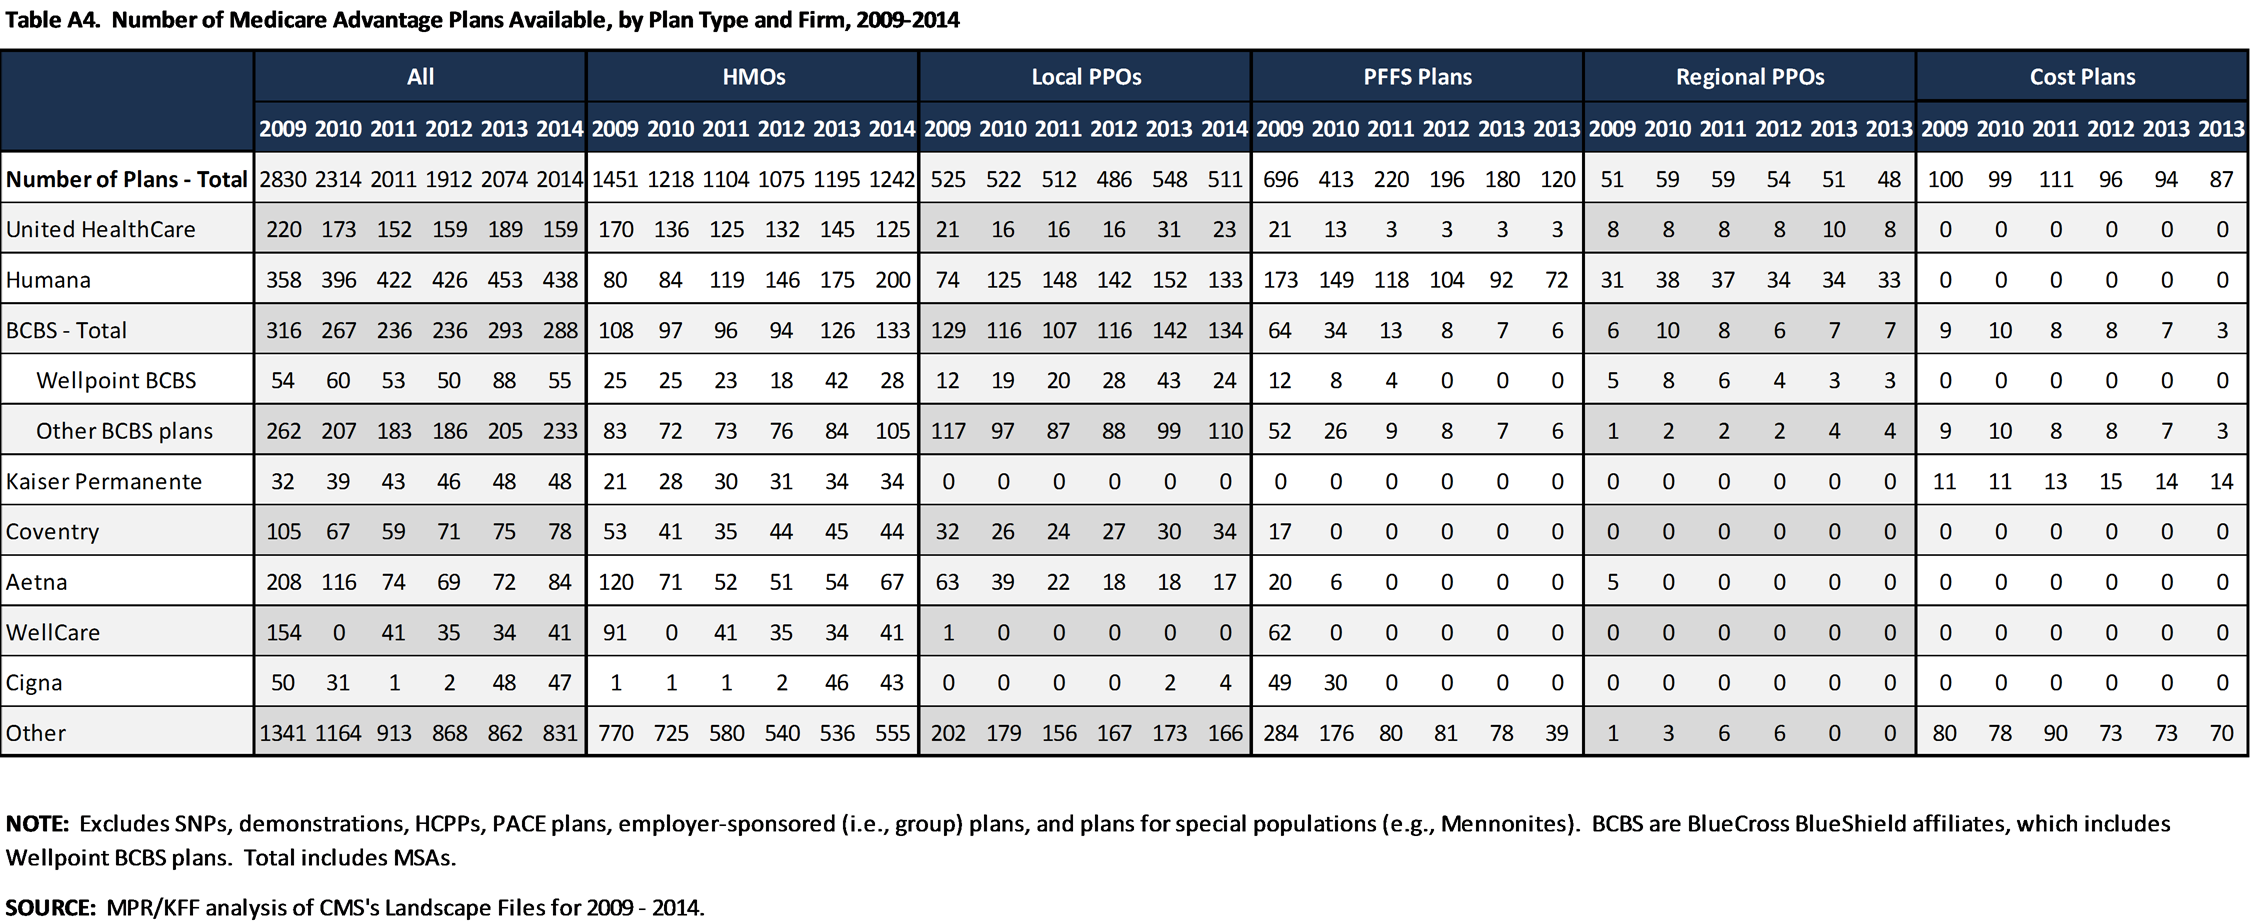
Number of Medicare Advantage Plans Available, by Plan Type and Firm, 2009-2014
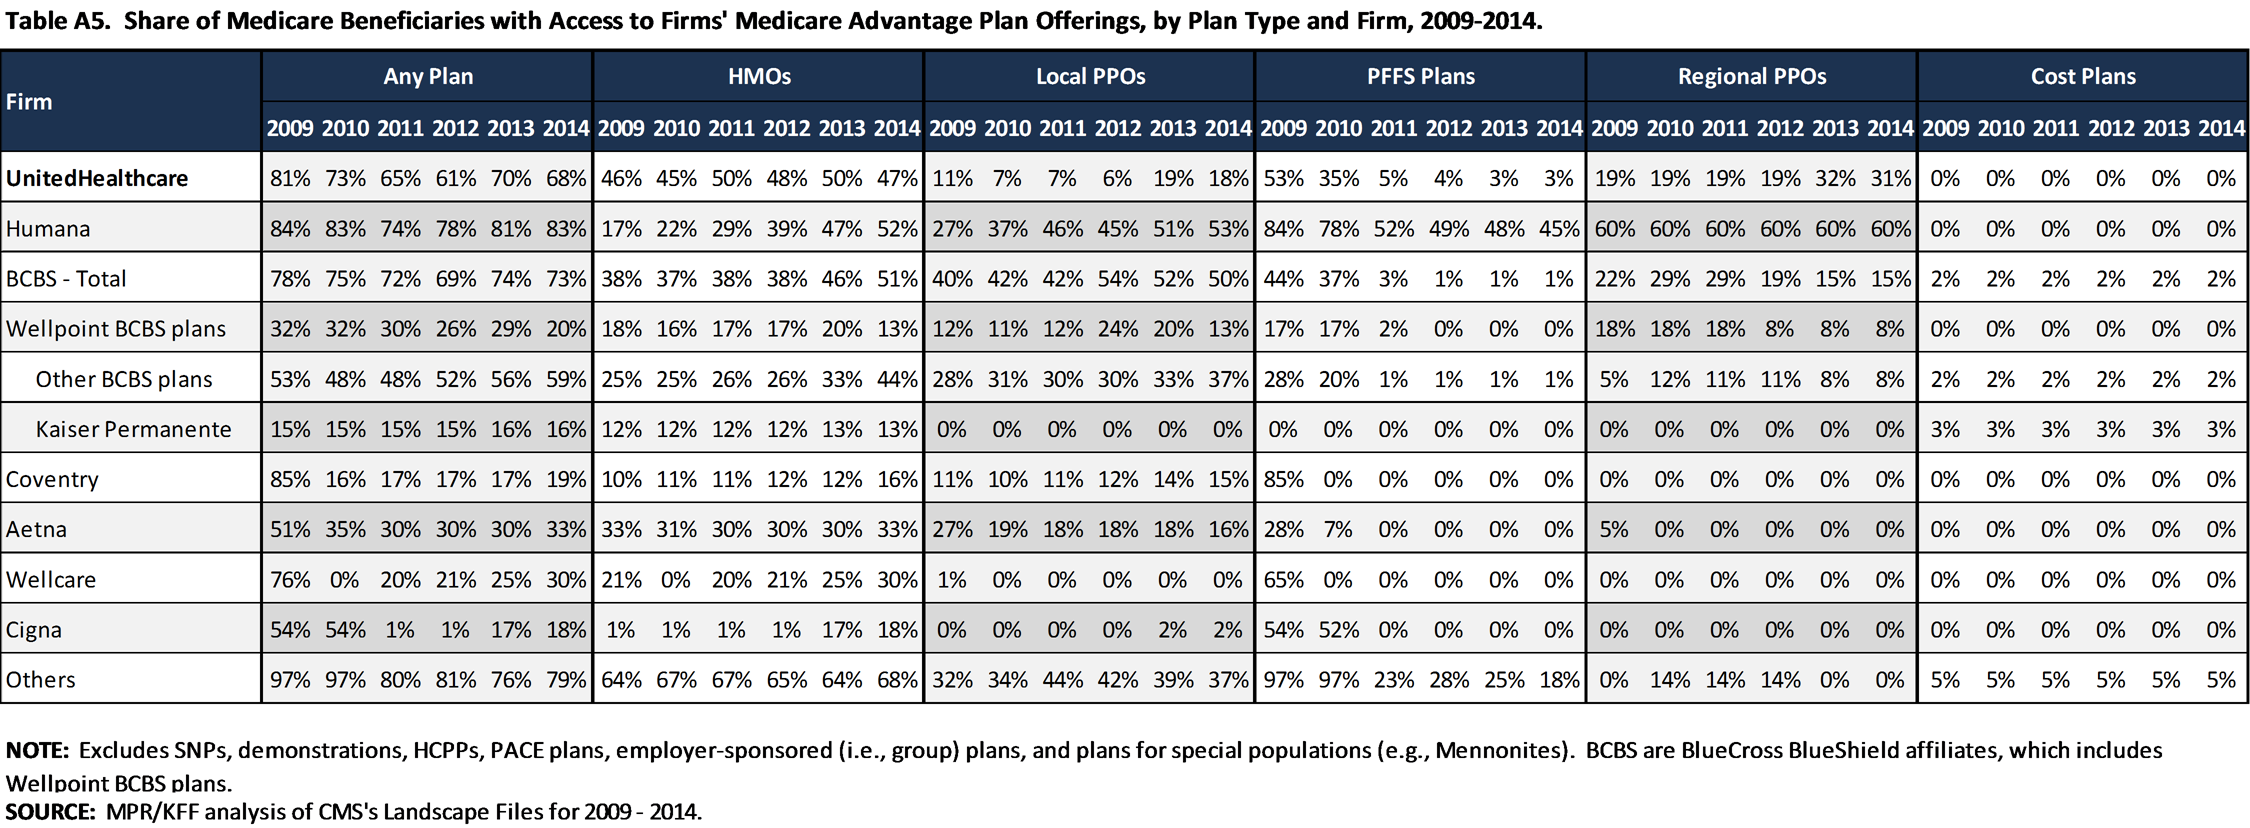
Share of Medicare Beneficiaries with Access to Firms' Medicare Advantage Plan Offerings, by Plan Type and Firm, 2009-2014
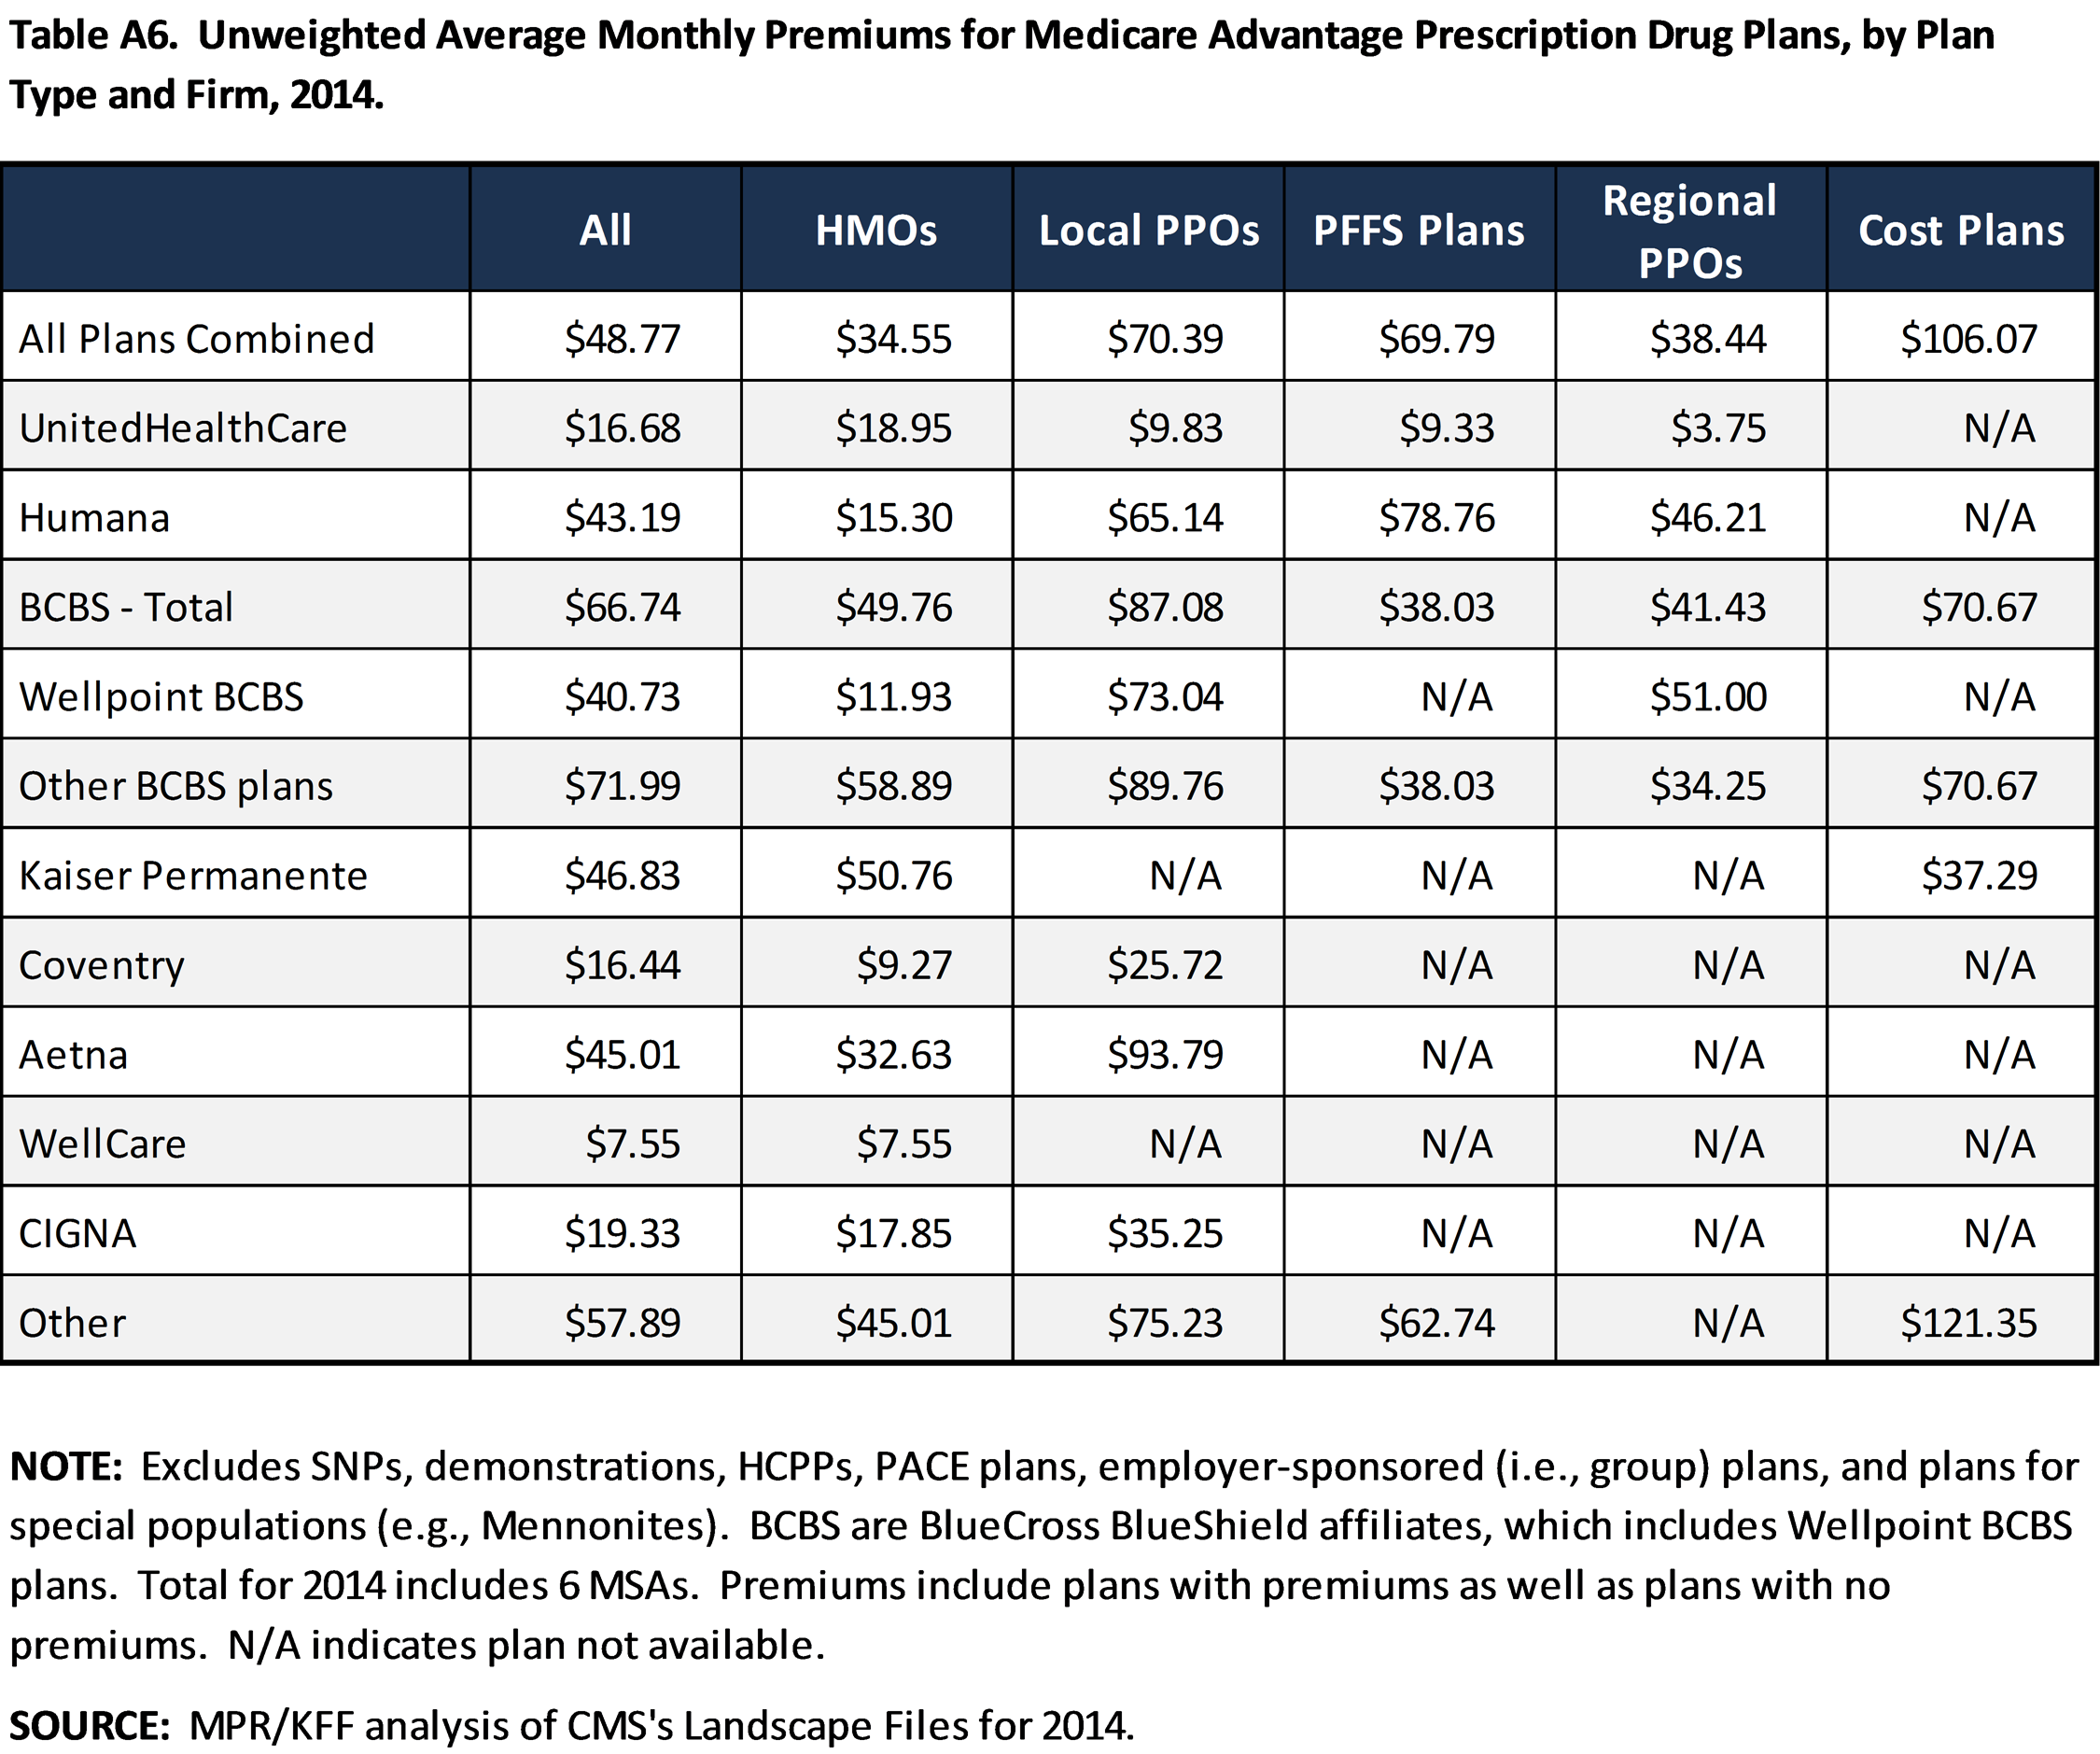
Unweighted Average Monthly Premiums for Medicare Advantage Prescription Drug Plans, by Plan Type and Firm, 2014
