Medical Debt Among People With Health Insurance
Incidence of Medical Debt
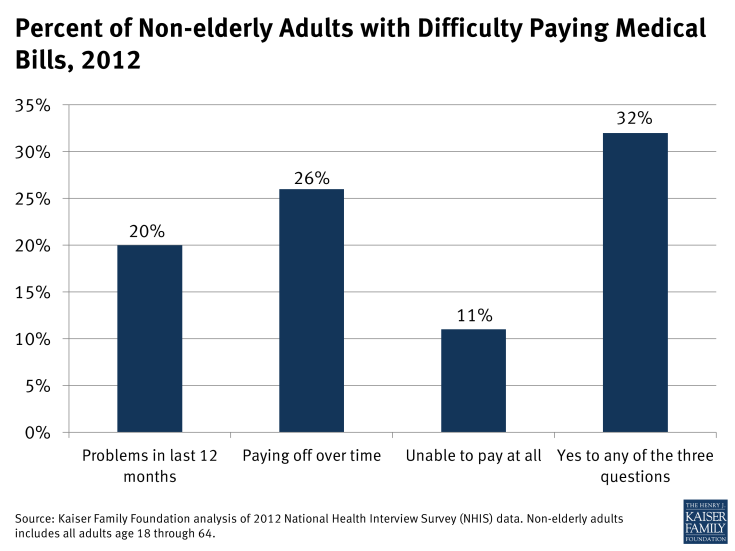
Our analysis of 2012 National Health Interview Survey (NHIS) data, presented below as context for our case studies, finds the problem of medical debt is widespread. This survey finds that 20 percent of non-elderly adults reported difficulty paying medical bills in the previous year. When the question is broadened to include problems paying medical bills over a longer period of time, or inability to pay some medical bills at all, nearly one in three non-elderly adults (32 percent) report having medical bill problems.
In our survey of ClearPoint clients, we identified people who had faced unaffordable medical bills during the prior year. Many who answered yes, however, had incurred medical bills much longer ago and were still struggling to pay them, or had only recently paid them or discharged old debts through bankruptcy.
The total dollar amount of medical debt held in the U.S. is difficult to measure. Medical debt may be masked as other forms of debt, for example, when someone uses a credit card to pay a doctor bill, the amount reflected on a credit report will indicate credit card debt, not medical debt. Similarly, when a person skips a mortgage payment in order to pay a medical bill, the resulting bank debt typically would not be counted as medical debt.
Characteristics of people interviewed for our case studies fall within the range of what broader survey data tell us about medical debt. Our analysis of NHIS data finds that individuals and families across a range of household incomes, ages, employment, family, and insurance statuses report difficulty paying medical bills.
Income – Difficulties with medical bills are more pronounced among the poor and near poor – approximately 4 in 10 nonelderly adults with incomes below 200% of the federal poverty level reported problems affording medical bills – but people with incomes at or above 400% of the federal poverty level also struggle with medical debt.1 People we interviewed had incomes ranging from 75% to over 560% of the federal poverty level.
Employment– People who are unemployed report somewhat higher rates of medical bill problems (35%) compared to people who work full time (30%). Twenty of the people we interviewed worked full time or their spouse worked full time.
Age and Family Size – Medical bill problems affect people regardless of age. Among the non-elderly, medical bill problems are more likely as family size increases; 37 percent of households with 4 or more members experienced medical bill problems in 2012, compared to 25 percent of single person households. People we interviewed ranged in age from their 20s to their 60s. Nine were non-married adults; four were in two-person households; ten were in households of three or more.
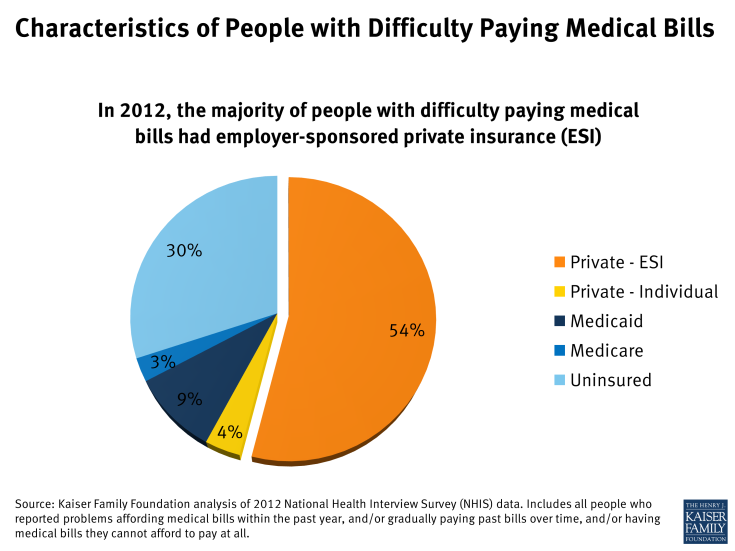
Health Insurance Status – Among non-elderly adults, nearly half (45%) of the uninsured report problems paying medical bills, compared to roughly one-in-four privately insured individuals. The vast majority of people with medical debt (70%) are insured. People with employer-sponsored coverage make up the bulk (54%) of medical debt cases. Of the people we interviewed, 16 were covered under job-based group health plans. Two were covered by individual policies. Five were uninsured for most or all of the time they were incurring unaffordable medical bills (including one who became uninsured when her individual policy was rescinded.)


