Kaiser Family Foundation/CNN Working-Class Whites Poll
Section 3: Not a Monolith
White Americans without college degrees are not a monolithic group in terms of their attitudes and experiences. Below are a few subgroup findings that illustrate some of the nuances within this group.
On the direction of the country:
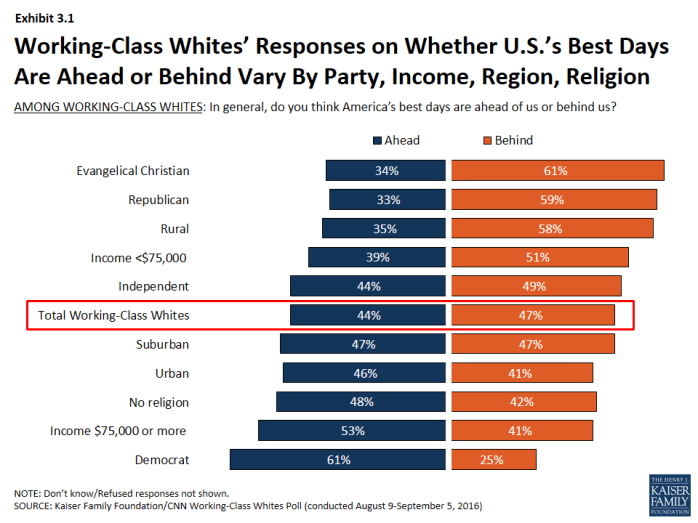
- While working-class whites as a whole are split on whether America’s best days are ahead or behind, some groups stand out as more likely than others to see the country’s best days ahead (Democrats, those with higher incomes, those living in urban areas, and those with no religious preference), while others stand out as more likely to believe the best days are in the past (Republicans, Evangelical Christians, those living in rural areas, and those with lower incomes) (Exhibit 3.1).
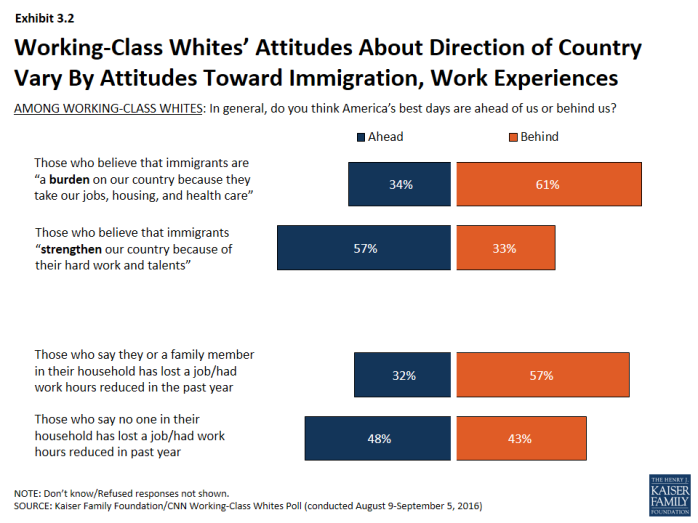
- Other groups are also more likely to believe America’s best days are behind us, including those who see immigrants as a burden on the country (61 percent), and those who say someone in their household has lost a job or had work hours reduced in the last year (57 percent) (Exhibit 3.2).
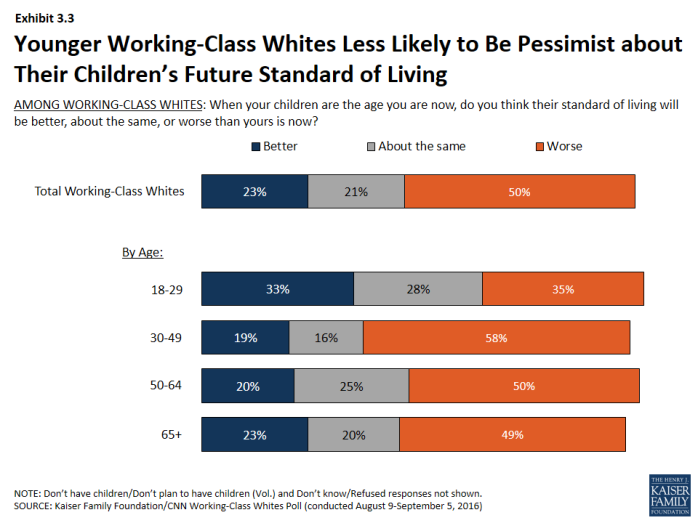
- Views on the future also differ by age; about a third of those under age 30 expect their children to have a worse standard of living than they do now, compared with half or more in older age groups (Exhibit 3.3).
On views of government:
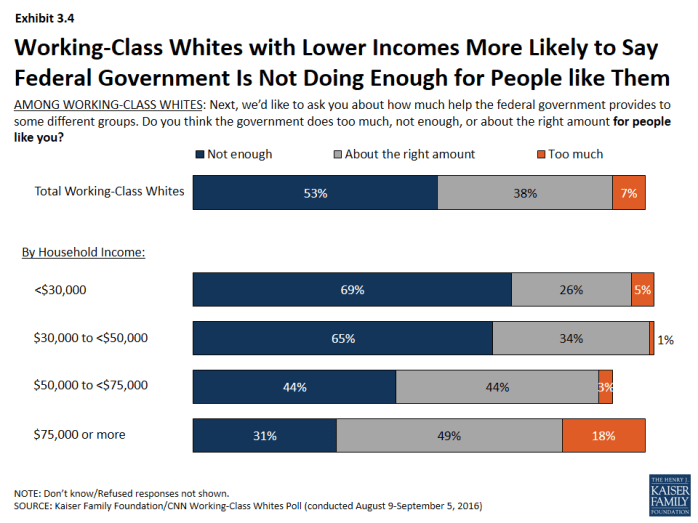
- Views of whether the federal government is doing enough to help “people like you” are strongly correlated with income; 69 percent of those with household incomes less than $30,000 say the government doesn’t do enough, more than twice the share of those earning $75,000 or more (31 percent) (Exhibit 3.4).
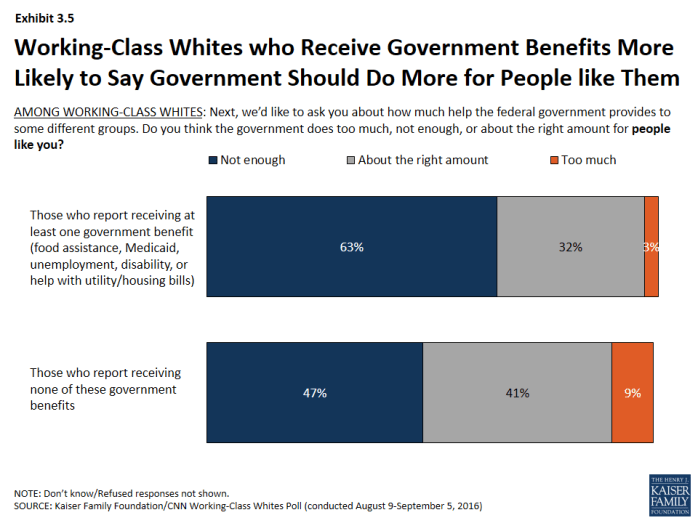
- Perhaps corresponding with this income difference, those who report that their household received at least one government benefit in the past year (excluding Medicare and Social Security, which are provided nearly universally to seniors), are more likely than those who receive no benefits to say the government doesn’t do enough to help people like them (63 percent versus 47 percent) (Exhibit 3.5).
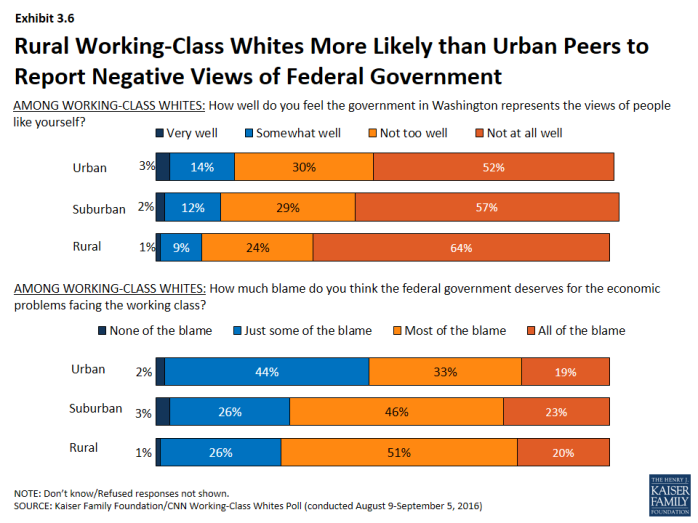
- Rural working-class whites are more likely than those living in urban areas to say the federal government does not represent the views of people like them well at all (64 percent versus 52 percent) and that the government deserves all or most of the blame for the economic problems facing the working-class (71 percent versus 51 percent) (Exhibit 3.6).
On cultural change, immigration, and increasing diversity:
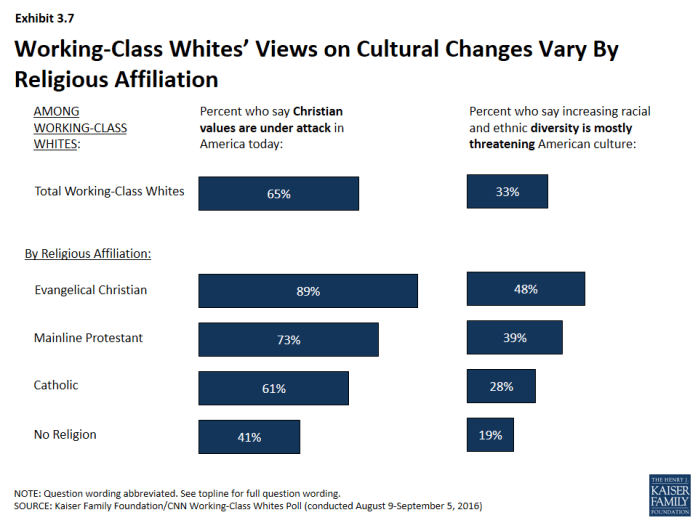
- Views on cultural changes vary among working-class whites by religious identification. For example, 89 percent of working-class whites who are Evangelical Christians believe Christian values are under attack in America today, compared with 73 percent of mainline Protestants, 61 percent of Catholics, and 41 percent of those with no religious preference. Similarly, 48 percent of Evangelical Christians say increasing diversity is threatening American culture, compared with 39 percent of mainline Protestants, 28 percent of Catholics, and 19 percent of those with no religious preference (Exhibit 3.7).
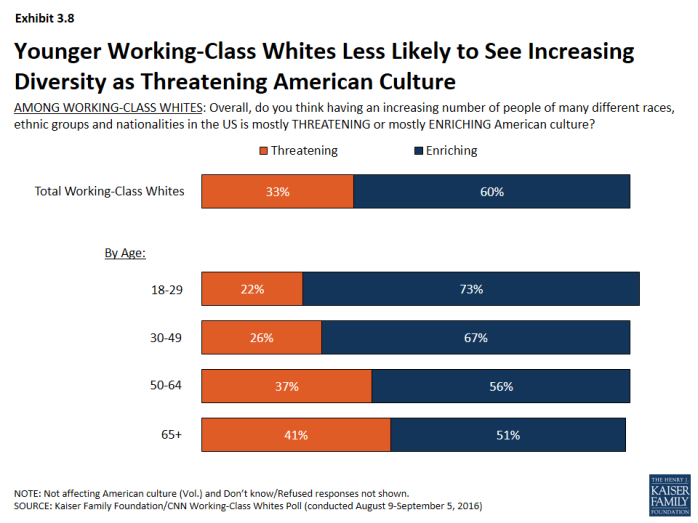
- Views on cultural changes also vary by age; 73 percent of 18-29 year-old working-class whites say that increasing racial and ethnic diversity is enriching American culture, a figure that stands at 51 percent among those ages 65 and over (Exhibit 3.8).
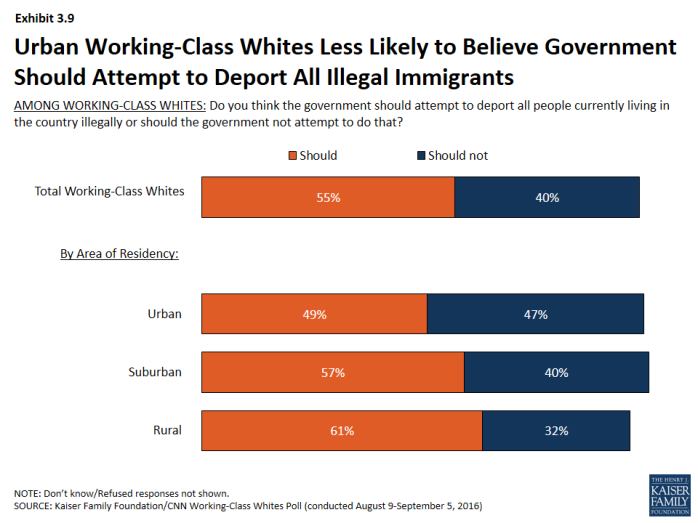
- There are also variations within working-class whites’ views on immigration; 61 percent of rural working-class whites say the government should attempt to deport all people living in the United States illegally, while about half (49 percent) of urban working-class whites agree (Exhibit 3.9).
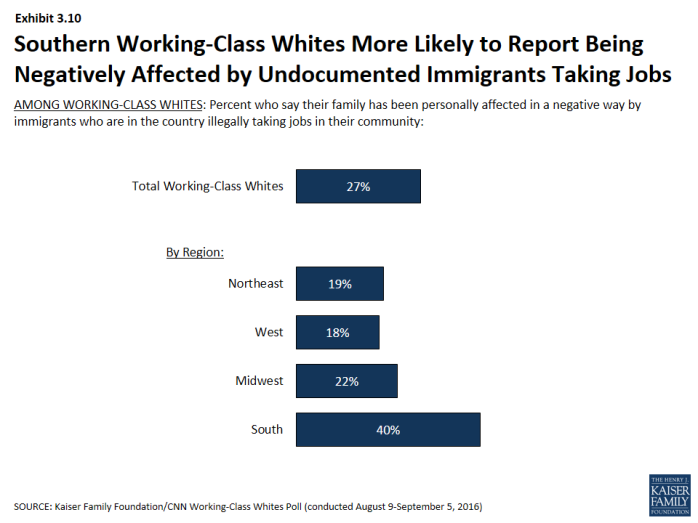
- Working-class whites in the South are about twice as likely as those in other regions to say they’ve personally been negatively impacted by illegal immigrants taking jobs in their community (40 percent versus between 18 to 22 percent in other regions) (Exhibit 3.10).
On their personal lives:
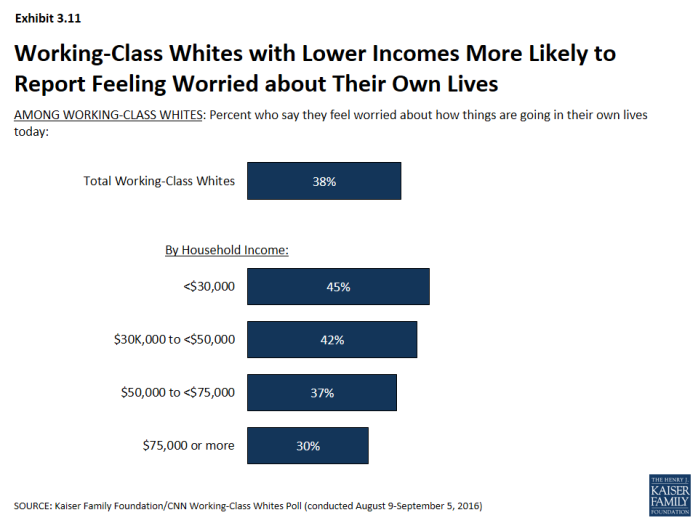
- Almost half (45 percent) of working-class whites with household incomes under $30,000 say they are worried about how things are going in their own lives, compared with just 30 percent of those with incomes of at least $75,000 (Exhibit 3.11).
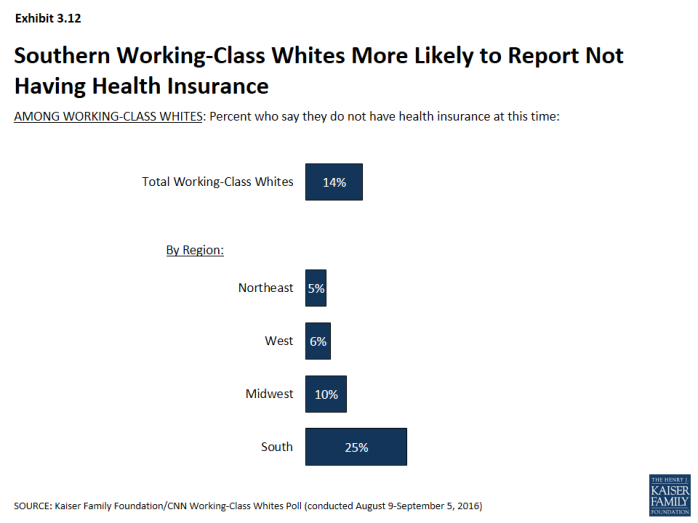
- One quarter (25 percent) of working-class whites in the South do not have health insurance, compared with between 5 and 10 percent in other regions (Exhibit 3.12).
On politics:
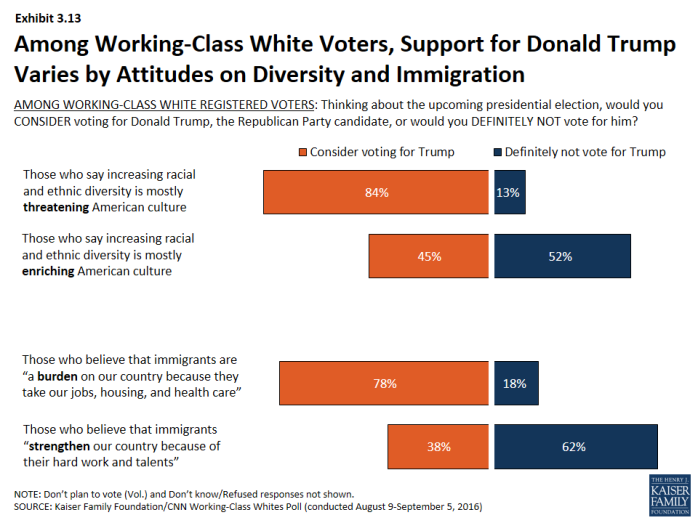
- Besides the obvious partisan differences in candidate support, there are also correlations between working-class whites’ attitudes and their level of support for presidential candidates. For example, 84 percent of working-class white voters who see increasing racial and ethnic diversity as a threat to US culture say they would consider voting for Donald Trump, compared with 45 percent of those who say diversity enriches the culture. Similarly, 78 percent of working-class white voters who say immigrants are a burden on the country say they would consider voting for Trump, compared with 38 percent of those who believe immigrants strengthen the country (Exhibit 3.13).
x
Exhibit 3.1
x
Exhibit 3.2
x
Exhibit 3.3
x
Exhibit 3.4
x
Exhibit 3.5
x
Exhibit 3.6
x
Exhibit 3.7
x
Exhibit 3.8
x
Exhibit 3.9
x
Exhibit 3.10
x
Exhibit 3.11
x
Exhibit 3.12
x

