Wide Disparities in the Income and Assets of People on Medicare by Race and Ethnicity: Now and in the Future
Section 1: Income
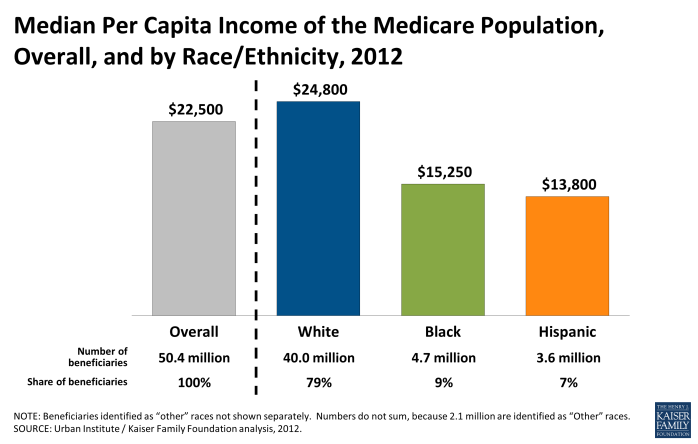
This section describes the income of the Medicare population in 2012 across race/ethnicity. Income takes into account Social Security, pensions, earnings, and other income sources, including income from assets, rental income, and retirement account (IRA) withdrawals. Income is presented on a per person basis; for married people, income is divided equally between spouses to calculate per capita income.
Key Findings:
- Half of all Medicare beneficiaries had annual incomes at or below $22,500 in 2012, with significant variation across race/ethnicity. Median income in 2012 was lower for black and Hispanic beneficiaries ($15,250 and $13,800, respectively) than for white beneficiaries ($24,800).
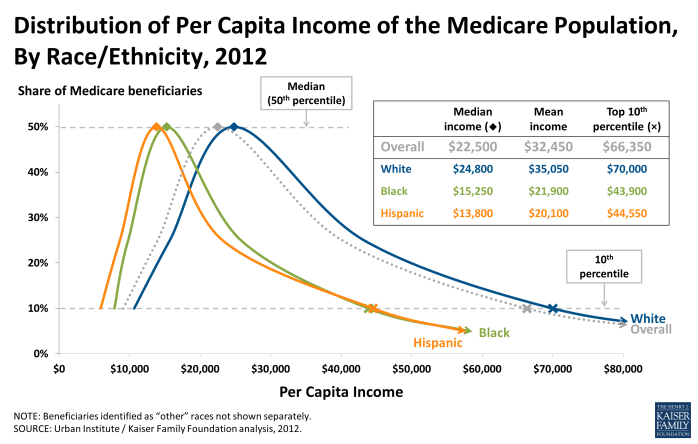
- The distribution of income for the Medicare population differed by race/ethnicity. While the top 10 percent of black and Hispanic beneficiaries had incomes above $43,900 and $44,550, respectively, the top 10 percent of white beneficiaries had incomes above $70,000 in 2012.
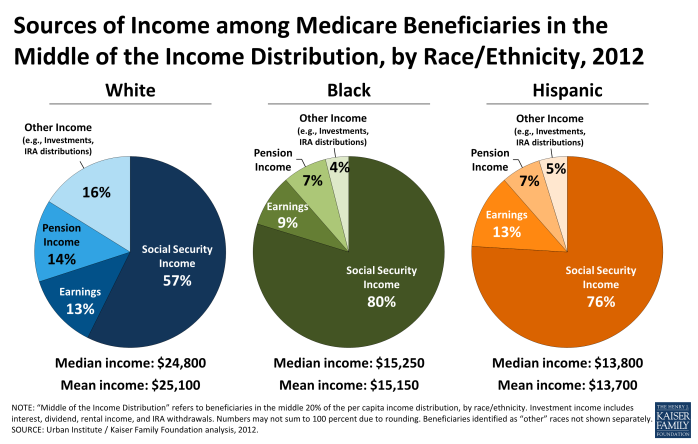
- Social Security accounted for the largest source of income for all beneficiaries in 2012. Among beneficiaries in the middle of the income distribution, Social Security accounted for a larger share of income among black (80%) and Hispanic (76%) beneficiaries than among white beneficiaries (57%). Conversely, investment income (interest, dividends, rental income, and IRA withdrawals) accounted for a larger share of income among white middle income beneficiaries (16%) than among black (4%) or Hispanic (4%) middle income beneficiaries, and defined benefit pensions accounted for twice the share of income among white (14%) than among black (7%) or Hispanic (7%) middle income beneficiaries.
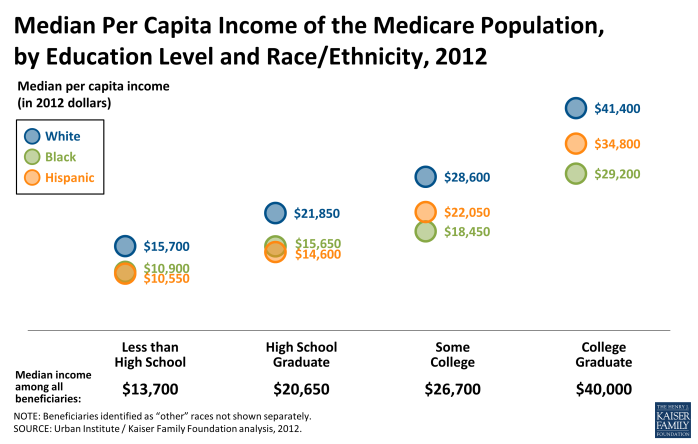
- Median income increased with years of education, but racial/ethnic differences in median income persisted at all education levels. Among college graduates, the median income of white beneficiaries was $41,400 — nearly $7,000 higher than the median income of Hispanic beneficiaries ($34,800), and more than $12,000 higher than the median income of black beneficiaries ($29,200) in 2012.
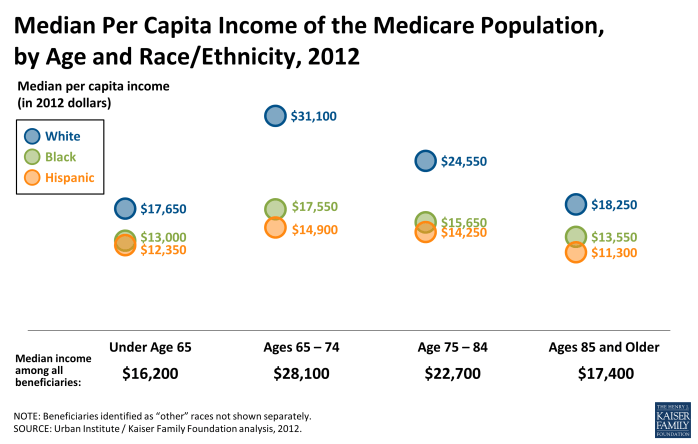
- Racial/ethnic disparities in income were evident in all age groups, and were most pronounced among beneficiaries between the ages of 65 and 74. Among beneficiaries between the ages of 65 and 74, median income among white beneficiaries ($31,100) was about twice as high as median incomes among black or Hispanic beneficiaries ($17,550 and $14,900, respectively) in 2012. Income differences by race/ethnicity were smaller for beneficiaries under the age of 65 and beneficiaries ages 85 and older.
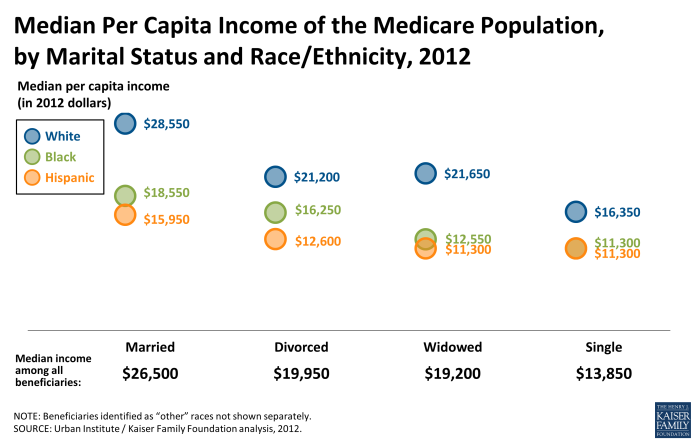
- Median per capita income was higher among married beneficiaries ($26,500) than divorced, widowed, or single beneficiaries ($19,950, $19,200, and $13,850, respectively), with racial/ethnic differences in median income across all marital groups. Among married beneficiaries, per capita median income for white beneficiaries ($28,550) was about $10,000 higher than per capita median incomes for black and Hispanic beneficiaries ($18,550 and $15,950, respectively) in 2012.
‹ Executive Summary Section 2: Financial Assets and Savings ›

