The independent source for health policy research, polling, and news.
Gretchen Jacobson, Shannon Griffin, Tricia Neuman, and Karen Smith
Published:
(click on the image above to enlarge)

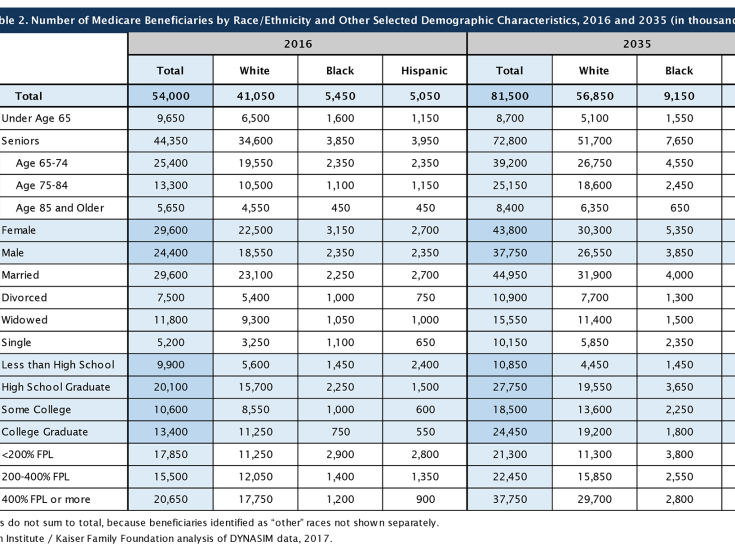
Table 2. Number of Medicare Beneficiaries by Race/Ethnicity and Other Selected Demographic Characteristics, 2016 and 2035 (in thousands)
(click on the image above to enlarge)