Impact of Cost Sharing Reductions on Deductibles and Out-Of-Pocket Limits
The American Health Care Act (AHCA) proposes several changes to the financial support available to people enrolling in nongroup coverage. In addition to modifying the premium tax credits that people would get, the AHCA would eliminate the provision that reduces the cost sharing burden for lower- and moderate income enrollees who get their coverage through the federal or a state marketplace. The cost-sharing reductions are a key part of the financial support currently provided to these enrollees; over 6.4 million people were enrolled in a plan with reduced cost-sharing in 2016 (See State Health Facts ). This note briefly describes the cost-sharing reductions in current law and illustrates their impact by looking at how these provisions affect average deductibles and out-of-pocket maximum limits in benchmark silver plans in 2017 in states using the federally facilitated marketplace.
How Cost Sharing Reductions Work
Under current law, people who are eligible for premium tax credits based on their income also may be eligible for a reduction in their cost sharing (i.e., deductibles, coinsurance, copayments, out-of-pocket limits) if they enroll in a plan in the silver tier. Insurers are required to reduce the cost sharing applicable to people with low and moderate incomes by increasing the actuarial value of the plan that people choose. A silver plan generally has an actuarial value of 70%, which means that the insurers expects to pay, on average, 70% of the covered costs of enrollees in the plan. Insurers must increase the actuarial value to 94% for enrollees with incomes below 150% of poverty, to 87% for enrollees with incomes between 150% and 200% of poverty, and to 73% for enrollees with incomes between 200% and 250% of poverty. They do this by creating variants (called cost sharing reduction, or CSR plans) of each silver plan they offer: each variant lowers the cost sharing to meet the higher actuarial value required. Insurers are periodically reimbursed for the additional claims expenses they incur from lowering the cost sharing in these plans.
The law provides insurers flexibility in determining how cost sharing is arranged in order to meet these actuarial value levels, although the out-of-pocket limits on cost sharing cannot exceed prescribed amounts. An out-of-pocket limit is the maximum an enrollee must pay toward cost sharing for services received in-network; after the limit is reached the insurer pays 100% of the cost for covered services. In 2017, the maximum out-of-pocket limit applicable for most plans is $7,150 for single coverage and twice that amount for family coverage. For CSR plans, the maximum out-of-pocket limits for single coverage are $2,350 for enrollees with incomes below 200% of poverty, and $5,700 for enrollees with incomes between 200% and 250% of poverty1 (For More on Health Insurance subsidies). The limits for family CRS plans are twice the single limits. Table 1 illustrates how the cost sharing in a standard silver plan compares to cost sharing in its CSR variants.
| Table 1: Example of Cost-Sharing Reductions on Plan Cost-Sharing | ||||
| CSR – 94 | CSR – 87 | CSR – 73 | Silver | |
| Combined Medical and Drug Deductible (Individual) | $0 | $500 | $2,275 | $2,400 |
| Out-of-Pocket (Individual) | $1,250 | $2,250 | $5,700 | $7,150 |
| Primary Care Physician Visit | $0 | $10 | $20 | $20 |
| Specialist Physician Visit | $10 | $30 | $55 | $55 |
| Emergency Room Visit | $150 | $205 | $400 | $400 |
| Inpatient Facility | 10% | 20% | 30% | 30% |
| Inpatient Physician | 10% | 20% | 30% | 30% |
| SOURCE: Plan characteristics for “Molina Marketplace Silver Plan” the Second Lowest Cost Plan in Franklin County, Ohio | ||||
Impact of Cost Sharing Reductions
To illustrate the impact of the provisions reducing cost sharing for low and moderate income enrollees, we look at the average reductions in deductibles and out-of-pocket limits in the silver plans offered in the federally facilitated marketplace (see Methods). We focus on the deductibles and out-of-pocket maximums because these are the most visible cost-sharing elements in policies.
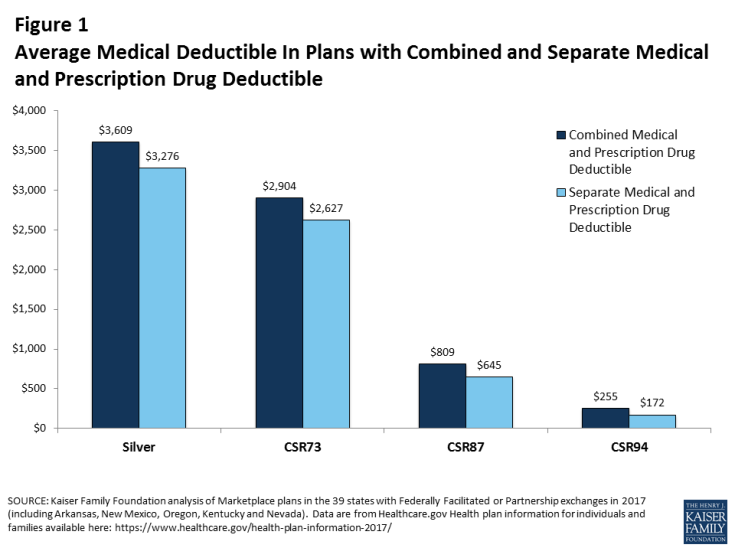
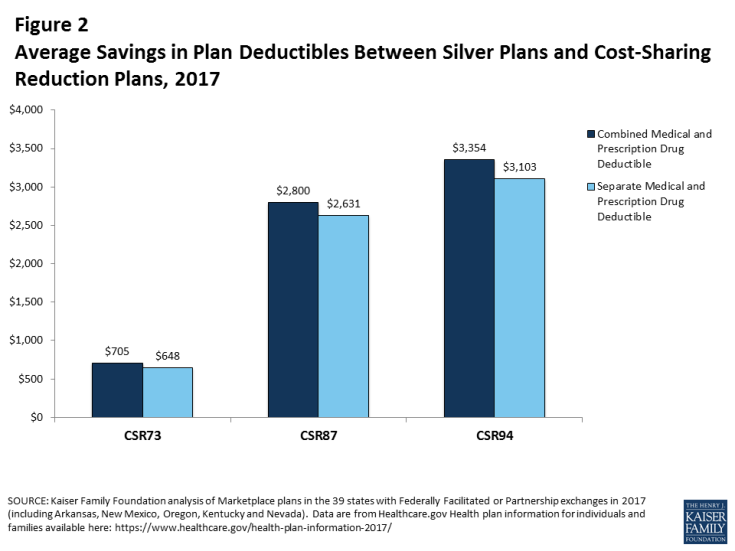
The cost sharing reductions significantly lower deductibles in these plans: for plans where there is a combined deductible for medical care and prescription drugs, the average deductible is reduced for those with incomes below 150% of poverty from $3,609 to $255, a savings of $3,354; for those with incomes between 150% and 200% of poverty the average deductible is reduced to $809 a savings of $2,800 and for enrollees with incomes between 200% and 250% of poverty, the average deductible is $2,904, a savings of $705 (Figure 1 and Figure 2). For plans with a separate deductible for medical care and prescription drugs, the comparable reductions in the deductible for medical care are $3,103, $2,631 and $648 (Figure 2).

Figure 1: Average Medical Deductible In Plans with Combined and Separate Medical and Prescription Drug Deductible

Figure 2: Average Savings in Plan Deductibles Between Silver Plans and Cost-Sharing Reduction Plans, 2017
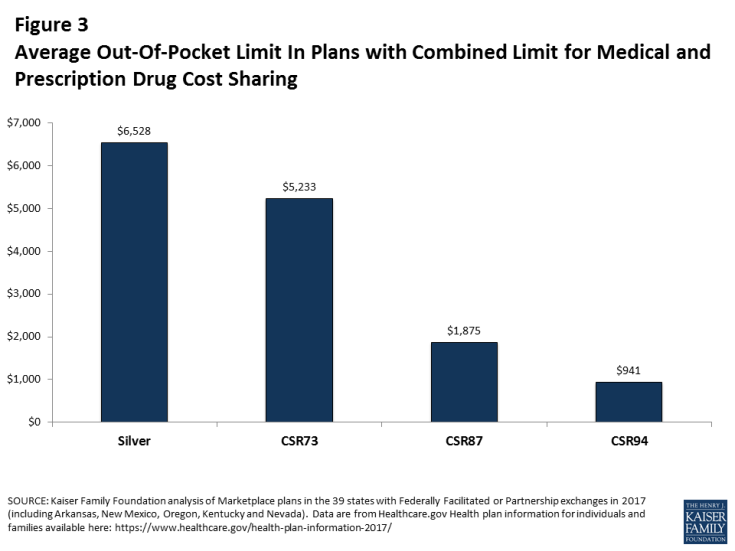
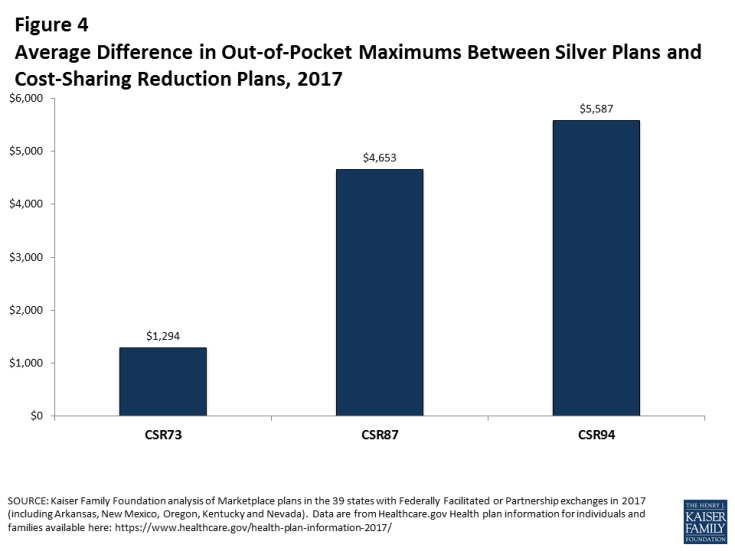
The impacts of the cost sharing reductions on the out-of-pocket limits in these plans is also large. The average combined medical and prescription drug out-of-pocket limit is reduced from $6,528 to $941 for a savings of $5,587 for enrollees with incomes below 150% of poverty. Likewise, the out-of-pocket maximum is reduced to $1,875 a savings of, $4,653 for enrollees with incomes between 150% and 200% of poverty, and reduced to$5,233 for enrollees with incomes between 200% and 250% of poverty, a savings of $1,294 (Figure 3 and Figure 4).

Figure 3: Average Out-Of-Pocket Limit In Plans with Combined Limit for Medical and Prescription Drug Cost Sharing

Figure 4: Average Difference in Out-of-Pocket Maximums Between Silver Plans and Cost-Sharing Reduction Plans, 2017
Discussion
The law provides considerable financial assistance for low and moderate income people who purchase non-group coverage. Premium tax credits, which are income adjusted, help make coverage more affordable, while reduced cost sharing helps to make the out-of-pocket costs at the point of service more affordable when they need care. Insurance policies can require significant cost sharing contributions from enrollees, which can strain the budgets of many families but often are out of reach for people with lower and modest incomes: in 2013, about one-third of nonelderly households with private insurance and with incomes above poverty did not have sufficient financial assets to meet deductibles of $2,500 for single person households or $5,000 for multi-person households, and the percentages are much higher for households with incomes between 100% and 250% of poverty (See Consumer Assets and Patient Cost-Sharing). While reductions in premium tax credits under the AHCA could put insurance out of reach for many low-income people, elimination of cost-sharing subsidies would make the insurance people do buy less valuable.
Methods
Data were obtained from the Data.HealthCare.gov 2017 QHP Landscape on March 17, 2017. Plans analyzed include those offered in 2017 in the 38 states using Healthcare.gov (which includes federally facilitated, supported, and partnership Marketplaces, including Oregon, New Mexico, Nevada and Hawaii).
The analysis focuses on plans in the Silver metal tier. Child-only plans were removed, and the remaining unique records (those with identical cost-sharing structures from the same issuer) were collapsed by state, thereby removing duplications where the same plans are offered in multiple counties within the state. For each Silver plan, we compared the deductible and out-of-pocket amounts with those in 73% actuarial value, 87% actuarial value, and 94% actuarial value cost-sharing variants. Averages are simple averages and not weighted by enrollment as plan-level enrollment data are not publicly available.
